Competency C1: Install Rural Water Supply Systems
Learning Task 2
Select and Size Water Supply Pressure Systems
The purpose of well pumps is to transport water from its source to various supply points within a household or building. However, the selection and sizing of the pump are influenced by various factors, that will dictate the type and size of pump that can be utilized. Therefore, before proceeding with the selection and installation of the pump and accompanying system components, plumbers must carefully evaluate the unique variables specific to each installation.
The plumber will have to:
- Gather well data: Well size, depth, and yield are necessary to select the pump.
- Estimate water demand: Factors such as the number of household members, water usage patterns, and any specific water demands such as irrigation or livestock watering are considered. This will help determine the gallons per minute (GPM) or liters per second (L/s) flow rate needed.
- Calculate the Total Dynamic Head (TDH): The TDH represents the total resistance the pump must overcome to deliver water from the well to its intended destination. It includes factors such as vertical lift, horizontal pipe length, pipe diameter, friction losses, and any elevation changes. Calculate the TDH using hydraulic principles and equations.
- Select the Pump Type: Choose the appropriate type of pump based on the well depth, water quality, and specific application requirements. Common types include submersible deep well pumps, and convertible jet pumps. Consider factors like pump size, motor type (single-phase or three-phase), and the need for additional features like built-in controls or protection mechanisms.
- Size the Pump: Based on the selected pump type, refer to the manufacturer's pump sizing charts or utilize pump sizing software to determine the correct pump size. Consider factors such as the available power supply, discharge pipe size, and the pump's ability to handle the anticipated water demand.
- Select the other major components that suit the installation including: pressure tank, pressure switch, check valves, pressure relief valve, lightning arrestor, and overload protection
Well Data
The well data is used to ensure the proper pump is selected to match the well size, depth and yield. The property owner should have a copy of the well data with their property records. For wells constructed since 2016 the well ID plate number, attached to the casing, can be used to obtain the well records from the online government database. The database contains information on well construction such as date of construction, driller name, well depth, geology that the well is constructed in, estimated well yield/productivity at the time of construction, and static water level.
The diameter of the well will affect the type of pump you can select. The standard casing size is 6”, submersible pumps require a minimum well size of 102 mm (4”).
The depth to the pumping water level is an important consideration in any pumping system. This information is based on the drawdown in the well (Figure 31) when the pump is running, and must be known to ensure that the pump setting depth is sufficient to prevent the water level from dropping below the pump or foot valve level.
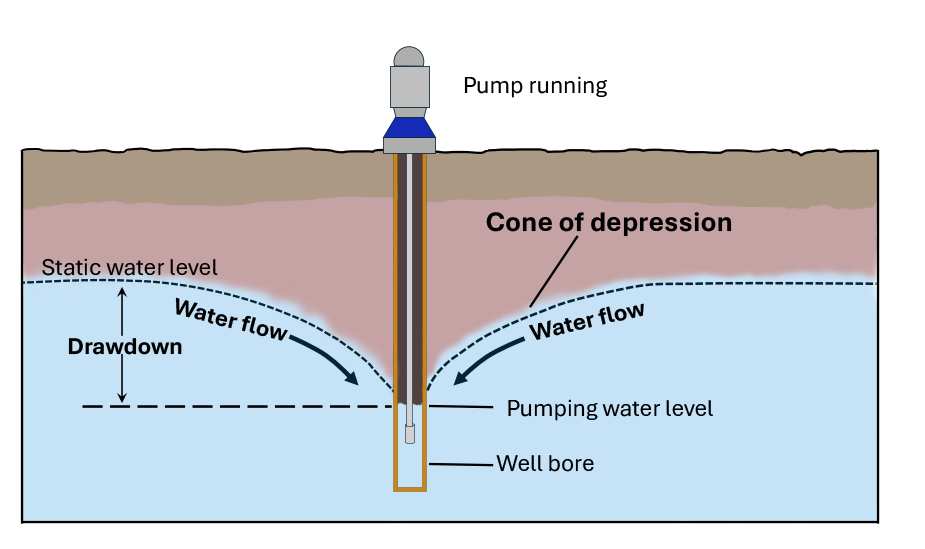
When a well is pumped, water is drawn from the surrounding aquifer or underground water source. As water is extracted, the pressure in the well decreases, causing the water level in the well to drop. The difference between the water level in the well when it is not being pumped (static water level) and the lowered water level during pumping is referred to as the drawdown.
Well Yield
The drilling records will also include data on the productivity of the well at the time of construction. A yield test is performed by the driller to determining the sustainable rate at which the well will produce water. A temporary; pump, flow rate, and water level measuring devices are installed. To perform the yield test, the static water level is first measured then water gets pumped from the well. at a steady rate continuously for at least one hour. The pumping water level is measured at specific intervals during the test to determine the maximum capacity of the well. The well yield will always determine the maximum size pump that the well can accommodate. For most single-family homes, a minimum flow of 6 GPM is suggested from a well or spring. This flow would provide 360 gallons of water each hour, which would be sufficient to meet most home water peak demands. If the maximum pump capacity allowed by the well will not meet the peak flow requirements of the user then other intermediate storage options may need to be employed.
Estimate Water Demand
In general, we use 190 to 380 litres (50 to 100 US gallons) water per person per day in our homes. For the purposes of planning a water system, the total daily water use is less important than the peak usage, as the water demand is rarely evenly spaced over a 24-hour period. There are a number of different methods and guidelines available to determine water demand.
Two common methods of determining residential capacity requirements are:
- Fixture count
- Peak demand tables
Both methods should yield similar results
Fixture Count Method
A simple method is to count the number of fixtures in a house and allow 1 USGPM per fixture. For example, if you had a household with two bathrooms with a toilet, sink and shower in each, a washing machine and laundry sink, 2 outside hose faucets, a kitchen sink and dishwasher you would estimate 12 fixtures so you would need a pump that had a capacity of 12 USGPM.
Peak Demand Tables
There are many versions of peak demand tables similar to the example shown in Figure 32. From the table you conclude the approximate potential number of occupants in the home by looking up the number of bedrooms then cross reference that to the number of available bathrooms. This will give you the necessary pump capacity in GPM to meat the estimated peak demand.
| # of Bedrooms | 1 Bathrooms in Home | 1 ½ Bathrooms in Home | 2-2 ½ Bathrooms in Home | 3-4 Bathrooms in Home |
|---|---|---|---|---|
| 2 | 6 GPM | 8 GPM | 10 GPM | Blank |
| 3 | 8 GPM | 10 GPM | 12 GPM | Blank |
| 4 | 10 GPM | 12 GPM | 14 GPM | 16 GPM |
| 5 | Blank | 13 GPM | 15 GPM | 17 GPM |
| 6 | Blank | Blank | 16 GPM | 18 GPM |
Both methods should yield similar results. Farm applications will require more detailed calculations than residential applications.
Estimating Farm Systems
In addition to the requirement for the house or other structures, the drinking and cleaning requirements of the animals must be determined. A table such as the one shown on Figure 33 can be used to determine the animals daily water requirements. Generally, the pumping system should be capable of supplying the animal’s daily requirements within a two-hour period.
[latex]\text{Pump Capacity (GPM)} = \frac{\text{Total daily requirement (gallons)}}{120 \text{ minutes (2 hours)}}[/latex]
| Type of Animal | Total Usage per Day (Gallons) |
|---|---|
| Horse, mule or steer | 12 |
| Dry cow | 15 |
| Milking cow | 35 |
| Hog | 4 |
| Sheep | 2 |
| Chickens (per 100) | 6 |
| Turkeys (per 100) | 20 |
Additional Supply Considerations
It is important to ensure that water supply systems have sufficient reserve capacity to meet future needs. This includes considering potential expansions of structures, the addition of water-consuming appliances, animals, irrigation, and fire protection requirements. When designing domestic irrigation systems, it is possible to work within the houses calculated demand flow by utilizing zoning and setting timers for off-peak periods.
As mentioned earlier, if the total system demand exceeds the yield of the well, it is necessary to explore intermediate water storage options. In cases where the maximum allowable pump size is nearly sufficient, oversizing the pressure tank may help meet peak demand requirements.
Alternatively, a two-pump system can be installed (Figure 34), where the well pump supplies water to an atmospheric holding tank at a rate that falls within the well's capacity. The size of the tank would be designed to meet the peak demand usage period. A float switch or liquid level sensing devices in the storage tank controls the well pump. This enables the well pump to run for several hours to fill the holding tank, thereby not exceeding the supply capability of the well. The second pump functions as a booster pump, supplying pressurized water from the holding tank to the system. The booster pump is sized to handle the peak demand flow rate.
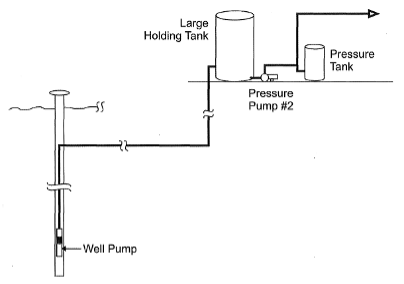
After the capacity requirements of the system have been determined and the well yield confirmed the pumping head requirements of the system must be determined.
Calculate the Total Pumping Head
Centrifugal pumps allow some fluid to remain within the pump casing due to the clearance between the impeller rim and the pump jacket, which permits some slippage of the fluid. This characteristic is important to understand and is why centrifugal pumps are known as variable displacement pumps. As discharge pressure or height (pumping head) increases, the pump's capacity to move water diminishes due to increased slippage.
To calculate the total pumping head, it is necessary to consider various factors that affect water flow, including:
- Vertical suction lift from the water source to the pump
- Suction pipe friction loss
- Vertical discharge lift from the pump to the intended point of use
- Discharge pipe friction loss
- Desired pressure at the point of use
It is important to note that the pump does not differentiate between head (vertical lift) and pressure or height of the pumped fluid. Therefore, all measurements need to be converted into feet of head for accurate calculation and understanding.
Suction head is all of the resistance created by the vertical lift from the water in the well to the pump. Discharge head is all of the resistance created on the discharge side of the pump. For submersible installations there are no suction resistance factors to consider in the total pumping head calculations.
Pipe Friction Loss
Any two substances that touch while moving past one another will cause friction, and this is also true of water travelling through a pipe. The piping friction loss is the loss of pressure or head caused by this movement.
Friction loss on the suction side adds feet in lift. Friction loss on the discharge side results in a loss of pressure. Although in reality, friction loss and how it contributes to the overall pump resistance are the same on both the suction and discharge sides of the pump.
The amount of friction loss that increases the total head of a pumping system depends on many things, including type, length and size of pipe and fittings, as well as rate of flow. There are many sources of information available to assist you in determining the piping friction loss including formulas, spreadsheets, tables and phone apps. Two examples of friction loss tables are shown in Figure 35. It is important to use a table that matches the type of pipe. You will notice when comparing these two tables the friction loss shown for the same nominal sizes is much lower on the PE than the PVC. In this case it is primarily due to the smaller inside diameter of the IPS Sch80 PVC compared to the PE SDR size.
| Flow (gpm) | 1", ID: 1.049 | 1 ¼", ID: 1.380 | 1 ½", ID: 1.610 | 2", ID: 2.067 |
|---|---|---|---|---|
| 1 | Velocity (ft/s): 0.37,
Loss (psi): 0.04 |
Velocity (ft/s): 0.21,
Loss (psi): 0.01 |
Velocity (ft/s): 0.16,
Loss (psi): 0.00 |
Velocity (ft/s): 0.10,
Loss (psi): 0.00 |
| 2 | Velocity (ft/s): 0.74,
Loss (psi): 0.14 |
Velocity (ft/s): 0.43,
Loss (psi): 0.04 |
Velocity (ft/s): 0.31,
Loss (psi): 0.02 |
Velocity (ft/s): 0.19,
Loss (psi): 0.01 |
| 3 | Velocity (ft/s): 1.11,
Loss (psi): 0.29 |
Velocity (ft/s): 0.64,
Loss (psi): 0.08 |
Velocity (ft/s): 0.47,
Loss (psi): 0.04 |
Velocity (ft/s): 0.29,
Loss (psi): 0.01 |
| 4 | Velocity (ft/s): 1.48,
Loss (psi): 0.50 |
Velocity (ft/s): 0.86,
Loss (psi): 0.13 |
Velocity (ft/s): 0.63,
Loss (psi): 0.06 |
Velocity (ft/s): 0.38,
Loss (psi): 0.02 |
| 5 | Velocity (ft/s): 1.85,
Loss (psi): 0.76 |
Velocity (ft/s): 1.07,
Loss (psi): 0.20 |
Velocity (ft/s): 0.79,
Loss (psi): 0.09 |
Velocity (ft/s): 0.48,
Loss (psi): 0.03 |
| 6 | Velocity (ft/s): 2.22,
Loss (psi): 1.06 |
Velocity (ft/s): 1.29,
Loss (psi): 0.28 |
Velocity (ft/s): 0.94,
Loss (psi): 0.13 |
Velocity (ft/s): 0.57,
Loss (psi): 0.04 |
| 7 | Velocity (ft/s): 2.60,
Loss (psi): 1.41 |
Velocity (ft/s): 1.50,
Loss (psi): 0.37 |
Velocity (ft/s): 1.10,
Loss (psi): 0.18 |
Velocity (ft/s): 0.67,
Loss (psi): 0.05 |
| 8 | Velocity (ft/s): 2.97,
Loss (psi): 1.80 |
Velocity (ft/s): 1.71,
Loss (psi): 0.47 |
Velocity (ft/s): 1.26,
Loss (psi): 0.22 |
Velocity (ft/s): 0.76,
Loss (psi): 0.07 |
| 9 | Velocity (ft/s): 3.34,
Loss (psi): 2.24 |
Velocity (ft/s): 1.93,
Loss (psi): 0.59 |
Velocity (ft/s): 1.42,
Loss (psi): 0.28 |
Velocity (ft/s): 0.86,
Loss (psi): 0.08 |
| 10 | Velocity (ft/s): 3.71,
Loss (psi): 2.73 |
Velocity (ft/s): 2.14,
Loss (psi): 0.72 1 |
Velocity (ft/s): 1.57,
Loss (psi): 0.34 |
Velocity (ft/s): 0.95,
Loss (psi): 0.10 |
| 11 | Velocity (ft/s): 4.08,
Loss (psi): 3.25 |
Velocity (ft/s): 2.36,
Loss (psi): 0.86 |
Velocity (ft/s): 1.73,
Loss (psi): 0.40 |
Velocity (ft/s): 1.05,
Loss (psi): 0.12 |
| 12 | Velocity (ft/s): 4.45,
Loss (psi): 3.82 |
Velocity (ft/s): 2.57,
Loss (psi): 1.01 |
Velocity (ft/s): 1.89,
Loss (psi): 0.48 |
Velocity (ft/s): 1.15,
Loss (psi): 0.14 |
| 14 | Velocity (ft/s): 5.19,
Loss (psi): 5.08 |
Velocity (ft/s): 3.00,
Loss (psi): 1.34 |
Velocity (ft/s): 2.20,
Loss (psi): 0.63 |
Velocity (ft/s): 1.34,
Loss (psi): 0.19 |
| 16 | Velocity (ft/s): 5.93,
Loss (psi): 6.51 |
Velocity (ft/s): 3.43,
Loss (psi): 1.71 |
Velocity (ft/s): 2.52,
Loss (psi): 0.81 |
Velocity (ft/s): 1.53,
Loss (psi): 0.24 |
| 18 | Velocity (ft/s): 6.67,
Loss (psi): 8.10 |
Velocity (ft/s): 3.86,
Loss (psi): 2.13 |
Velocity (ft/s): 2.83,
Loss (psi): 1.01 |
Velocity (ft/s): 1.72,
Loss (psi): 0.30 |
| 20 | Velocity (ft/s): 7.42,
Loss (psi): 9.84 |
Velocity (ft/s): 4.28,
Loss (psi): 2.59 |
Velocity (ft/s): 3.15,
Loss (psi): 1.22 |
Velocity (ft/s): 1.91,
Loss (psi): 0.36 |
| 22 | Velocity (ft/s): 8.16,
Loss (psi): 11.74 |
Velocity (ft/s): 4.71,
Loss (psi): 3.09 |
Velocity (ft/s): 3.46,
Loss (psi): 1.46 |
Velocity (ft/s): 2.10,
Loss (psi): 0.43 |
| 24 | Velocity (ft/s): 8.90,
Loss (psi): 13.79 |
Velocity (ft/s): 5.14,
Loss (psi): 3.63 |
Velocity (ft/s): 3.78,
Loss (psi): 1.72 |
Velocity (ft/s): 2.29,
Loss (psi): 0.51 |
| 26 | Velocity (ft/s): 9.64,
Loss (psi): 16.00 |
Velocity (ft/s): 5.57,
Loss (psi): 4.21 |
Velocity (ft/s): 4.09,
Loss (psi): 1.99 |
Velocity (ft/s): 2.48,
Loss (psi): 0.59 |
| 28 | Velocity (ft/s): 10.38,
Loss (psi): 18.35 |
Velocity (ft/s): 6.00,
Loss (psi): 4.83 |
Velocity (ft/s): 4.41,
Loss (psi): 2.28 |
Velocity (ft/s): 2.67,
Loss (psi): 0.68 |
| 30 | Velocity (ft/s): 11.12,
Loss (psi): 20.85 |
Velocity (ft/s): 6.43,
Loss (psi): 5.49 |
Velocity (ft/s): 4.72,
Loss (psi): 2.59 |
Velocity (ft/s): 2.86,
Loss (psi): 0.77 |
| 35 | Velocity (ft/s): 12.98,
Loss (psi): 27.74 |
Velocity (ft/s): 7.50,
Loss (psi): 7.30 |
Velocity (ft/s): 5.51,
Loss (psi): 3.45 |
Velocity (ft/s): 3.34,
Loss (psi): 1.02 |
| 40 | Blank | Velocity (ft/s): 8.57,
Loss (psi): 9.35 |
Velocity (ft/s): 6.30,
Loss (psi): 4.42 |
Velocity (ft/s): 3.82,
Loss (psi): 1.31 |
| 45 | Blank | Velocity (ft/s): 9.64,
Loss (psi): 11.63 |
Velocity (ft/s): 7.08,
Loss (psi): 5.49 |
Velocity (ft/s): 4.30,
Loss (psi): 1.63 |
| 50 | Blank | Velocity (ft/s): 10.71,
Loss (psi): 14.14 |
Velocity (ft/s): 7.87,
Loss (psi): 6.68 |
Velocity (ft/s): 4.77,
Loss (psi): 1.98 |
| 55 | Blank | Velocity (ft/s): 11.78,
Loss (psi): 16.87 |
Velocity (ft/s): 8.66,
Loss (psi): 7.97 |
Velocity (ft/s): 5.25,
Loss (psi): 2.36 |
| 60 | Blank | Velocity (ft/s): 12.85,
Loss (psi): 19.82 |
Velocity (ft/s): 9.44,
Loss (psi): 9.36 |
Velocity (ft/s): 5.73,
Loss (psi): 2.77 |
| 65 | Blank | Blank | Velocity (ft/s): 10.23,
Loss (psi): 10.86 |
Velocity (ft/s): 6.21,
Loss (psi): 3.22 |
| 70 | Blank | Blank | Velocity (ft/s): 11.02,
Loss (psi): 12.45 |
Velocity (ft/s): 6.68,
Loss (psi): 3.69 |
| 75 | Blank | Blank | Velocity (ft/s): 11.81,
Loss (psi): 14.15 |
Velocity (ft/s): 7.16,
Loss (psi): 4.19 |
| 80 | Blank | Blank | Velocity (ft/s): 12.59,
Loss (psi): 15.95 |
Velocity (ft/s): 7.64,
Loss (psi): 4.73 |
| 85 | Blank | Blank | Velocity (ft/s): 13.38,
Loss (psi): 17.84 |
Velocity (ft/s): 8.12,
Loss (psi): 5.29 |
| 90 | Blank | Blank | Blank | Velocity (ft/s): 8.59,
Loss (psi): 5.88 |
| 95 | Blank | Blank | Blank | Velocity (ft/s): 9.07,
Loss (psi): 6.50 |
| 100 | Blank | Blank | Blank | Velocity (ft/s): 9.55,
Loss (psi): 7.15 |
| Flow (gpm) | 1", ID: 0.935 | 1 ¼", ID: 1.254 | 1 ½", ID: 1.476 | 2", ID: 1.913 |
|---|---|---|---|---|
| 1 | Velocity (ft/s): 0.47,
Loss (psi): 0.06 |
Velocity (ft/s): 0.26,
Loss (psi): 0.01 |
Velocity (ft/s): 0.19,
Loss (psi): 0.01 |
Velocity (ft/s): 0.11,
Loss (psi): 0.00 |
| 2 | Velocity (ft/s): 0.93,
Loss (psi): 0.21 |
Velocity (ft/s): 0.52,
Loss (psi): 0.05 |
Velocity (ft/s): 0.37,
Loss (psi): 0.02 |
Velocity (ft/s): 0.22,
Loss (psi): 0.01 |
| 3 | Velocity (ft/s): 1.40,
Loss (psi): 0.45 |
Velocity (ft/s): 0.78,
Loss (psi): 0.11 |
Velocity (ft/s): 0.56,
Loss (psi): 0.05 |
Velocity (ft/s): 0.33,
Loss (psi): 0.01 |
| 4 | Velocity (ft/s): 1.87,
Loss (psi): 0.77 |
Velocity (ft/s): 1.04, Loss (psi): 0.18 | Velocity (ft/s): 0.75,
Loss (psi): 0.08 |
Velocity (ft/s): 0.45,
Loss (psi): 0.02 |
| 5 | Velocity (ft/s): 2.33,
Loss (psi): 1.16 |
Velocity (ft/s): 1.30,
Loss (psi): 0.28 |
Velocity (ft/s): 0.94,
Loss (psi): 0.13 |
Velocity (ft/s): 0.56,
Loss (psi): 0.04 |
| 6 | Velocity (ft/s): 2.80,
Loss (psi): 1.63 |
Velocity (ft/s): 1.56,
Loss (psi): 0.39 |
Velocity (ft/s): 1.12,
Loss (psi): 0.18 |
Velocity (ft/s): 0.67,
Loss (psi): 0.05 |
| 7 | Velocity (ft/s): 3.27,
Loss (psi): 2.17 |
Velocity (ft/s): 1.82,
Loss (psi): 0.52 |
Velocity (ft/s): 1.31,
Loss (psi): 0.24 |
Velocity (ft/s): 0.78,
Loss (psi): 0.07 |
| 8 | Velocity (ft/s): 3.73,
Loss (psi): 2.78 |
Velocity (ft/s): 2.08,
Loss (psi): 0.67 |
Velocity (ft/s): 1.50,
Loss (psi): 0.30 |
Velocity (ft/s): 0.89,
Loss (psi): 0.09 |
| 9 | Velocity (ft/s): 4.20,
Loss (psi): 3.45 |
Velocity (ft/s): 2.34,
Loss (psi): 0.83 |
Velocity (ft/s): 1.69,
Loss (psi): 0.37 |
Velocity (ft/s): 1.00,
Loss (psi): 0.11 |
| 10 | Velocity (ft/s): 4.67,
Loss (psi): 4.20 |
Velocity (ft/s): 2.59,
Loss (psi): 1.01 |
Velocity (ft/s): 1.87,
Loss (psi): 0.46 |
Velocity (ft/s): 1.11,
Loss (psi): 0.13 |
| 11 | Velocity (ft/s): 5.13,
Loss (psi): 5.01 |
Velocity (ft/s): 2.85,
Loss (psi): 1.20 |
Velocity (ft/s): 2.06,
Loss (psi): 0.54 |
Velocity (ft/s): 1.23,
Loss (psi): 0.15 |
| 12 | Velocity (ft/s): 5.60,
Loss (psi): 5.88 |
Velocity (ft/s): 3.11,
Loss (psi): 1.41 |
Velocity (ft/s): 2.25,
Loss (psi): 0.64 |
Velocity (ft/s): 1.34,
Loss (psi): 0.18 |
| 14 | Velocity (ft/s): 6.53,
Loss (psi): 7.83 |
Velocity (ft/s): 3.63,
Loss (psi): 1.88 |
Velocity (ft/s): 2.62,
Loss (psi): 0.85 |
Velocity (ft/s): 1.56,
Loss (psi): 0.24 |
| 16 | Velocity (ft/s): 7.47,
Loss (psi): 10.03 |
Velocity (ft/s): 4.15,
Loss (psi): 2.40 |
Velocity (ft/s): 3.00,
Loss (psi): 1.09 |
Velocity (ft/s): 1.78,
Loss (psi): 0.31 |
| 18 | Velocity (ft/s): 8.40,
Loss (psi): 12.47 |
Velocity (ft/s): 4.67,
Loss (psi): 2.99 |
Velocity (ft/s): 3.37,
Loss (psi): 1.35 |
Velocity (ft/s): 2.01,
Loss (psi): 0.38 |
| 20 | Velocity (ft/s): 9.33,
Loss (psi): 15.16 |
Velocity (ft/s): 5.19,
Loss (psi): 3.63 |
Velocity (ft/s): 3.75,
Loss (psi): 1.64 |
Velocity (ft/s): 2.23,
Loss (psi): 0.47 |
| 22 | Velocity (ft/s): 10.27,
Loss (psi): 18.08 |
Velocity (ft/s): 5.71,
Loss (psi): 4.33 |
Velocity (ft/s): 4.12,
Loss (psi): 1.96 |
Velocity (ft/s): 2.45,
Loss (psi): 0.56 |
| 24 | Velocity (ft/s): 11.20,
Loss (psi): 21.24 |
Velocity (ft/s): 6.23,
Loss (psi): 5.09 |
Velocity (ft/s): 4.49,
Loss (psi): 2.30 |
Velocity (ft/s): 2.68,
Loss (psi): 0.65 |
| 26 | Velocity (ft/s): 12.13,
Loss (psi): 24.64 |
Velocity (ft/s): 6.75,
Loss (psi): 5.91 |
Velocity (ft/s): 4.87,
Loss (psi): 2.67 |
Velocity (ft/s): 2.90,
Loss (psi): 0.76 |
| 28 | Velocity (ft/s): 13.07,
Loss (psi): 28.26 |
Velocity (ft/s): 7.26,
Loss (psi): 6.77 |
Velocity (ft/s): 5.24,
Loss (psi): 3.06 |
Velocity (ft/s): 3.12,
Loss (psi): 0.87 |
| 30 | Velocity (ft/s): 14.00,
Loss (psi): 32.12 |
Velocity (ft/s): 7.78,
Loss (psi): 7.70 |
Velocity (ft/s): 5.62,
Loss (psi): 3.48 |
Velocity (ft/s): 3.34,
Loss (psi): 0.99 |
| 35 | Velocity (ft/s): 16.33,
Loss (psi): 42.73 |
Velocity (ft/s): 9.08,
Loss (psi): 10.24 |
Velocity (ft/s): 6.55,
Loss (psi): 4.63 |
Velocity (ft/s): 3.90,
Loss (psi): 1.31 |
| 40 | Blank | Velocity (ft/s): 10.38,
Loss (psi): 13.11 |
Velocity (ft/s): 7.49,
Loss (psi): 5.93 |
Velocity (ft/s): 4.46,
Loss (psi): 1.68 |
| 45 | Blank | Velocity (ft/s): 11.68,
Loss (psi): 16.31 |
Velocity (ft/s): 8.43,
Loss (psi): 7.38 |
Velocity (ft/s): 5.02,
Loss (psi): 2.09 |
| 50 | Blank | Velocity (ft/s): 12.97,
Loss (psi): 19.83 |
Velocity (ft/s): 9.36,
Loss (psi): 8.97 |
Velocity (ft/s): 5.57,
Loss (psi): 2.54 |
| 55 | Blank | Velocity (ft/s): 14.27,
Loss (psi): 23.65 |
Velocity (ft/s): 10.30,
Loss (psi): 10.70 |
Velocity (ft/s): 6.13,
Loss (psi): 3.03 |
| 60 | Blank | Velocity (ft/s): 15.57,
Loss (psi): 27.79 |
Velocity (ft/s): 11.24,
Loss (psi): 12.57 |
Velocity (ft/s): 6.69,
Loss (psi): 3.56 |
| 65 | Blank | Blank | Velocity (ft/s): 12.17,
Loss (psi): 14.58 |
Velocity (ft/s): 7.25,
Loss (psi): 4.13 |
| 70 | Blank | Blank | Velocity (ft/s): 13.11,
Loss (psi): 16.73 |
Velocity (ft/s): 7.80,
Loss (psi): 4.74 |
| 75 | Blank | Blank | Velocity (ft/s): 14.05,
Loss (psi): 19.01 |
Velocity (ft/s): 8.36,
Loss (psi): 5.38 |
| 80 | Blank | Blank | Velocity (ft/s): 14.98,
Loss (psi): 21.42 |
Velocity (ft/s): 8.92,
Loss (psi): 6.06 |
| 85 | Blank | Blank | Velocity (ft/s): 15.92,
Loss (psi): 23.96 |
Velocity (ft/s): 9.48,
Loss (psi): 6.78 |
| 90 | Blank | Blank | Blank | Velocity (ft/s): 10.03,
Loss (psi): 7.54 |
| 95 | Blank | Blank | Blank | Velocity (ft/s): 10.59,
Loss (psi): 8.34 |
| 100 | Blank | Blank | Blank | Velocity (ft/s): 11.15,
Loss (psi): 9.17 |
Ordinarily the pump piping will be sized to match the manufacture pump connection size. For example, a common residential 4” size submersible pump, with a capacity of 10 to 20 gpm, will have a 1 ¼” NPT pipe connection. Whereas jet pumps commonly use 1” pipe for the drive line and 1 ¼“pipe for the suction line. In some instances, the lines must be upsized if long runs are encountered or if the pump is working close to its design lifting capacity.
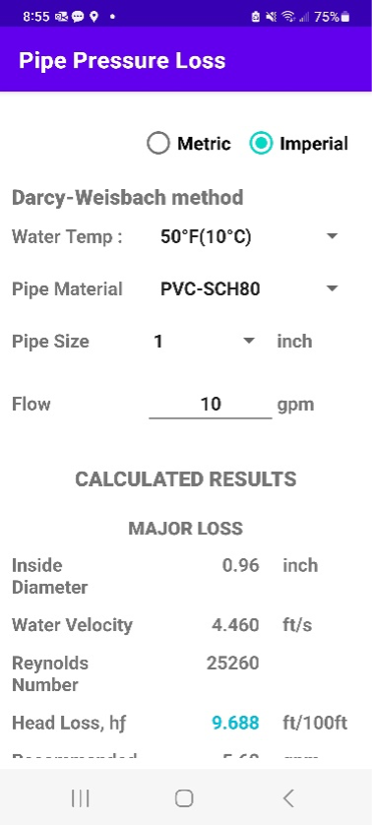
Figure 36 shows the pressure loss for 1” Sch 80 PVC at 10 GPM when using a phone app. Notice the result is 9.688 ft/100ft. This is comparable to the table results when converted to like terms.
9.688 ft./100ft × 0.433 psi/ft = 4.19 psi/100ft
As water travels through the suction and discharge piping, it also encounters friction losses as it travels through various fittings. Friction losses may be caused by check valves, shut-off valves, connection fittings and elbows or other bends.
Figure 37 is an example of a fitting friction loss table. Notice the friction losses for fittings are usually expressed in equivalent lengths of straight pipe. In other words, the diameter of a fitting is matched to the diameter of a pipe section and the friction loss of water that flows through lengths of that size of pipe. For example, a 1¼" gate valve would create the same friction loss as 5' of 1¼" steel pipe. The equivalent fitting length would be added to the actual length of pipe and that length would be used to determine the total friction loss of the pipe and fittings.
| Type of Fitting and Application | Pipe and Fitting | 1/2" | 3/4" | 1" | 1 1/4" | 1 1/2" | 2" | 2 1/2" |
|---|---|---|---|---|---|---|---|---|
| Insert coupling | Plastic | 3 | 3 | 3 | 3 | 3 | 3 | 3 |
| Threaded adapter (plastic to thread) | Plastic | 3 | 3 | 3 | 3 | 3 | 3 | 3 |
| 90 standard elbow | Steel | 2 | 3 | 3 | 4 | 4 | 5 | 6 |
| Plastic | 4 | 5 | 6 | 7 | 8 | 9 | 10 | |
| Standard tee (flow through run) | Steel | 1 | 2 | 3 | 3 | 3 | 4 | 5 |
| Plastic | 4 | 4 | 4 | 5 | 6 | 7 | 8 | |
| Standard tee (flow through side) | Steel | 4 | 5 | 6 | 8 | 9 | 11 | 14 |
| Plastic | 7 | 8 | 9 | 12 | 13 | 17 | 20 | |
| Gate valve | Steel | 2 | 3 | 4 | 5 | 6 | 7 | 8 |
| Plastic | 4 | 4 | 7 | 9 | 10 | 11 | 12 | |
| Swing check valve | Steel | 4 | 5 | 7 | 9 | 11 | 13 | 16 |
| Plastic | 7 | 8 | 11 | 13 | 17 | 19 | 22 | |
| In Line Check Valve (Spring) or Foot Valve | Steel | 4 | 6 | 8 | 12 | 14 | 19 | 23 |
| Plastic | 7 | 10 | 12 | 18 | 20 | 25 | 29 |
Friction loss example:
A 10 gpm submersible pump has 100 ft. of 1” PVC sch80 pipe with one 90º elbow and one above ground swing check valve. What is the friction loss of the pipe and fittings?
Note: The manufactures internal check valve built into the pump body discharge does not have to be accounted for in the friction loss calculation.
Step 1 – Figure equivalent length:
- 1” 90º elbow is equivalent to 6 ft. of straight plastic pipe
- 1” Swing check is equivalent to 11 ft. of straight plastic pipe
- 100 ft. of pipe – equivalent to 100 ft. of straight pipe
- Total equivalent length = 117 ft. = Total equivalent pipe
Step 2 Figure friction loss for the equivalent length of 1” plastic pipe at an assumed flow of 10 GPM:
- PVC Friction loss app shows 9.69 ft. loss per 100 ft. of pipe.
- In step 1 above we have determined total equivalent ft. of pipe to be 117 ft.
- Convert 117 ft. to percentage 117 ÷ 100 = 1.17
- Multiply 9.69 × 1.17 = 11.34 ft
- 11.34 ft. (4.91 psi) is the total friction loss for this system.
Suction Head
For shallow well jet pump installations, the pump may be mounted on the well head, in a pump house close by or in the house itself. With a suction pipe that is inserted into the well or lake that transports water to the inlet of the pump. The vertical distance from the pumping water level to the inlet of the pump is the suction lift. As has been previously discussed the maximum theoretical suction lift of a pump installed at sea level is approximately 34 feet at sea level, but the pump's actual lift capability is lower due to factors such as friction loss in the suction pipe and the pump's efficiency. The maximum practical suction lift for a centrifugal pump installed at sea level is typically around 25 feet.
Suction head = suction lift + friction loss in suction pipe and fittings
Discharge Head
The pressure at the outlet of the pump may be required to transport water both horizontally and vertically, either to a pressure tank or the supply connections within a building. Most pumping systems have a pressure tank that acts as a reservoir and helps to maintain consistent pressure differentials in the system. The determination of resistance on the pump's discharge side relies on whether the pump is supplying water to an open system, a pressure tank, or a VFD pressure sensor.
If the pump system includes a pressure tank or a variable frequency drive (VFD) with a pressure sensor, the total discharge head is determined by measuring the vertical distance from the pump discharge to the elevation of the pressure tank or sensor. This is then added to the maximum pressure setting, converted to feet, and the piping friction loss up to the tank or sensor. Any pressure losses occurring beyond the tank or sensor would be considered in the sizing of the building code distribution piping, with the tank or pressure sensor serving as the supply point.
In the less common scenario of an open system, the discharge head is calculated as the vertical distance to the highest delivery point. Additionally, the discharge piping friction loss and the desired delivery point's residual pressure (converted to meters or feet) are taken into account.
Total Head Calculations
The type of pump and the physical demands of each site will change the nature of the total head calculations. For example, a submersible pump system would have a suction lift of zero, and total head would be equal to discharge head. Figure 38 shows information that is needed to calculate the total head requirement for an installation.
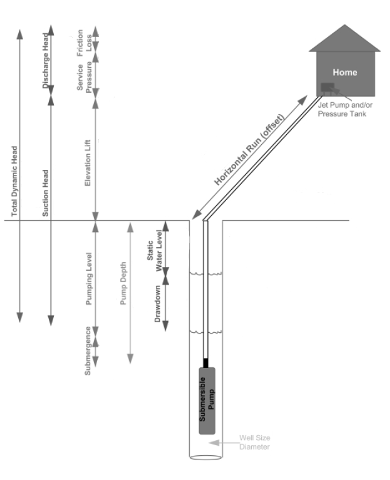
A basic method of calculating the total head requirement is:
- Calculate suction head as sum of:
- depth to static water level (metres or feet)
- drawdown (metres or feet)
- friction losses to pump (metres or feet)
- Calculate discharge head as sum of:
- elevation from discharge of pump to pressure tank, VFD sensor, or highest delivery point
- pressure tank, VFD sensor, or delivery point required static pressure (converted to metres or feet)
- friction losses of piping and fittings (metres or feet)
- Total head = suction head + discharge head
Work through these examples to see the effects that different pump installations have on the total pumping head calculations.
Example 1
You have a shallow jet pump unit complete with a mounted pressure tank, installed at a cottage pump house. The pumping level is 15 ft. and the foot valve depth is 20 ft. The pump house is located 60 ft from the well head at the same elevation. The pump has a capacity of 5 USGPM with 30-50 psi pressure switch at the tank. The suction pipe connection is 1 ¼” and the discharge is ¾” you will use Sch 80 PVC for the suction pipe.
Calculate the total head:
- Calculate suction head (friction losses + vertical lift):
- Suction friction loss
- Equivalent length:
- 3 ea 1 ¼” 90º elbow is equivalent to 21 ft. of straight plastic pipe
- 1 ea 1 ¼” Foot valve is equivalent to 18 ft. of straight plastic pipe
- 20 ft depth + 60 ft horizontal 80 ft. of straight pipe
- Total equivalent length = 119 ft. = Total equivalent pipe
- Figure friction loss for 119 ft. of 1 ¼” PVC pipe at an assumed flow of 5 GPM:
- Sch. 80 PVC pressure loss table shows 0.28 psi loss per 100 ft. of pipe.
- 0.26 psi = 0.6 ft
- [latex]119 \text{ feet} \times \frac{0.6}{100 \text{ ft}} = 0.71 \text{ ft}[/latex]
- Total suction head = 15 ft + 0.71 ft = 15.71 ft
- Calculate discharge head (vertical distance + friction losses + delivery pressure):
- For this installation the pressure tank is mounted directly onto the pump as a package unit therefore there is no vertical lift or friction loss to account for.
- The pressure switch has a range of 20-40 psi, so the maximum (shut-off) pressure of 40 psi will be used. You will need to convert this tank pressure to ft. head
- Total discharge head = 40 psi × 2.31 ft/psi = 92.4 ft
- Calculate the total head (suction head + discharge head):
- 15.71 ft + 92.4 ft = 108.1 ft
Example 2
You have a 1 ½ HP submersible pump with an estimated capacity of 16 USGPM with 40-60 psi pressure switch at the pressure tank. The pumping level is 130 ft. and the pump submergence is 50 ft. The pressure tank is located within the house 100 ft away and 20 ft higher. The pipe connection is 1 ¼” and you will use Sch 80 PVC pipe with 4 elbows on the route to the pressure switch mounted at the tank tee.
Calculate the total head.
- Calculate suction head (friction losses + vertical lift):
- As this is a submersible installation there will not be any suction head calculations.
- Calculate discharge head (friction losses + vertical lift distance + delivery pressure):
- Discharge friction loss
- Equivalent length:
- 4 ea 1 ¼” 90º elbow is equivalent to 28 ft. of straight plastic pipe
- Length of pipe(130 + 50 + 20) = 200 ft.
- Total equivalent length = 228 ft. = Equivalent pipe
- Figure friction loss for 228 ft. of 1 ¼” PVC pipe at an assumed flow of 15 GPM:
- Sch. 80 PVC pressure loss table shows 2.40 psi loss per 100 ft. of pipe.
- 2.40 psi = 5.54 ft
- [latex]228 \text{ feet} \times \frac{5.54}{100 \text{ ft}} = 12.63 \text{ ft}[/latex] of discharge friction loss
- Total discharge lift (pumping level + elevation lift)
- 130 ft + 20 ft = 150 ft
- The pressure switch has a range of 40-60 psi, so the maximum (shut-off) pressure of 60 psi will be used. You will need to convert this tank pressure to head:
- 60 psi × 2.31 ft/psi =138.6 ft. head
- Total discharge head (friction losses + vertical lift distance + delivery pressure):
12.63 + 150 + 138.6 = 301.23 ft
- Calculate the total head (suction head + discharge head):
-
- 0 ft + 301.23 ft = 301.23 ft
Select the Pump Type
When selecting a residential rural water supply pump, several considerations come into play to ensure optimal performance and reliability. The two most common choices are submersible deep well pumps or convertible jet pumps.
Jet pumps can be used with suction lift from 20 to 25 feet and have discharge capacities ranging from 200 to 1500 US gallons per hour at pressures varying from 20 to 50 pounds. If the jet pump is used in a deep well configuration it is usually limited to depths of approximately 100 feet, and its discharge capacity is reduced.
The submersible pump is more hydraulically efficient than a jet pump and can be used for much deeper wells. The pump may require a larger, more powerful motor to drive it as it lifts water from greater depths. Submersible pumps perform well in both shallow well applications as well as at depth to 2000 feet. There are a large range of submersible pump models available, allowing for a precise match to the system capacity requirements.
The pump selection process involves assessing factors such as well depth, water quality, motor type, specific application requirements, pump size, and the need for additional features like built-in controls or protection mechanisms.
Well Depth
The depth of the well is an essential factor to consider when selecting a pump. Submersible deep well pumps are specifically designed for use in deep wells and can handle greater vertical lifts. If the well is deep, a submersible pump is often the preferred choice.
Water Quality
Assessing the water quality is crucial to determine the appropriate pump type. If the water contains debris, sediment, or other particles, a submersible pump with built-in filtration may be necessary to prevent clogging and ensure reliable operation. Water with high mineral content or hardness may require additional treatment or specific pump materials to resist corrosion.
Motor Type
Consider the available power supply and choose the motor type accordingly. Single-phase motors are commonly used for residential applications with standard household power supply, while three-phase motors are typically employed in larger-scale applications or when a three-phase power source is available. Verify the compatibility of the selected pump with the available power source.
Specific Application Requirements
Consider the specific needs of the application. If the water supply is intended for irrigation, livestock watering, or other agricultural purposes, a pump with sufficient flow rate and pressure capabilities should be selected. On the other hand, residential applications such as domestic use, firefighting, or small-scale irrigation may have different requirements in terms of flow rate and pressure.
Pump Size
Determining the appropriate pump size involves considering the anticipated water demand and the pump's performance characteristics. It should be capable of meeting the required flow rate and head (total dynamic head) of the system. The manufacturer's specifications and performance curves are used to determine the suitable pump size for the desired application.
Additional Features
Depending on the specific requirements and desired convenience, consider the need for additional features such as built-in controls, pressure switches, or protection mechanisms like overload protection and thermal sensors. These features can enhance the pump's functionality, efficiency, and longevity while providing ease of use and safety.
To find a suitable pump, you will need to conduct research and consult the manufacturer's documentation, technical specifications, and guidelines specific to the chosen pump type and model. Consider factors such as pump efficiency, motor power requirements, and durability.
Size the Pump
Once you have gathered all the necessary information about your household and well, it is time to determine the appropriate size for your pump. Look for pumps that can handle the required total head and provide the desired flow rate. This ensures that the pump operates optimally and meets your specific needs.
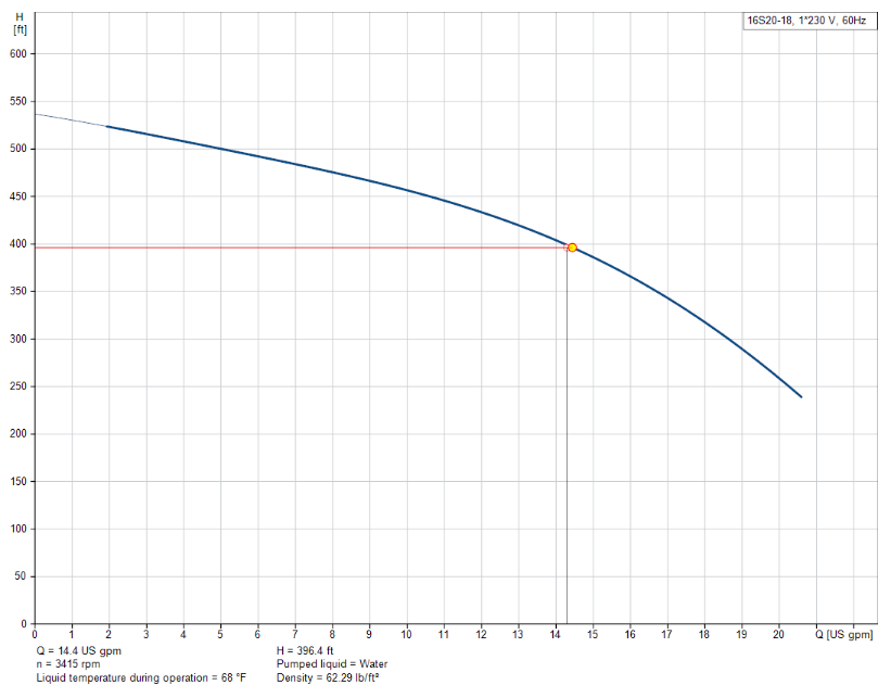
As previously mentioned centrifugal pumps have a variable displacement in that, the amount of water discharged from the pump decreases as it is asked to do more work, such as raising the height of fluid lift or increasing output pressure. These performance characteristics are shown on a pump curve graph. Being able to read a pump curve is essential when selecting a pump. The pump curve will tell you whether it is able to efficiently perform the required flow rate at a certain pressure, and therefore whether it is suitable for your application.
Usually a pump curve will have flow rate on the horizontal axis and the pressure on the vertical axis (Figure 39) . The curve represents the flow rate the pump will produce at certain levels of pressure when the pump is operating properly, or oppositely, the pressure the pump will work at when it is providing a certain flow rate. A centrifugal pump curve has its highest point on the left and gradually slopes down to the right. Looking at the pump curve in Figure 39 the points of intersection show that the pump is capable of producing just over 14 US gpm when working against approximately 400 ft, of head. This point at which the flow rate and pressure intersect is called the operating point or duty point. The curve also indicates that it will produce zero flow at about 540 ft. and a maximum flow of 20.5 US gpm at 240 ft, this is known as the shut off head.
While a pump curve illustrates the range of flow rates and pressures a pump can handle, it is important to note, this does not mean the pump should be operated at all points on a pump curve. As a simple comparison a car has many gears, and although first gear may take you from zero to 40 mph, it would not be good for the engine to be driven at 40 mph in first gear. Neither is it good for the engine if the car is driven at 10mph in third gear even though it is possible for the engine to operate at these speeds.
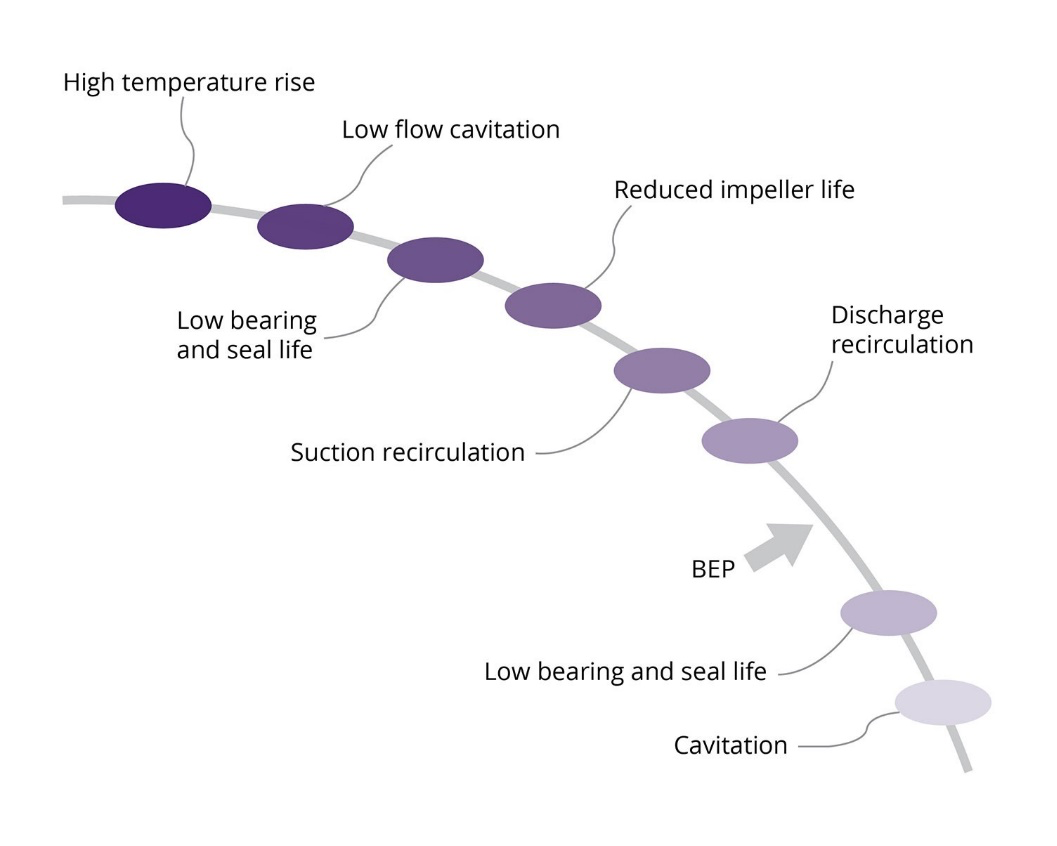
All centrifugal pumps have a point in the curve whereby they operate at their highest efficiency. Figure 40 is an exaggerated drawing of a pump curve indicating the various problems that can occur if the pump is ran too far to the left or right of the best efficiency point (BEP). It is ideal for the pump to operate within two thirds of its curve, and at the duty point there should be at least a 10% rise to the left of the curve (pressure) above the duty point.
When sizing a pump, you will need to navigate multiple manufacturer's supplied performance curves and selection charts. Submersible pumps, are typically organized together on a single data sheet based on their common flow range family. Within this flow range family, you will find various pumps with different numbers of impellers and motor power requirements to meet diverse total head requirements. Some examples of manufactures performance curves and selection charts have been provided in A and Appendix B at the end of this learning task.
Example 1
Is a shallow well jet pump installation with:
- Desired flow rate of 15 USGPM
- A total pump head of 107 ft
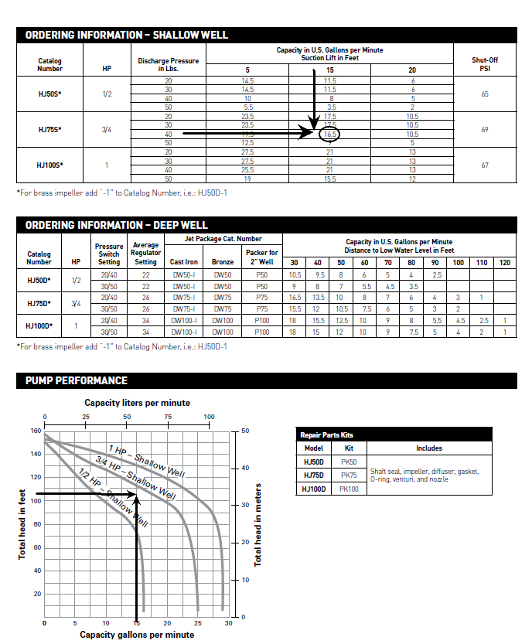
Referring to the copy of the manufacture’s performance data from Appendix A shown in Figure 41. When you know the total head required and the capacity you need, refer to the manufacturer's pump curves. Find your capacity (15 gpm) required on the horizontal axis and draw a line upwards. Find the total head (107 ft.) on the vertical axis and draw a line across until it intersects with the capacity. At this point you select the first pump curve above that point, in this case it is the ¾ HP pump which will supply slightly more than 15 GPM at a total head of 107 ft.
For this same pump notice there is also a pump selection chart that uses the pump suction and discharge head separately to determine the capacity. For example if we split our pumps total pumping head up into; 15 ft of total suction head (including friction loss) and a 40 psi (92 ft.) cut-out pressure switch setting. The selection chart indicates a capacity of 16.5 GPM which is consistent with the value previously determined on the performance curve.
Example 2
Is a Submersible pump installation with:
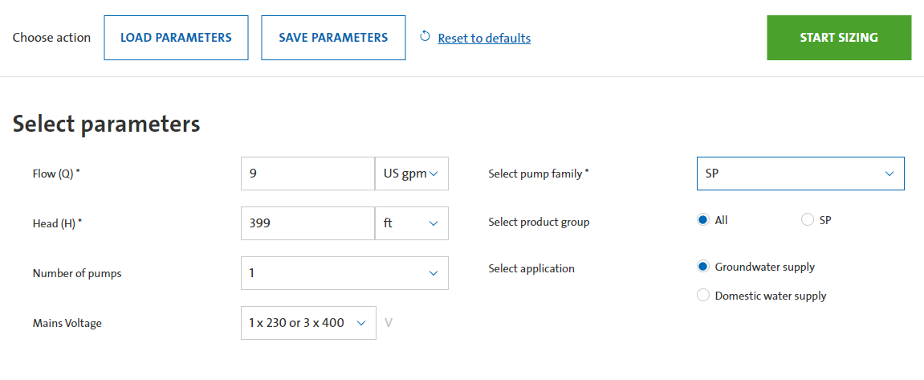
- Desired flow rate of 9 USGPM
- Total discharge head (friction losses + vertical lift distance + delivery pressure):
- Friction loss was calculated to be 30 ft.
- Total vertical lift from pumping water level is 230 ft.
- The pressure switch has a range of 40-60 psi, so the maximum (shut-off) pressure of 60 psi will be used, (60 psi × 2.31 ft/psi =138.6 ft. head).
- Therefore, Total Head = 30 + 230 + 138.6 = 399 ft
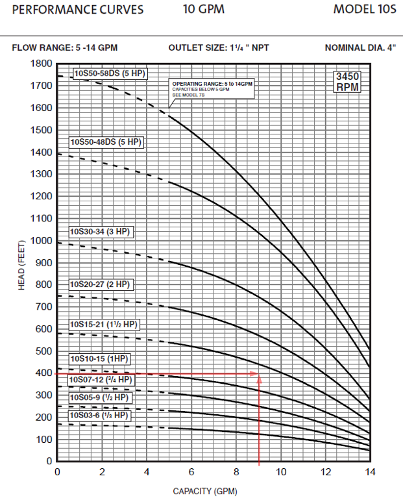
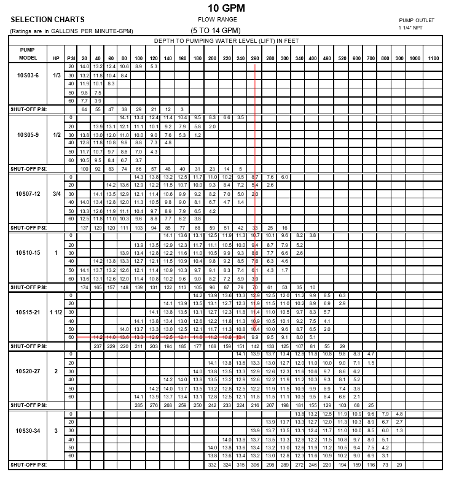
First step is to select a submersible pump model family based on the desired flow rate. Using the manufactures submersible pump data supplied in Appendix B you notice that both the 7 GPM and 10 gpm models have a recommend flow range that will handle our flow requirements of 9 GPM. We will select the 10 GPM family as our 9 GPM requirement is in the middle of its 5-14 GPM flow range which will typically equate to a more efficient pump operation.
Looking at the performance curve for the 10 GPM models shown in Figure 42, find the capacity (9 gpm) required on the horizontal axis and draw a line upwards. Find the total head (399 ft.) on the vertical axis and draw a line across until it intersects with the capacity. The curve above that point, indicates the 1 ½ HP pump which will supply slightly more than 9 GPM at a total head of 399 ft.
For the same pump model family notice there is also a pump selection chart (Figure 43). For our example, deducting the pressure switch setting of 60 psi (139 ft.) leaves a discharge lift of 261 ft. The selection chart for the same 21 stage 1 ½ HP indicates a capacity of 9.9 GPM at 60 psi and 260 ft. of lift which is consistent with the value previously determined on the performance curve. It is worth noting that if the pressure switch was to fail and the pump continued to run this pump would generate a pressure of 142 psi, which is shown in the shut-off psi row below each pump. For this reason, submersible pump manufactures always recommend that a pressure relief valve be installed.
Manufactures Sizing Software
Most manufactures have pump sizing software that is readily available on their web sites. By simply inserting information into the required fields, pump options are given with all of the performance characteristics and specifications.
To demonstrate we will use the Grundfos online sizing software that is available on their web site. The installation criteria from our previous example will be used in order to compare our results. Figure 44 shows the initial selection parameters input screen.
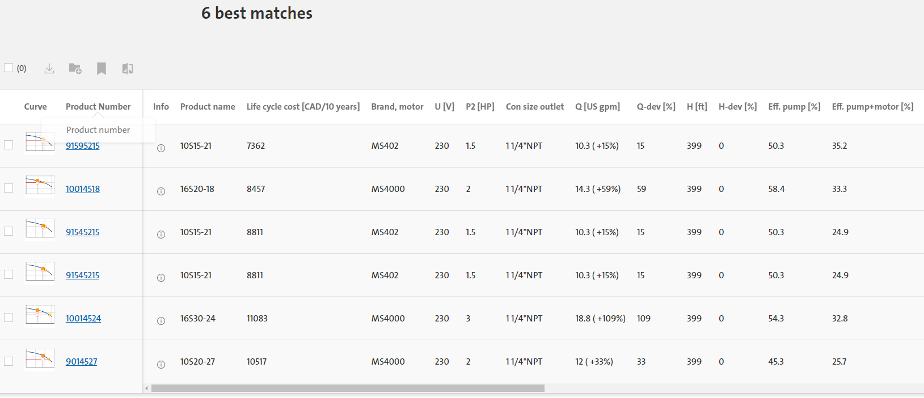
Once these parameters are submitted the software returns the best available matches for this installation (Figure 45). There are many more columns of information to the right for each option that we were not able to be shown on a screen capture. If you look at the product name column notice that our previously chosen pump (10S15-21 is listed three times this is due to its different available options. For example, the option at the top of the list has a pump and motor efficiency of 35.2 %. In this case the higher combined efficiency is due to a different motor option being used.
There are also 3 other different pump options given by the selection software. These would not have been as easily identified if we were simply attempting to comparing all of the available printed pump curves and charts.
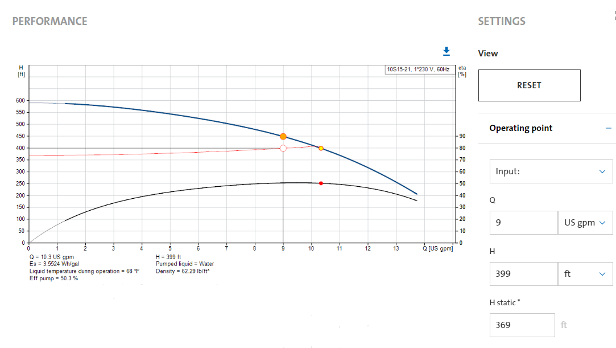
When we click any of the product number links on the left side column all of the data for that pump becomes available, including its performance curve (Figure 46). There are many options that can be turned on or off for example in this image we have the efficiency curve also being shown.
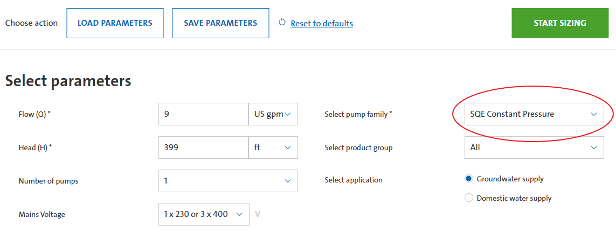
Sizing for a variable speed constant pressure is another one of the selection options that we could have used at the initial selection parameters input screen (Figure 47). With the increase variables to consider when selecting a constant pressure system, the sizing software is an invaluable tool.
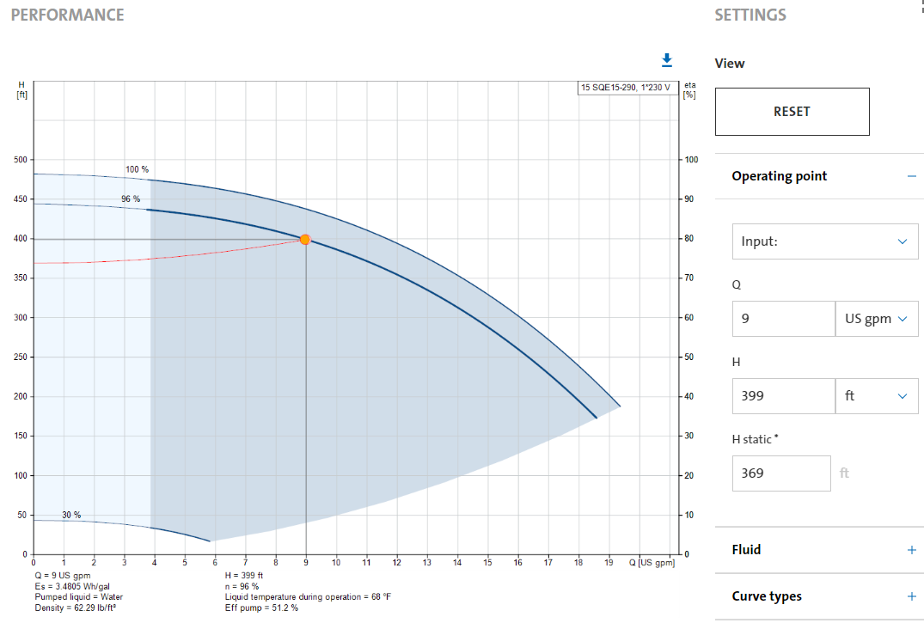
The software returned two different 1 ½ hp pump options, the pump curve for the 15 GPM model is shown in Figure 48. Notice there are now both maximum and minimum pump speed curves shown on the graph. For our flow requirements the pump will be operating at 90% of it maximum speed to deliver our estimated peak demand of 9 GPM. For all lower flow requirements, the electronic controller will reduce the pump speed to match the flow and maintain the programed setpoint pressure.
By utilizing pump sizing software, you can access a wealth of additional information such as life cycle cost, annual energy cost, and a personal index, among others. To gain a comprehensive understanding of the extensive data provided by sizing software, we suggest visiting a manufacturer's website and conducting your own sizing scenarios. This hands-on approach will enable you to explore and evaluate the various data points available, allowing for a deeper comprehension of sizing software's capabilities.
Pressure Tank Sizing
A conventional fixed speed single phase pump motor will consume 6 times normal power at start-up. Frequent motor starts can create excessive heat in the motor and cause damage to its windings or insulation. As previously mentioned the primary purpose of a pressure tank is to provide a reservoir of stored pressurized water to be used when the pump is not running. Without an adequate amount of stored water, the system/pump will rapid cycle on and off shortening the life of the motor and consume excess amounts of electrical power.
The amount of water stored in the pressure tank to be used between pump run cycles is known as draw down or acceptance volume. The general rule is to size the tank to match the GPM of the pump so that once the pump turns on, it will run for a minimum of one minute to fill the tank. Notice in Figure 49 that the drawdown volume is not the same as the actual tank size. The drawdown volume would actually be the difference between the volume of air in the tank at pump cut-in pressure (P1) and cut-out Pressure (P2).
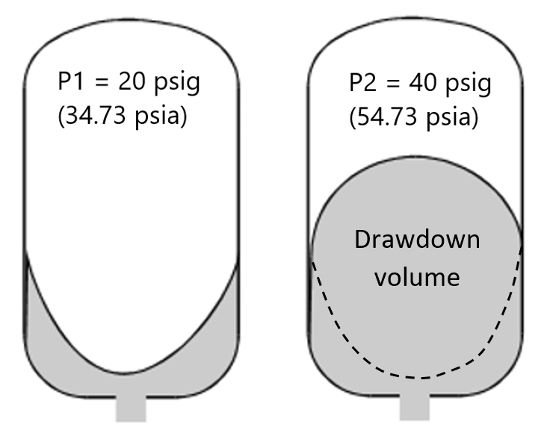
For example, if the precharged diaphragm tank in Figure 49 had 15 gallons of air volume at 20 psig (34.73 psia) cut-in we can use Boyles to demonstrate the actual amount of drawdown volume available at 40 psig (54.73 psia):
[latex](P1 \, V1) = (P2 \, V2)[/latex]
[latex](34.73 \text{ psia} \times 15 \text{ gallons}) = (54.73 \text{ psia} \times V2)[/latex]
[latex]V_2 = \frac{34.73 \times 15}{54.73} = 9.52 \text{ gallons of air at pump cut out}[/latex]
[latex]\therefore \text{Drawdown is } 15 \, \text{ gallons} - 9,52 \text{ gallons} = 5.48 \text{ gallons}[/latex]
Even though most pressure switches are set up with a 20 psi differential range (20/40, 30/50, 40/60) the actual pressure settings affect that amount of drawdown volume available for a given pressure tank. For example, if our previous tank drawdown calculations were done for a 30/50 pressure switch the results would change:
[latex](44.73 \text{ psia} \times 15 \text{ gallons}) = (64.73 \text{ psia} \times V2)[/latex]
[latex]V2 = \frac{44.73 \times 15}{64.73} = 10.36 \text{ gallons of air at pump cut out}[/latex]
[latex]\therefore \text{Drawdown for the 30/50 pressure switch is } 15 \text{ gallons} - 10.36 \text{ gallons} = 4.64 \text{ gallons}[/latex]
The previous calculations were only given for the purpose of demonstrating the affect of different pressure settings on the drawdown volume of a tank. In practice you will not need to calculate the tank size as this information is readily available from manufactures tables or sizing software.
It is also worth noting that diaphragm in the pressure tank shown in Figure 49 was not bottomed out in the tank at the cut-in pressure point. This is due to the fact that the tank air precharge is set at 2-4 psi lower that the systems operating cut-in pressure. This will ensure there is not a slight pause in the water supply just before the pump is activated.
Figure 50 is an example of a pressure tank selection table designed to give a one-minute pump run time. Notice there are two size columns for each pressure switch setting. Column A is for a modern diaphragm tank. Whereas, column B is for old style standard pneumatic tanks that can not be precharge therefore require a larger tanks size to achieve the equivalent drawdown volume as a diaphragm tank.
| Pump Capacity (GPH) | Pump Capacity (GPM) | Minimum Drawdown Gallons | Pressure Switch Setting: 20 to 40 PSI | Pressure Switch Setting: 30 to 50 PSI | Pressure Switch Setting: 40 to 60 PSI |
|---|---|---|---|---|---|
| 240 | 4 | 4 | A: 10, B: 25 | A: 15, B: 40 | A: 15, B: 55 |
| 300 | 5 | 5 | A: 15, B: 30 | A: 15, B: 50 | A: 20, B: 70 |
| 360 | 6 | 6 | A: 15, B: 40 | A: 20, B: 60 | A: 20, B: 85 |
| 420 | 7 | 7 | A: 20, B: 45 | A: 25, B: 70 | A: 25, B: 100 |
| 480 | 8 | 8 | A: 20, B: 50 | A: 25, B: 80 | A: 30, B: 110 |
| 540 | 9 | 9 | A: 25, B: 60 | A: 30, B: 90 | A: 35, B: 125 |
| 600 | 10 | 10 | A: 30, B: 65 | A: 30, B: 100 | A: 40, B: 140 |
| 660 | 12 | 12 | A: 35, B: 80 | A: 40, B: 120 | A: 45, B: 165 |
| 720 | 13 | 13 | A: 35, B: 85 | A: 40, B: 130 | A: 50, B: 180 |
| 780 | 15 | 15 | A: 40, B: 100 | A: 50, B: 150 | A: 55, B: 210 |
| 840 | 17 | 17 | A: 45, B: 110 | A: 55, B: 170 | A: 65, B: 235 |
| 900 | 19 | 19 | A: 50, B: 125 | A: 60, B: 190 | A: 70, B: 265 |
| 960 | 20 | 20 | A: 55, B: 130 | A: 65, B: 200 | A: 75, B: 280 |
| 1020 | 23 | 23 | A: 65, B: 150 | A: 75, B: 230 | A: 85, B: 320 |
| 1080 | 25 | 25 | A: 70, B: 160 | A: 80, B: 250 | A: 95, B: 350 |
| 1140 | 27 | 27 | A: 75, B: 175 | A: 85, B: 270 | A: 100, B: 375 |
| 1200 | 30 | 30 | A: 80, B: 195 | A: 95, B: 300 | A: 110, B: 415 |
| 1260 | 33 | 33 | A: 90, B: 215 | A: 105, B: 330 | A: 125, B: 460 |
| 1320 | 36 | 36 | A: 100, B: 235 | A: 115, B: 360 | A: 135, B: 500 |
| 1380 | 38 | 38 | A: 105, B: 245 | A: 125, B: 380 | A: 140, B: 530 |
| 1440 | 41 | 41 | A: 110, B: 265 | A: 135, B: 410 | A: 155, B: 570 |
| 1500 | 44 | 44 | A: 120, B: 285 | A: 140, B: 440 | A: 165, B: 610 |
| 1560 | 47 | 47 | A: 130, B: 305 | A: 150, B: 470 | A: 175, B: 655 |
| 1620 | 50 | 50 | A: 135, B: 325 | A: 160, B: 500 | A: 185, B: 700 |
| 1680 | 53 | 53 | A: 145, B: 345 | A: 170, B: 530 | A: 200, B: 735 |
| 1740 | 57 | 57 | A: 155, B: 370 | A: 185, B: 570 | A: 215, B: 790 |
| 1800 | 60 | 60 | A: 165, B: 390 | A: 190, B: 600 | A: 225, B: 835 |
The tank can not be selected until the pump capacity has been determined. You will recall our previous submersible pump sizing exercise where we required a pump to deliver at least a 9 GPM duty point with a 40/60 pressure switch. Referring to our previous software performance curve shown in Figure 46 we see that the pump will actually deliver slightly over 10 gpm when installed into our system. This is worth noting, as any correctly selected pump will usually always end up performing at a greater duty point than the minimum required capacity. It is quite uncommon to have a pumps minimum required capacity land exactly onto the pump curve line. Therefore, the pressure tank for our example should have at least 10 gpm of drawdown not 9 GPM.
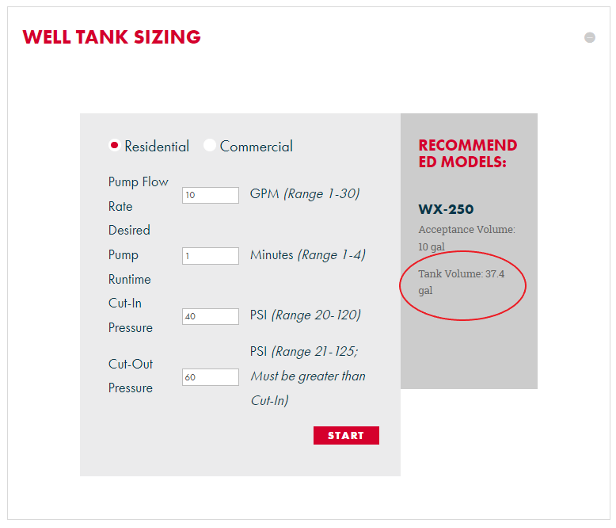
Manufacture online pressure tank sizing software is also a readily available option. Figure 51 shows a screen capture of the tank sizing results for our 10-gpm pump operating with a 40/60 pressure switch. You will notice the 37.4-gallon result is comparable to the 40 gallons result you would get using the selection table. Also, the software gives you the option to increase the desired pump runtime.
Tanks for Constant Pressure Systems
The motors that are used for constant pressure systems, are specifically designed to handle frequent starts and stops. The purpose of a pressure tank serving a constant pressure system is not to supply reserve capacity but rather to act as a buffer for pump starts and stops. Therefore, the required tank size is very small, as its only purpose is maintaining system stability and preventing pressure fluctuations. The tank must be installed as close as possible after the pump and the precharge pressure is typically 70% of the controller pressure setpoint. For residential applications an 8 liter (2 gallon) tank is appropriate. The table in Figure 52 shows one manufactures recommend tank sizes for constant pressure systems.
| Rated Flow of Pump
GPM (m3/h) |
Minimum Diaphragm Tank Size
Gallons (Liters) |
|---|---|
| 0-26 (0-6) | 2 (8) |
| 27-105 (7-24) | 4.4 (18) |
| 106-176 (25-40) | 14 (50) |
| 177-308 (41-70) | 34 (120) |
| 309-440 (71-100) | 62 (180) |
 Now complete Self-Test 2 and check your answers.
Self-Test 2
Self-Test 2
Appendices
- Appendix A: Myers Jet pump Specifications [PDF]
- Appendix B: Grundfos Submersible Pump Performance Data [PDF]
Media Attributions
- Figure 31. "Well water levels" by BCcampus is licensed under a CC BY 4.0 licence.
- Figure 34. "Low yield two-pump system" - The source for this image is unknown. It is being used for non-commercial, educational purposes. To receive credit for this image, please reach out to the publisher.
- Figure 36. "Pressure loss app" is a screenshot from the Pipe Pressure Loss app from TeH Studio, used for educational purposes under the basis of fair dealing.
- Figure 38. "Total head data" - The source for this image is unknown. It is being used for non-commercial, educational purposes. To receive credit for this image, please reach out to the publisher.
- Figure 39. "Grundfos 2HP 18 stage submersible pump curve" from the Grundfos' online sizing software. It is being used under the basis of fair dealing.
- Figure 40. "Pump performance problems" from Castle Pumps is used for educational purposes under the basis of fair dealing.
- Figure 41. "Convertible jet pump performance data (Courtesy of Pentair Myers)" from Pentair Myers is used for educational purposes under the basis of fair dealing.
- Figure 42. "Submersible pump performance curve (Courtesy of Grundfos)" from Grundfos is used for educational purposes under the basis of fair dealing.
- Figure 43. "Submersible pump selection chart (Courtesy of Grundfos)" from Grundfos is used for educational purposes under the basis of fair dealing.
- Figure 44. "Sizing software parameter selection screen shot" from the Grundfos' online sizing software. It is being used under the basis of fair dealing.
- Figure 45. "Pump matches screen shot" from the Grundfos' online sizing software. It is being used under the basis of fair dealing.
- Figure 46. "Software performance curve" from the Grundfos' online sizing software. It is being used under the basis of fair dealing.
- Figure 47. "Constant Pressure parameter section screen shot" from the Grundfos' online sizing software. It is being used under the basis of fair dealing.
- Figure 48. "Constant pressure pump performance curve"from the Grundfos' online sizing software. It is being used under the basis of fair dealing.
- Figure 49. "Drawdown volume" by Rod Lidstone is licensed under a CC BY-NC-SA licence.
- Figure 51. "Tank sizing software screen shot" from Amtrol's online well tank sizing software. It is being used under the basis of fair dealing.
Image descriptions
Figure 41. "Convertible jet pump performance data (Courtesy of Pentair Myers)" image description: A table of ordering information for shallow wells. The table has been split into three separate tables for this description.
| Discharge pressure in pounds | Capacity of 5 U.S. Gallons per Minute | Capacity of 15 U.S. Gallons per Minute | Capacity of 20 U.S. Gallons per Minute |
|---|---|---|---|
| 20 | 14.5 | 11.5 | 6 |
| 30 | 14.5 | 11.5 | 6 |
| 40 | 10 | 8 | 5 |
| 50 | 5.5 | 3.5 | 2 |
| Discharge pressure in pounds | Capacity of 5 U.S. Gallons per Minute | Capacity of 15 U.S. Gallons per Minute | Capacity of 20 U.S. Gallons per Minute |
|---|---|---|---|
| 20 | 23.5 | 17.5 | 10.5 |
| 30 | 23.5 | 17.5 | 10.5 |
| 40 | 19.5 | 16.5 | 10.5 |
| 50 | 12.5 | 9 | 5 |
| Discharge pressure in pounds | Capacity of 5 U.S. Gallons per Minute | Capacity of 15 U.S. Gallons per Minute | Capacity of 20 U.S. Gallons per Minute |
|---|---|---|---|
| 20 | 27.5 | 21 | 13 |
| 30 | 27.5 | 21 | 13 |
| 40 | 27.5 | 21 | 13 |
| 50 | 19 | 15.5 | 12 |

