<?xml version="1.0" encoding="UTF-8"?>
<!DOCTYPE html PUBLIC "-//W3C//DTD XHTML 1.1//EN" "http://www.w3.org/TR/xhtml11/DTD/xhtml11.dtd">
<html xmlns="http://www.w3.org/1999/xhtml" xml:lang="en">
<head>
<meta content="text/html; charset=UTF-8" http-equiv="content-type" />
<meta http-equiv="Content-Language" content="en" />
<meta name="generator" content="Pressbooks 6.27.1" />
<meta name="pb-authors" content="Geography Open Textbook Collective" />
<meta name="pb-contributors" content="Arthur Green" />
<meta name="pb-contributors" content="Aviv Ettya" />
<meta name="pb-contributors" content="Siobhan McPhee" />
<meta name="pb-contributors" content="Britta Ricker" />
<meta name="pb-contributors" content="Cristina Temenos" />
<meta name="pb-cover-image" content="https://opentextbc.ca/geography/wp-content/uploads/sites/34/2022/12/OTB063-01-British-Columbia-in-a-Global-Context-COVER-STORE.jpg" />
<meta name="pb-title" content="British Columbia in a Global Context" />
<meta name="pb-publisher-city" content="Victoria, B.C." />
<meta name="pb-publication-date" content="1402531200" />
<meta name="pb-language" content="en" />
<meta name="pb-copyright-year" content="2014" />
<meta name="pb-copyright-holder" content="Geography Open Textbook Collective" />
<meta name="pb-book-license" content="cc-by" />
<meta name="pb-custom-copyright" content="© 2014 Geography Open Textbook CollectiveThe CC licence permits you to retain, reuse, copy, redistribute, and revise this book—in whole or in part—for free providing the author is attributed as follows:Britsh Columbia in a Global Context by Geography Open Textbook Collective is used under a CC BY 4.0 licence.If you redistribute all or part of this book, you must include the following on the copyright notice page:Download for free from the B.C. Open Collection.Sample APA-style citation:This textbook can be referenced. In APA citation style, it would appear as follows:Geography Open Textbook Collective. (2014). British Columbia in a global context. BCcampus. http://opentextbc.ca/geography/.Cover image attributions:Pitt River Bridge View by James Wheeler is used under CC BY-NC-SA 2.0 L=licence, Natives making a canoe from a tree trunk at Mission, British Columbia, circa 1900 by BiblioArchives is used under a CC BY 2.0 licence, Heisholt Lake by David Stanley is used under a CC BY 2.0 licence, and Skybridge, British Columbia by Troy Wason is used under a CC BY 2.0 licence.Visit BCcampus Open Education to learn about open education in British Columbia.Ebook ISBN: 978-1-77420-018-6Print ISBN: 978-1-77420-019-3" />
<meta name="pb-about-50" content="This first-year geography textbook takes a holistic approach to geography by incorporating elements of physical, human, and regional geography, as well as bringing in methods and perspectives from spatial information science. This textbook applies a fundamental geographical approach to understanding our globally changing world by looking at local processes, which are linked to larger global processes and events. The textbook includes numerous case studies specific to British Columbia as well as a number of suggested service learning activities." />
<meta name="pb-about-unlimited" content="Over the course of four days in June, 2014, five faculty members from across British Columbia supported by a facilitator, librarian, researcher, illustrator, programmer, and instructional designer created this book. This involved drawing on our own research, teaching, and experience and working with the team to put it all together into an online format; one which would be accessible to students and educators alike.Beyond the unique way in which this book was created in a book-sprint process, there are other elements of this book that make it unique. First, it takes a holistic approach to first-year geography, incorporating elements of physical, human, and regional geography, as well as bringing in methods and perspectives from spatial information science.Pedagogically, this book incorporates elements of service learning and suggested service learning activities, recognizing that the study of geography is deeply connected to the communities we live in. Many of the suggestions for service learning are illustrated through the use of case studies from across BC.The book is aimed at a first-year or introductory geography student and would be suitable for a first-year geography course on BC." />
<meta name="pb-primary-subject" content="RG" />
<meta name="pb-publisher" content="BCcampus" />
<meta name="pb-about-140" content="A first-year textbook on British Columbia's geography." />
<meta name="pb-ebook-isbn" content="978-1-77420-018-6" />
<meta name="pb-print-isbn" content="978-1-77420-019-3" />
<title>British Columbia in a Global Context</title>
</head>
<body lang='en' >
<div id="half-title-page"><h1 class="title">British Columbia in a Global Context</h1></div>
<div id="title-page">
			<h1 class="title">British Columbia in a Global Context</h1>
		<h2 class="subtitle"></h2>
					<p class="author">Geography Open Textbook Collective</p>
													<p class="author">Contributors: Arthur Green; Aviv Ettya; Siobhan McPhee; Britta Ricker; and Cristina Temenos</p>
						<p class="publisher">BCcampus</p>
		<p class="publisher-city">Victoria, B.C.</p>
	</div>
<div id="copyright-page">
	<div class="ugc">
					
<div class="license-attribution"><p><img src="https://opentextbc.ca/geography/wp-content/themes/pressbooks-book/packages/buckram/assets/images/cc-by.svg" alt="Icon for the Creative Commons Attribution 4.0 International License" role="presentation" /></p><p>British Columbia in a Global Context Copyright © 2014 by <span>Geography Open Textbook Collective</span> is licensed under a <a rel="license" href="https://creativecommons.org/licenses/by/4.0/">Creative Commons Attribution 4.0 International License</a>, except where otherwise noted.</p></div>

							<p>© 2014 Geography Open Textbook Collective</p><p>The CC licence permits you to retain, reuse, copy, redistribute, and revise this book—in whole or in part—for free providing the author is attributed as follows:</p><div class="textbox"><a href="https://opentextbc.ca/geography/"><em>Britsh Columbia in a Global Context</em></a> by Geography Open Textbook Collective is used under a <a href="http://creativecommons.org/licenses/by/4.0/">CC BY 4.0 licence</a>.</div><p>If you redistribute all or part of this book, you must include the following on the copyright notice page:</p><div class="textbox">Download for free from the <a href="https://collection.bccampus.ca/" target="_blank" rel="noopener">B.C. Open Collection</a>.</div><p><strong>Sample APA-style citation:</strong></p><p>This textbook can be referenced. In APA citation style, it would appear as follows:</p><div class="textbox">Geography Open Textbook Collective. (2014). <i>British Columbia in a global context</i>. BCcampus. http://opentextbc.ca/geography/.</div><p><strong>Cover image attributions:</strong></p><div class="textbox"><a href="https://flic.kr/p/fQhZR6" target="_blank" rel="noopener">Pitt River Bridge View</a> by James Wheeler is used under <a href="https://creativecommons.org/licenses/by-nc-sa/2.0/" target="_blank" rel="noopener">CC BY-NC-SA 2.0 L=licence</a>, <a href="https://flic.kr/p/crz2Nw" target="_blank" rel="noopener">Natives making a canoe from a tree trunk at Mission, British Columbia</a>, circa 1900 by BiblioArchives is used under a <a href="https://creativecommons.org/licenses/by/2.0/" target="_blank" rel="noopener">CC BY 2.0 licence</a>, <a href="https://flic.kr/p/fcdvia" target="_blank" rel="noopener">Heisholt Lake</a> by David Stanley is used under a <a href="https://creativecommons.org/licenses/by/2.0/" target="_blank" rel="noopener">CC BY 2.0 licence</a>, and <a href="https://flic.kr/p/3iQPkB" target="_blank" rel="noopener">Skybridge, British Columbia</a> by Troy Wason is used under a <a href="https://creativecommons.org/licenses/by/2.0/" target="_blank" rel="noopener">CC BY 2.0 licence</a>.</div><p>Visit <a href="http://open.bccampus.ca/">BCcampus Open Education</a> to learn about open education in British Columbia.</p><p><strong>Ebook ISBN:</strong> 978-1-77420-018-6</p><p><strong>Print ISBN</strong>: 978-1-77420-019-3</p>
							</div>
</div>
<div id="toc">
	<h1>Contents</h1>
	<ul>
					<li class="front-matter foreword">
	<a href="#front-matter-about-the-book">
		<span class="toc-chapter-title">About the Book</span>
							</a>
	</li>

					<li class="front-matter miscellaneous">
	<a href="#front-matter-introduction">
		<span class="toc-chapter-title">Introduction</span>
							</a>
	</li>

					<li class="part">
	<a href="#part-chapter-2">
					1. Urban Settlement in British Columbia
			</a>
</li>

					<li class="chapter standard">
	<a href="#chapter-slug-2-2-introduction">
		<span class="toc-chapter-title">Introduction</span>
							</a>
	</li>

					<li class="chapter standard">
	<a href="#chapter-slug-2-3-urbanization-in-british-columbia">
		<span class="toc-chapter-title">Urbanization in British Columbia</span>
							</a>
	</li>

					<li class="chapter standard">
	<a href="#chapter-slug-2-4-case-studies">
		<span class="toc-chapter-title">Case Study 1: The Georgia and Dunsmuir Viaducts</span>
							</a>
			<ul class="sections">
							<li class="section">
	<a href="#chapter-67-section-1">
		<span class="toc-subsection-title">Vancouver: The Greenest City?</span>
	</a>
</li>
					</ul>
	</li>

					<li class="chapter standard">
	<a href="#chapter-case-study-2">
		<span class="toc-chapter-title">Case Study 2: Dockside Green, Victoria</span>
							</a>
	</li>

					<li class="chapter standard">
	<a href="#chapter-slug-2-5-summary">
		<span class="toc-chapter-title">Summary</span>
							</a>
	</li>

					<li class="chapter standard">
	<a href="#chapter-slug-2-8-key-terms">
		<span class="toc-chapter-title">Key Terms</span>
							</a>
	</li>

					<li class="chapter standard">
	<a href="#chapter-slug-2-6-activities">
		<span class="toc-chapter-title">Suggested Activities</span>
							</a>
	</li>

					<li class="chapter standard">
	<a href="#chapter-slug-2-7-references-and-resources">
		<span class="toc-chapter-title">References and Resources</span>
							</a>
	</li>

					<li class="part">
	<a href="#part-chapter-3">
					2. Socio-Economics in British Columbia
			</a>
</li>

					<li class="chapter standard">
	<a href="#chapter-slug-3-2-introduction">
		<span class="toc-chapter-title">Introduction</span>
							</a>
	</li>

					<li class="chapter standard">
	<a href="#chapter-quality-of-life-measures">
		<span class="toc-chapter-title">Quality-of-Life Measures</span>
							</a>
	</li>

					<li class="chapter standard">
	<a href="#chapter-homelessness-and-poverty-in-the-first-world">
		<span class="toc-chapter-title">Homelessness and Poverty in the First World</span>
							</a>
	</li>

					<li class="chapter standard">
	<a href="#chapter-slug-3-3-case-studies">
		<span class="toc-chapter-title">Case Study 1: Victoria and Williams Lake</span>
							</a>
	</li>

					<li class="chapter standard">
	<a href="#chapter-case-study-2-2">
		<span class="toc-chapter-title">Case Study 2: Housing Affordability</span>
							</a>
	</li>

					<li class="chapter standard">
	<a href="#chapter-slug-3-4-summary">
		<span class="toc-chapter-title">Summary</span>
							</a>
	</li>

					<li class="chapter standard">
	<a href="#chapter-slug-3-6-key-terms">
		<span class="toc-chapter-title">Key Terms</span>
							</a>
	</li>

					<li class="chapter standard">
	<a href="#chapter-slug-3-5-activities">
		<span class="toc-chapter-title">Suggested Activities</span>
							</a>
	</li>

					<li class="chapter standard">
	<a href="#chapter-slug-3-5-references-and-resources">
		<span class="toc-chapter-title">References and Resources</span>
							</a>
	</li>

					<li class="part">
	<a href="#part-chapter-4">
					3. Aboriginal Issues in British Columbia
			</a>
</li>

					<li class="chapter standard">
	<a href="#chapter-slug-4-2-introduction">
		<span class="toc-chapter-title">Introduction</span>
							</a>
	</li>

					<li class="chapter standard">
	<a href="#chapter-slug-4-3-territories-natural-resources-and-treaties">
		<span class="toc-chapter-title">Territories, Natural Resources and First Treaties</span>
							</a>
	</li>

					<li class="chapter standard">
	<a href="#chapter-modern-treaties">
		<span class="toc-chapter-title">Modern Treaties and Claims</span>
							</a>
	</li>

					<li class="chapter standard">
	<a href="#chapter-slug-4-4-case-study">
		<span class="toc-chapter-title">Case Study 1: The Indian Residential School System</span>
							</a>
	</li>

					<li class="chapter standard">
	<a href="#chapter-slug-4-5-summary">
		<span class="toc-chapter-title">Summary</span>
							</a>
	</li>

					<li class="chapter standard">
	<a href="#chapter-slug-4-8-key-terms">
		<span class="toc-chapter-title">Key Terms</span>
							</a>
	</li>

					<li class="chapter standard">
	<a href="#chapter-slug-4-6-activities">
		<span class="toc-chapter-title">Suggested Activities</span>
							</a>
	</li>

					<li class="chapter standard">
	<a href="#chapter-slug-4-7-references-and-resources">
		<span class="toc-chapter-title">References and Resources</span>
							</a>
	</li>

					<li class="part">
	<a href="#part-chapter-5">
					4. Resources in British Columbia
			</a>
</li>

					<li class="chapter standard">
	<a href="#chapter-slug-5-2-introduction">
		<span class="toc-chapter-title">Introduction</span>
							</a>
	</li>

					<li class="chapter standard">
	<a href="#chapter-what-are-resources">
		<span class="toc-chapter-title">What are Resources?</span>
							</a>
	</li>

					<li class="chapter standard">
	<a href="#chapter-slug-5-3-british-columbias-natural-resources">
		<span class="toc-chapter-title">Mining in BC</span>
							</a>
	</li>

					<li class="chapter standard">
	<a href="#chapter-slug-5-4-case-studies">
		<span class="toc-chapter-title">Case Study 1: The Gold Rush</span>
							</a>
	</li>

					<li class="chapter standard">
	<a href="#chapter-case-study-2-3">
		<span class="toc-chapter-title">Case Study 2: Carrier Nation and the Endako Mine</span>
							</a>
	</li>

					<li class="chapter standard">
	<a href="#chapter-slug-5-5-summary">
		<span class="toc-chapter-title">Summary</span>
							</a>
	</li>

					<li class="chapter standard">
	<a href="#chapter-slug-5-8-key-terms">
		<span class="toc-chapter-title">Key Terms</span>
							</a>
	</li>

					<li class="chapter standard">
	<a href="#chapter-slug-5-6-activities">
		<span class="toc-chapter-title">Suggested Activities</span>
							</a>
	</li>

					<li class="chapter standard">
	<a href="#chapter-slug-5-7-references-and-resources">
		<span class="toc-chapter-title">References and Resources</span>
							</a>
	</li>

					<li class="part">
	<a href="#part-chapter-6">
					5. Food Systems in British Columbia
			</a>
</li>

					<li class="chapter standard">
	<a href="#chapter-slug-6-2-introduction">
		<span class="toc-chapter-title">Introduction</span>
							</a>
	</li>

					<li class="chapter standard">
	<a href="#chapter-slug-6-3-food-systems-in-the-physical-landscape">
		<span class="toc-chapter-title">Food Systems in the Physical Landscape</span>
							</a>
	</li>

					<li class="chapter standard">
	<a href="#chapter-slug-6-4-food-systems-in-british-columbia">
		<span class="toc-chapter-title">Food Systems in British Columbia</span>
							</a>
	</li>

					<li class="chapter standard">
	<a href="#chapter-slug-6-5-confronting-the-frontiers">
		<span class="toc-chapter-title">Confronting the Frontiers</span>
							</a>
	</li>

					<li class="chapter standard">
	<a href="#chapter-slug-6-6-case-studies">
		<span class="toc-chapter-title">Case Study 1: The Agricultural Land Reserve (ALR)</span>
							</a>
	</li>

					<li class="chapter standard">
	<a href="#chapter-case-study-2-4">
		<span class="toc-chapter-title">Case Study 2: Managing the BC Salmon Fishery</span>
							</a>
	</li>

					<li class="chapter standard">
	<a href="#chapter-slug-6-7-summary">
		<span class="toc-chapter-title">Summary</span>
							</a>
	</li>

					<li class="chapter standard">
	<a href="#chapter-slug-6-10-key-terms">
		<span class="toc-chapter-title">Key Terms</span>
							</a>
	</li>

					<li class="chapter standard">
	<a href="#chapter-slug-6-8-activities">
		<span class="toc-chapter-title">Suggested Activities</span>
							</a>
	</li>

					<li class="chapter standard">
	<a href="#chapter-slug-6-9-references-and-resources">
		<span class="toc-chapter-title">References and Resources</span>
							</a>
	</li>

					<li class="part">
	<a href="#part-chapter-7">
					6. Forestry in British Columbia
			</a>
</li>

					<li class="chapter standard">
	<a href="#chapter-slug-7-2-introduction">
		<span class="toc-chapter-title">Introduction</span>
							</a>
	</li>

					<li class="chapter standard">
	<a href="#chapter-slug-7-3-history-of-commercial-logging">
		<span class="toc-chapter-title">History of Commercial Logging</span>
							</a>
	</li>

					<li class="chapter standard">
	<a href="#chapter-slug-7-4-pulp-and-paper-mills">
		<span class="toc-chapter-title">Pulp and Paper Mills</span>
							</a>
	</li>

					<li class="chapter standard">
	<a href="#chapter-slug-7-5-forest-tree-tenures">
		<span class="toc-chapter-title">Forest Tree Tenures</span>
							</a>
	</li>

					<li class="chapter standard">
	<a href="#chapter-slug-7-6-case-study">
		<span class="toc-chapter-title">Case Study 1: Mountain Pine Beetle</span>
							</a>
	</li>

					<li class="chapter standard">
	<a href="#chapter-slug-7-7-summary">
		<span class="toc-chapter-title">Summary</span>
							</a>
	</li>

					<li class="chapter standard">
	<a href="#chapter-slug-7-10-key-terms">
		<span class="toc-chapter-title">Key Terms</span>
							</a>
	</li>

					<li class="chapter standard">
	<a href="#chapter-slug-7-8-activities">
		<span class="toc-chapter-title">Suggested Activities</span>
							</a>
	</li>

					<li class="chapter standard">
	<a href="#chapter-slug-7-9-references-and-resources">
		<span class="toc-chapter-title">References and Resources</span>
							</a>
	</li>

					<li class="part">
	<a href="#part-chapter-8">
					7. Health Geography in British Columbia
			</a>
</li>

					<li class="chapter standard">
	<a href="#chapter-slug-8-2-introduction">
		<span class="toc-chapter-title">Introduction</span>
							</a>
	</li>

					<li class="chapter standard">
	<a href="#chapter-types-of-health-geographies">
		<span class="toc-chapter-title">Types of Health Geographies</span>
							</a>
	</li>

					<li class="chapter standard">
	<a href="#chapter-slug-8-3-case-studies">
		<span class="toc-chapter-title">Case Study 1: The &quot;Golden Hour&quot; and Access to Health Care</span>
							</a>
	</li>

					<li class="chapter standard">
	<a href="#chapter-case-study-2-5">
		<span class="toc-chapter-title">Case Study 2: Urban Heat Islands, Health and Spatial Technologies</span>
							</a>
	</li>

					<li class="chapter standard">
	<a href="#chapter-slug-8-4-summary">
		<span class="toc-chapter-title">Summary</span>
							</a>
			<ul class="sections">
							<li class="section">
	<a href="#chapter-172-section-1">
		<span class="toc-subsection-title">Summary</span>
	</a>
</li>
					</ul>
	</li>

					<li class="chapter standard">
	<a href="#chapter-slug-8-7-key-terms">
		<span class="toc-chapter-title">Key Terms</span>
							</a>
	</li>

					<li class="chapter standard">
	<a href="#chapter-slug-8-5-activities">
		<span class="toc-chapter-title">Suggested Activities</span>
							</a>
	</li>

					<li class="chapter standard">
	<a href="#chapter-slug-8-6-references-and-resources">
		<span class="toc-chapter-title">References and Resources</span>
							</a>
	</li>

					<li class="part">
	<a href="#part-chapter-9">
					8. Physical Geography of British Columbia
			</a>
</li>

					<li class="chapter standard">
	<a href="#chapter-slug-9-2-introduction">
		<span class="toc-chapter-title">Introduction</span>
							</a>
	</li>

					<li class="chapter standard">
	<a href="#chapter-slug-9-3-climate-and-environment-bc">
		<span class="toc-chapter-title">Climate Change and Environment in BC</span>
							</a>
	</li>

					<li class="chapter standard">
	<a href="#chapter-slug-9-4-geology">
		<span class="toc-chapter-title">Geology</span>
							</a>
	</li>

					<li class="chapter standard">
	<a href="#chapter-slug-9-5-hazards">
		<span class="toc-chapter-title">Hazards</span>
							</a>
	</li>

					<li class="chapter standard">
	<a href="#chapter-slug-9-6-case-studies">
		<span class="toc-chapter-title">Case Study 1: 1965 Hope Slide</span>
							</a>
	</li>

					<li class="chapter standard">
	<a href="#chapter-case-study-2-6">
		<span class="toc-chapter-title">Case Study 2: 1964 Port Alberni Tsunami</span>
							</a>
	</li>

					<li class="chapter standard">
	<a href="#chapter-case-study-3">
		<span class="toc-chapter-title">Case Study 3: 2003 Okanagan Mountain Park Fire</span>
							</a>
	</li>

					<li class="chapter standard">
	<a href="#chapter-slug-9-7-summary">
		<span class="toc-chapter-title">Summary</span>
							</a>
	</li>

					<li class="chapter standard">
	<a href="#chapter-slug-9-10-key-terms">
		<span class="toc-chapter-title">Key Terms</span>
							</a>
	</li>

					<li class="chapter standard">
	<a href="#chapter-slug-9-8-activities">
		<span class="toc-chapter-title">Suggested Activities</span>
							</a>
	</li>

					<li class="chapter standard">
	<a href="#chapter-slug-9-9-references-and-resources">
		<span class="toc-chapter-title">References and Resources</span>
							</a>
	</li>

					<li class="back-matter appendix">
	<a href="#back-matter-tools-for-spatial-data-collection-and-utilization">
		<span class="toc-chapter-title">Tools for Spatial Data Collection and Utilization</span>
							</a>
			<ul class="sections">
							<li class="section">
	<a href="#back-matter-200-section-1">
		<span class="toc-subsection-title">Geographic Information</span>
	</a>
</li>
					</ul>
	</li>

					<li class="back-matter appendix">
	<a href="#back-matter-qualitative-research-methods-in-human-geography">
		<span class="toc-chapter-title">Qualitative Research Methods in Human Geography</span>
							</a>
	</li>

					<li class="back-matter appendix">
	<a href="#back-matter-physical-geography-research-methods">
		<span class="toc-chapter-title">Physical Geography Research Methods</span>
							</a>
	</li>

					<li class="back-matter appendix">
	<a href="#back-matter-statistical-geography">
		<span class="toc-chapter-title">Statistical Geography</span>
							</a>
			<ul class="sections">
							<li class="section">
	<a href="#back-matter-209-section-1">
		<span class="toc-subsection-title">Statistical Geography</span>
	</a>
</li>
					</ul>
	</li>

					<li class="back-matter appendix">
	<a href="#back-matter-how-to-find-research-literature">
		<span class="toc-chapter-title">How to Find Research Literature</span>
							</a>
	</li>

					<li class="back-matter about-the-author">
	<a href="#back-matter-about-the-authors">
		<span class="toc-chapter-title">About the Authors</span>
							</a>
	</li>

					<li class="back-matter credits">
	<a href="#back-matter-additional-credits">
		<span class="toc-chapter-title">Additional Credits</span>
							</a>
	</li>

					<li class="back-matter miscellaneous">
	<a href="#back-matter-versioning-history">
		<span class="toc-chapter-title">Versioning History</span>
							</a>
	</li>

			</ul>
</div>
<div class="front-matter foreword " id="front-matter-about-the-book" title="About the Book">
	<div class="front-matter-title-wrap">
		<p class="front-matter-number">1</p>
		<h1 class="front-matter-title">About the Book</h1>
								</div>
	<div class="ugc front-matter-ugc">
				 <div class="wp-caption aligncenter" id="attachment_401" aria-describedby="caption-attachment-401" style="width: 800px"><a href="http://opentextbc.ca/geography/wp-content/uploads/sites/34/2014/06/booksprint_group.jpg" data-url="http://opentextbc.ca/geography/wp-content/uploads/sites/34/2014/06/booksprint_group.jpg"><img class="wp-image-401 size-full" src="https://opentextbc.ca/geography/wp-content/uploads/sites/34/2014/06/booksprint_group.jpg" alt="A group of people sitting around a large table talking to each other. The table is filled with books, laptops, sticky notes, and drinks." width="800" height="400" srcset="https://opentextbc.ca/geography/wp-content/uploads/sites/34/2014/06/booksprint_group.jpg 800w, https://opentextbc.ca/geography/wp-content/uploads/sites/34/2014/06/booksprint_group-300x150.jpg 300w, https://opentextbc.ca/geography/wp-content/uploads/sites/34/2014/06/booksprint_group-65x32.jpg 65w, https://opentextbc.ca/geography/wp-content/uploads/sites/34/2014/06/booksprint_group-225x112.jpg 225w, https://opentextbc.ca/geography/wp-content/uploads/sites/34/2014/06/booksprint_group-350x175.jpg 350w" sizes="auto, (max-width: 800px) 100vw, 800px" title="" /></a><div class="wp-caption-text" id="caption-attachment-401">The Geography Open Textbook Collective</div></div> <p>Over the course of four&nbsp;days in June 2014, five Geography faculty members from across British Columbia, supported by a facilitator, librarian, researcher, illustrator, programmer and instructional designer, created this book. This involved drawing on our own research, teaching and experience and working with the team to put it all together into an online format, one that would be accessible to students and educators alike.</p> <p>Beyond the unique way in which this book was created through this&nbsp;Book Sprint process, there are other elements of this book that make it unique. First, it takes a holistic approach to first-year Geography, incorporating elements of physical, human and regional geography, as well as bringing in methods and perspectives from spatial information science.</p> <p>Pedagogically, this book is aimed at a a first-year or introductory Geography student, and&nbsp;would be suitable for a first-year Geography course on BC.&nbsp;It incorporates elements of service learning and suggested service learning activities recognizing that the study of Geography is deeply connected to the communities we live in. Many of the suggestions for service learning are illustrated through the use of case studies from across BC.</p> <p>Finally, this book is openly licensed with a Creative Commons license, meaning that it can be freely used, copied, distributed, adapted and modified, either in whole or in part without further permission. We have made this book available in numerous file types that you can take, modify and reuse. Your reuse of this material can be anything from simple copying and using a single illustration or image to a complete rewriting of the book to fit your own learning objectives.</p> <h2>About BCcampus Open Education</h2> <p><em>British Columbia in a Global Context </em>by the Geography Open Textbook Collective was funded by BCcampus Open Education.</p> <p><a href="https://open.bccampus.ca/" data-url="https://open.bccampus.ca/">BCcampus Open Education</a> began in 2012 as the B.C. Open Textbook Project with the goal of making post-secondary education in British Columbia more accessible by reducing students’ costs through the use of open textbooks and other OER. <a href="https://bccampus.ca/about-us/" rel="noopener" data-url="https://bccampus.ca/about-us/">BCcampus</a> supports the post-secondary institutions of British Columbia as they adapt and evolve their teaching and learning practices to enable powerful learning opportunities for the students of B.C. BCcampus Open Education is funded by the <a href="https://www2.gov.bc.ca/gov/content/governments/organizational-structure/ministries-organizations/ministries/advanced-education-skills-training" rel="noopener" data-url="https://www2.gov.bc.ca/gov/content/governments/organizational-structure/ministries-organizations/ministries/advanced-education-skills-training">British Columbia Ministry of Advanced Education and Skills Training</a> and the <a href="http://www.hewlett.org/" rel="noopener" data-url="http://www.hewlett.org/">Hewlett Foundation</a>.</p> <p>Open educational resources (OER) are teaching, learning, and research resources that, through permissions granted by the copyright holder, allow others to use, distribute, keep, or make changes to them. Our open textbooks are openly licensed using a <a href="https://creativecommons.org/licenses/" data-url="https://creativecommons.org/licenses/">Creative Commons licence</a> and are offered in various eBook formats free of charge, or as printed books that are available at cost.</p> <p>For more information about open education in British Columbia, please visit the <a href="https://open.bccampus.ca/" data-url="https://open.bccampus.ca/">BCcampus Open Education</a> website. If you are an instructor who is using this book for a course, please fill out our <a href="https://open.bccampus.ca/use-open-textbooks/tell-us-youre-using-an-open-textbook/" data-url="https://open.bccampus.ca/use-open-textbooks/tell-us-youre-using-an-open-textbook/">Adoption of an Open Textbook</a> form.</p> <h3>Media Attributions</h3> <ul><li>Geography Open Textbook Collective photo: <a href="https://www.flickr.com/photos/61642799@N03/14383713894/" target="_blank" rel="noopener" data-url="https://www.flickr.com/photos/61642799@N03/14383713894/">Day 1</a> from <a href="https://www.flickr.com/photos/61642799@N03/" target="_blank" rel="noopener" data-url="https://www.flickr.com/photos/61642799@N03/">BCcampus_news</a> is lcensed under a <a href="https://creativecommons.org/licenses/by-sa/2.0/" target="_blank" rel="noopener" data-url="https://creativecommons.org/licenses/by-sa/2.0/">CC BY-SA 2.0 licence</a>.</li> </ul> 
	</div>


	</div>
<div class="front-matter miscellaneous " id="front-matter-introduction" title="Introduction">
	<div class="front-matter-title-wrap">
		<p class="front-matter-number">2</p>
		<h1 class="front-matter-title">Introduction</h1>
								</div>
	<div class="ugc front-matter-ugc">
				 <p>In sitting down to think about what a regional geography of British Columbia (BC) might look like, the ideas in the room were as diverse as the people there. However, we all agreed on one thing: a traditional textbook format was not something that would fit the scope of the project that we had been set. Regional geography is often considered to be an inwardly focusing geographical perspective with analysis pertaining to local networks and drawing on isolated contextual examples. So what did regional geographies of BC mean to us as a diverse group of geographers?</p> <div class="wp-caption aligncenter" id="attachment_405" aria-describedby="caption-attachment-405" style="width: 400px"><a href="http://opentextbc.ca/geography/wp-content/uploads/sites/34/2014/06/regions_800.jpg" data-url="http://opentextbc.ca/geography/wp-content/uploads/sites/34/2014/06/regions_800.jpg"><img class="wp-image-405" alt="Map of the regions of British Columbia" src="http://opentextbc.ca/geography/wp-content/uploads/sites/34/2014/06/regions_800.jpg" height="408" width="400" srcset="https://opentextbc.ca/geography/wp-content/uploads/sites/34/2014/06/regions_800.jpg 800w, https://opentextbc.ca/geography/wp-content/uploads/sites/34/2014/06/regions_800-294x300.jpg 294w, https://opentextbc.ca/geography/wp-content/uploads/sites/34/2014/06/regions_800-65x66.jpg 65w, https://opentextbc.ca/geography/wp-content/uploads/sites/34/2014/06/regions_800-225x229.jpg 225w, https://opentextbc.ca/geography/wp-content/uploads/sites/34/2014/06/regions_800-350x356.jpg 350w" sizes="auto, (max-width: 400px) 100vw, 400px" title="" /></a><div class="wp-caption-text" id="caption-attachment-405">Figure 1. Regions of British Columbia</div></div> <p>The discussion generated two themes: the first, illustrated by the Regions of British Columbia map (see Figure 1), comes from an understanding that BC is an incredibly diverse place. There are vastly different physical features of landscape, from temperate rainforests to deserts to beautiful boreal forests in the north.</p> <p>The second theme is the importance of natural resources. BC’s rich natural resources such as forestry, fishing, metals, minerals and natural gas not only provide for a vibrant local economy, but make the province a key part of Canada’s economy in relation to the global marketplace. If you put “British Columbia Canada” <a href="https://www.google.ca/search?q=British+Columbia+Canada&amp;ie=utf-8&amp;oe=utf-8&amp;aq=t&amp;rls=org.mozilla:en-US:official&amp;client=firefox-a&amp;channel=sb&amp;gfe_rd=cr&amp;ei=srigU9PWFsqV8QfB9IEo" target="_blank" data-url="https://www.google.ca/search?q=British+Columbia+Canada&amp;ie=utf-8&amp;oe=utf-8&amp;aq=t&amp;rls=org.mozilla:en-US:official&amp;client=firefox-a&amp;channel=sb&amp;gfe_rd=cr&amp;ei=srigU9PWFsqV8QfB9IEo">into a Google search</a>, you’ll be offered a snapshot of some of the issues relevant here in BC, but whose effects are felt across the globe.</p> <p>The main scope of the book is, therefore, to apply the fundamental geographical approach of understanding our globally changing world by looking at the local processes. These local processes and events are intrinsically linked to the same processes and events elsewhere. For example:</p> <ul><li>Mining and its effects are a global issue and we can see how these unfold in BC.</li> <li>The recent apologies to First Nations peoples on the residential school issue are similar to events that have occurred in the US, Ireland and Australia.</li> <li>Processes of urbanization, a phenomenon that people all over the globe are experiencing, can be seen in Vancouver with our discussion of the city’s development and its rating as the second-most expensive city in the world to purchase a home.</li> </ul> <p>Geography students, indeed all first-year students, need to know and be able to critically assess their own contexts and environments in order to properly engage with our continually globalizing world.</p> <h2>The People of BC</h2> <p>The story of British Columbia is also one of continuous settlement, from the ancestors of the Aboriginal peoples of BC who crossed the Bering Strait 10,000 to 12,000 years ago to the first settlements along the Pacific coast 5,000 years ago, with inward and southern migration throughout the province. European contact and settlement came relatively late in the “age of exploration” and is a familiar story of people in search of resources.</p> <p>BC is home to an incredibly diverse population including 203 distinct First Nations and Métis groups. Other Canadians can trace their roots to Europe, Asia, Africa and Middle Eastern descent, and an increasing number of recent immigrants are arriving from places such as India, China and Iran. In 2013, BC welcomed 36,161 international immigrants (Government of British Columbia, 2013). All the stories of settlement connect the land of what is now British Columbia to places elsewhere.</p> <h2>The Book</h2> <p><strong>Chapter 1 Urban Settlement in British Columbia</strong> charts urban settlement patterns in BC up to current urbanization trends. The&nbsp;intention is to give students an understanding of how BC has been created through, what <a target="_blank" href="http://www.open.ac.uk/socialsciences/main/staff/people-profile.php?name=Doreen_Massey" data-url="http://www.open.ac.uk/socialsciences/main/staff/people-profile.php?name=Doreen_Massey">Doreen Massey </a>(British social scientist and geographer) calls, a global sense of place. How is it that a place is different from other places? Especially one so connected to the global economy?&nbsp;It is through understanding differences, both within BC and without, that the values and diversity of the province begin to shine through.&nbsp;The case studies contained in this chapter offer insights into contemporary socio-ecological&nbsp;processes concerned with sustainability. &nbsp;In one case study, we look at a history of social planning in Vancouver to see what historic decisions have impacted the city and how&nbsp;economic, social and environmental interests are a series of ongoing complex, and often competing interrelationships.</p> <p><strong>Chapter 2 Socio-Economics in British Columbia</strong> sharpens the focus of social and economic relationships in BC by giving readers a clear understanding of how the global economic success and resulting high quality-of-life indicators are not evenly distributed.&nbsp;While Chapter 1 sets up the settlement story of BC, Chapter 2 grounds the reader with a key perspective that runs throughout the book, bringing in the political economies of place into broader socio-economic processes. Throughout this chapter, readers begin to look at the relationality of a place under complex, socially produced forces. The case study of homelessness in the northern community of Williams Lake and the provincial capital of Victoria show that even a social problem within provincial&nbsp;boundaries does not appear uniform across regions.</p> <p><strong>Chapter 3 Aboriginal Issues in British Columbia</strong> focuses on the ongoing legacies of colonialism that have shaped the landscape, politics and lives of millions of people in BC since European settlement of the province. After a brief look at the diversity of Aboriginal people in BC, the chapter examines&nbsp;the modern treaty process in the province, which has been a key issue affecting land tenure and property rights, relations between Aboriginal people&nbsp;and non-Aboriginals, and the ability to realize a stable and healthful livelihood. The case study in this chapter highlights another historical event with an ongoing legacy: the Indian residential school system that was in place across Canada from the 1880s until 1996. The case study provides a look at the&nbsp;history, implementation and effects both inside of BC and among Aboriginal people across the country.&nbsp;It ends by asking readers to consider how such a systematic abuse of a group of people can be reconciled in relation to ongoing land claims and current inequalities that the system engendered.</p> <p><strong>Chapter 4 Resources in British Columbia</strong> focuses on natural resources in the province, which are a&nbsp;source of wealth and sustenance. The extraction of natural resources from land and waters has allowed BC to hold&nbsp;a key place in today’s global economy. At the same time, intensive extraction processes have threatened the natural environment. Mining non-renewable resources such as gold&nbsp;also threatens ecologies that support food systems, fisheries and forests. The case studies in this chapter&nbsp;pick up on the historical and contemporary realities of mining in BC, and ask readers to think about how these extraction processes are related to their&nbsp;relationship to the landscape.</p> <p><strong>Chapters 5, 6 and 7</strong> all focus on important resources in BC.</p> <p><strong>Chapter 5 Food Systems in British Columbia</strong> looks at&nbsp;food systems, a key form of sustenance, and brings a holistic understanding of the physical and social production of food in contemporary society. Rather than focusing solely on agriculture as an industry, this chapter considers food systems&nbsp;in relation to broader resource management strategies such as fisheries management, food security and&nbsp;urban agricultural land use patterns.</p> <p><strong>Chapter 6 Forestry in British Columbia</strong>&nbsp;takes an in-depth look at forestry management and the lumber&nbsp;industry as it has worked over time. It closes by looking at a major bio-social issue facing&nbsp;BC’s forests, the mountain pine beetle infestation. In the&nbsp;case study, readers are reminded that there are overlapping factors that contribute to the management of our natural resources, and that even renewable resources can be put into precarious positions despite local stewardship initiatives.</p> <p><strong>Chapter 7 Health Geography in British Columbia</strong> moves away from natural resources and turns its attention to the maintenance&nbsp;of another key resource in BC: its people. It&nbsp;provides a broad overview of&nbsp;the health landscape in BC, focusing on the role of GIS in mapping vast territories of health surveillance. The first case study in this chapter considers&nbsp;acute trauma care in BC by mapping the distance to trauma centres. The second looks at the role of urban “heat islands” that exist in the summer months because of the changes in climate; these heat islands increase&nbsp;health risks&nbsp;in some populations, such as the elderly.</p> <p>Finally, <strong>Chapter 8 Physical Geography of British Columbia</strong> looks at the physical makeup of the province. In a more traditional volume, this chapter would be placed first, directly after the introduction.&nbsp;But the authors&nbsp;chose to place it at the end in order to emphasize that the social processes explored throughout the book are always deeply rooted in place.</p> <p>Also included in this book is an appendix that&nbsp;we hope students and teachers alike will use as a resource for understanding and employing research methods across all areas of geography. As mentioned above, this text is meant to be a dynamic resource, for you, the reader, to add to as you explore deeper into the multiple geographies that BC has to offer.</p> <h2>Attributions</h2> <ul><li><strong>Figure 1</strong>. Regions of British Columbia by Hilda Anggraeni</li> </ul> <h2>References</h2> <p>Government of British Columbia, 2013. Welcome BC – Immigration Data, Facts and Trends [WWW Document]. Welcome BC. URL http://www.welcomebc.ca/Live/about-bc/facts-landing/immigration-data-facts-trends.aspx (accessed 6.17.14).</p> <p>McGillivray, B., 2011. Geography of British Columbia: people and landscapes in transition, 3rd ed. ed. UBC Press, Vancouver.</p> 
	</div>


	</div>
<div class="part-wrapper" id="part-chapter-2-wrapper">
    <div class="part  introduction" id="part-chapter-2">
	<div class="part-title-wrap">
		<p class="part-number">I</p>
		<h1 class="part-title">1. Urban Settlement in British Columbia</h1>
	</div>
	<div class="ugc part-ugc">
		<div class="post_content clearfix"><div class="bcc-box bcc-highlight"><h3>Learning Objectives</h3> <ul><li>Discuss and describe the trajectory of urban development in British Columbia.</li> <li>Analyze how cities fit into the concept of a relational sense of place.</li> <li>Develop a comprehensive/systems thinking understanding of cities, their people and the environment.</li> </ul> </div> <p>&nbsp;</p> </div>
	</div>
			
				
	</div>
<div class="chapter standard with-subsections" id="chapter-slug-2-2-introduction" title="Introduction">
	<div class="chapter-title-wrap">
		<p class="chapter-number">1</p>
		<h1 class="chapter-title">Introduction</h1>
								</div>
	<div class="ugc chapter-ugc">
				 <p>This chapter focuses on understanding the role and processes of urbanization in the context of BC. In particular, it emphasizes recent understandings of urban sustainability and urban systems thinking. The primary goal, on finishing this chapter, is to have an understanding of the relationality and territoriality of cities; that is, understanding how cities exist in what&nbsp;geographer Doreen Massey calls a “<strong>g</strong><strong class="Bold">lobal&nbsp;sense of place</strong>.” This will connect with the second&nbsp;goal of the chapter, which is to understand how cities are related to other places, and how cities are at the same time unique places. The concept of a global sense of place has three characteristics:</p> <ol><li>Places have multiple identities and meanings. The meaning is dependent on the people who are experiencing a place.</li> <li>Places are more than physical locations; they are made up of processes.</li> <li>Places are not static, they are ongoing and ever changing because of relationships to other places.</li> </ol> <p>A global sense of place means viewing&nbsp;every city as globalized or worldly precisely because of its relationship to other places, and the mobile processes that are ongoing in places. Likewise, a global sense of place means that&nbsp;the territoriality, or what makes a place unique, can be&nbsp;understood because other places are different.</p> <h2>Cities</h2> <p>A&nbsp;<strong class="Bold">city</strong>, in its most basic sense, is a constellation of people and social, political and economic institutions and&nbsp;infrastructures&nbsp;within a physical location. While there is usually&nbsp;no agreed-upon population or socio-economic configuration for most cities, they&nbsp;are nevertheless understood to be discrete locations that&nbsp;are governed by political institutions (e.g., a municipal government with&nbsp;a mayor and city council), and city governments&nbsp;have the power to make laws and collect taxes from the people and businesses that inhabit it. Cities of course, do not exist in isolation from other places. They are connected to places near and far, to other cities and to rural communities and landscapes.</p> <p>Cities are created through&nbsp;processes of&nbsp;<strong class="Bold">urbanization</strong>, which combine various socio-economic, political, technological, and environmental processes that affect the way that cities are made up and how people live in them.</p> <p>In British Columbia in 2011,&nbsp;there were 49 municipalities designated as cities,&nbsp;with&nbsp;an average population of&nbsp;59,716 (Census data). The current (2014) total population of BC is&nbsp;4,606,375, and&nbsp;2,926,102 of those people live in cities. With more and more people moving to to cities within the province, we can ascertain that BC is undergoing a process of urbanization.</p> <div class="wp-caption aligncenter" id="attachment_1354" aria-describedby="caption-attachment-1354" style="width: 597px"><a href="https://opentextbc.ca/geography/wp-content/uploads/sites/34/2014/06/British-Columbia-population-urban-and-rural-1851-2011.png" data-url="https://opentextbc.ca/geography/wp-content/uploads/sites/34/2014/06/British-Columbia-population-urban-and-rural-1851-2011.png"><img src="https://opentextbc.ca/geography/wp-content/uploads/sites/34/2014/06/British-Columbia-population-urban-and-rural-1851-2011.png" alt="After the 1930s, BC&amp;#039;s urban population began to grow at a much larger rate than BC&amp;#039;s rural population" width="597" height="369" class="wp-image-1354 size-full" srcset="https://opentextbc.ca/geography/wp-content/uploads/sites/34/2014/06/British-Columbia-population-urban-and-rural-1851-2011.png 597w, https://opentextbc.ca/geography/wp-content/uploads/sites/34/2014/06/British-Columbia-population-urban-and-rural-1851-2011-300x185.png 300w, https://opentextbc.ca/geography/wp-content/uploads/sites/34/2014/06/British-Columbia-population-urban-and-rural-1851-2011-65x40.png 65w, https://opentextbc.ca/geography/wp-content/uploads/sites/34/2014/06/British-Columbia-population-urban-and-rural-1851-2011-225x139.png 225w, https://opentextbc.ca/geography/wp-content/uploads/sites/34/2014/06/British-Columbia-population-urban-and-rural-1851-2011-350x216.png 350w" sizes="auto, (max-width: 597px) 100vw, 597px" title="" /></a><div class="wp-caption-text" id="caption-attachment-1354">Figure 1.1 Graph of BC’s population from 1851-2011.</div></div> <h2>Processes that make up cities</h2> <p>Some of the processes that make up cities and contribute to this global sense of place are <strong>economic change</strong>, <strong>demographic change</strong>, <strong>political change</strong>, <strong>sociocultural change</strong>,&nbsp;<strong>technological&nbsp;change</strong> and <strong>environmental change</strong>. As well, local histories and physical landscapes contribute to the uniqueness and differences in cities.</p> <p><strong>Economic changes</strong> are often dynamic and exist on many scales. An economic change may be, for example,&nbsp;the shift from a subsistence-based economy to one of pre-capitalist trade or, in contemporary society, a shift in the form of capitalist accumulation. Cities, as sites of resource agglomeration, are key actors within the network of global economic activity. Cities gather, regulate, produce and redistribute capital in the form of physical resources, money and human labour. As well, cities have their own regional and local economies that are connected to broader economic flows.</p> <p>Within cities, as well as among cities, capital is unevenly distributed between people, which causes shifting demographic, political and sociocultural&nbsp;changes.</p> <p><strong>Demographic changes</strong>, such as the size, composition and speed of change profoundly affect urban landscapes. For example, in 2011, the city of Surrey was the fastest growing city in Canada. With its large and growing East Asian population, it is also emerging as a multicultural hub within the province, and at the same time it is a place characterized by a growing local economy and a mild climate, placing it as an affordable alternative to Vancouver or Victoria.</p> <p><strong>Political change</strong> at various scales (international, federal, provincial and municipal) also has important effects on cities. Governments have the power to levy taxes and to redistribute resources. They make laws that regulate everything from environmental and economic activity&nbsp;to managing migration. Shifts in political agendas can mean the difference between securing funding for a local health authority versus&nbsp;public transit in the region.</p> <p><strong>Sociocultural changes</strong> affect everything from architectural style to the kinds of amenities that are provided in cities. For example, BC is known for its natural beauty, so cities often highlight local access to outdoor activities such as hiking, skiing or cycling. Sociocultural change is broader than physical attributes, however. Behaviour toward minority groups&nbsp;has also altered drastically within cities over the years. For example, from 1859 to 1923, Canada levied the Chinese head tax, a fee charged to each Chinese person entering Canada. It was abolished in 1923 by the Chinese Immigration Act, which prohibited immigration from China to Canada. Many years later,&nbsp;in 2006, the federal government offered an official apology and financial remuneration to survivors and their spouses who paid the head tax.</p> <div class="wp-caption aligncenter" id="attachment_60" aria-describedby="caption-attachment-60" style="width: 400px"><a href="http://opentextbc.ca/geography/wp-content/uploads/sites/34/2014/06/Stpauls-middlechurch-man.jpg" data-url="http://opentextbc.ca/geography/wp-content/uploads/sites/34/2014/06/Stpauls-middlechurch-man.jpg"><img class="wp-image-60" alt="Figure 2. Residential School children. St. Paul&amp;#039;s Indian Industrial School, Middlechurch, Manitoba, 1901" src="http://opentextbc.ca/geography/wp-content/uploads/sites/34/2014/06/Stpauls-middlechurch-man.jpg" height="312" width="400" srcset="https://opentextbc.ca/geography/wp-content/uploads/sites/34/2014/06/Stpauls-middlechurch-man.jpg 640w, https://opentextbc.ca/geography/wp-content/uploads/sites/34/2014/06/Stpauls-middlechurch-man-300x233.jpg 300w, https://opentextbc.ca/geography/wp-content/uploads/sites/34/2014/06/Stpauls-middlechurch-man-65x50.jpg 65w, https://opentextbc.ca/geography/wp-content/uploads/sites/34/2014/06/Stpauls-middlechurch-man-225x175.jpg 225w, https://opentextbc.ca/geography/wp-content/uploads/sites/34/2014/06/Stpauls-middlechurch-man-350x272.jpg 350w" sizes="auto, (max-width: 400px) 100vw, 400px" title="" /></a><div class="wp-caption-text" id="caption-attachment-60">Figure 1.2. Residential schoolchildren. St. Paul’s Indian Industrial School, Middlechurch, Manitoba, 1901</div></div> <p>Another example of changing attitudes is evident in the story of&nbsp;the Indian residential school system, which was in place&nbsp;from the 1880s until 1996. During much of that time, Aboriginal children were required to&nbsp;attend government- and church-run schools under an ideology of assimilation. There was widespread physical, sexual and mental&nbsp;abuse within the schools, which also separated Aboriginal children from their families and their land. The increasing urbanization of Aboriginal people in BC and in Canada is also attributed to the residential school system. In 2008, the federal government apologized for how Aboriginal people were treated under the system.</p> <p><strong>Technological changes</strong> affect the physical environment and how people live in cities. Economic innovation is often precipitated by technological change. For example, the development of the steam engine was&nbsp;strong enough to power a long-distance railway across much of North America. Today, advances in telecommunications and wireless networks allow people in cities to carry devices that allow mobile Internet access. Cities have also become tech hubs, providing jobs to local economies. For example, Vancouver is the home to <a href="https://hootsuite.com/" target="_blank" rel="noopener" data-url="https://hootsuite.com/">HootSuite</a> <span class="footnote"><span class="footnote-indirect" data-fnref="61-1"></span></span> and <a href="http://www.ea.com/ca" target="_blank" rel="noopener" data-url="http://www.ea.com/ca">Electronic Arts Entertainment</a>. <span class="footnote"><span class="footnote-indirect" data-fnref="61-2"></span></span></p> <p><strong>Environmental changes </strong>that affect cities tie into broad networks. For example, air pollution and&nbsp;water quality cannot be governed or contained at the local level; they require cross-jurisdictional management. Increasing CO2 emissions not only raise local health risks in cities, causing higher rates of asthma and other respiratory illness, but&nbsp;also contribute to global climate change.</p> <p>Understanding the interrelationship of these various urbanization processes helps us to understand the dynamic role of cities.</p> <h2>Attributions</h2> <ul><li><strong>Figure 1.1</strong> Graph of BC’s population from 1851-2011. British Columbia population, urban and rural (1851-2011) by Arthur Gill Green. Adapted from <a href="https://web.archive.org/web/20130622170700/http://www.statcan.gc.ca/tables-tableaux/sum-som/l01/cst01/demo62k-eng.htm" data-url="https://web.archive.org/web/20130622170700/http://www.statcan.gc.ca/tables-tableaux/sum-som/l01/cst01/demo62k-eng.htm">Population, urban and rural, by province and territory (British Columbia), Statistics Canada</a>.</li> <li><strong>Figure 1.2</strong> Residential schoolchildren. St. Paul’s Indian Industrial School, Middlechurch, Manitoba, 1901 is in the Public Domain Retrieved from <a href="http://en.wikipedia.org/wiki/Canadian_Indian_residential_school_system#mediaviewer/File:Stpauls-middlechurch-man.jpg" target="_blank" rel="noopener" data-url="http://en.wikipedia.org/wiki/Canadian_Indian_residential_school_system#mediaviewer/File:Stpauls-middlechurch-man.jpg">http://en.wikipedia.org/wiki/Canadian_Indian_residential_school_system#mediaviewer/File:Stpauls-middlechurch-man.jpg</a>)</li> </ul> 
	</div>
			
				
				<div class="footnotes"><div id='61-1'>
<p>HootSuite <a href="https://hootsuite.com/" target="_blank" rel="noopener" data-url="https://hootsuite.com/">https://hootsuite.com/</a></p>

</div><div id='61-2'>
<p>Electronic Arts Entertainment <a href="http://www.ea.com/ca" target="_blank" rel="noopener" data-url="http://www.ea.com/ca">http://www.ea.com/ca</a></p>

</div></div>
	</div>
<div class="chapter standard with-subsections" id="chapter-slug-2-3-urbanization-in-british-columbia" title="Urbanization in British Columbia">
	<div class="chapter-title-wrap">
		<p class="chapter-number">2</p>
		<h1 class="chapter-title">Urbanization in British Columbia</h1>
								</div>
	<div class="ugc chapter-ugc">
				 <p>The place we call&nbsp;British Columbia was settled approximately 10,000 years ago by people migrating from Eastern Asia across the Bering Strait. Permanent settlements by First Nations in BC are commonly dated to around 5,000 years ago. These places served as anchors for agriculture and as trade routes along the coast and the rivers reaching further east. This process of&nbsp;<strong>urbanization</strong>&nbsp;contributed to the formation of complex societies that have existed&nbsp;in BC ever since.</p> <p>In the early 18th century,&nbsp;First Nations societies living in BC made contact with Spanish and British explorers. It is unknown precisely how many&nbsp;First Nations were living within the territory at the time of contact, but estimates range from 80,000 to 500,000, indicating large social groups living throughout the region.</p> <p>With the coming of British settlers, so too came processes of&nbsp;<strong>deterritorialization</strong>&nbsp;and&nbsp;<strong>displacement</strong><em class="Italic">. </em>This happened most directly through the creation of the reserve system, the enactment of the British North American Act (1867) and the Indian Act (1876), processes of&nbsp;<strong>reterritorialization</strong>&nbsp;settlement, and British occupation&nbsp;that signaled the beginning of colonial dominance in the region.</p> <h2>The Colonial City</h2> <p>A <strong>colonial city</strong> is a settlement either mapped onto an existing settlement or created to establish economic and military dominance in a colony. The function of the colonial city was to&nbsp;centralize and regulate&nbsp;trade for export back to home countries in England and western Europe, and to&nbsp;expand colonial power over the land.</p> <p>Victoria was established as a trading and military post on the southern tip of Vancouver Island in 1841. It became the first&nbsp;<strong>colonial&nbsp;city</strong> in British Columbia to secure British dominance over the Spanish and First Nations in the region.&nbsp;It was established on land settled by the Songhees First Nation and grew to be a lively urban settlement and a strategic military site.</p> <p>On the mainland, New Westminster&nbsp;and Vancouver&nbsp;were settled by the British&nbsp;in order to establish both a capital of the colony of British Columbia (in the case of New Westminster, 1859) and a new economic centre along the Burrard Inlet (in the case of Vancouver, 1862). Forestry, trapping and fishing were the main economic drivers of these new colonial settlements; however, it was the discovery of gold in Haida Gwaii and the lower Fraser River that led to rapid urbanization in 1858.</p> <h2>Cultural Composition and Trade Activities</h2> <p>Colonial trade activities shaped the landscape of BC over the next 200 years. Throughout this time the cultural composition of Canadian cities&nbsp;was changing through various waves of immigration. Chinese workers came to BC to build the Canadian Pacific Railway, and then&nbsp;settled&nbsp;throughout the province&nbsp;in designated neighbourhoods. The establishment of Chinatowns in BC, as elsewhere in the world, reflected the view that as visible minorities, the Chinese were inferior and should therefore live apart. What is now the second-oldest Chinatown in North America was established in&nbsp;Victoria. Other Chinatowns arose in&nbsp;Vancouver, Richmond,&nbsp;New Westminster, Nanaimo and Penticton. There was also&nbsp;significant Chinese settlement in&nbsp;Hazelton<span style="background-color: #ffffff;">,&nbsp;</span>Boston Bar<span style="background-color: #ffffff;">,&nbsp;</span>Lillooet<span style="background-color: #ffffff;">,&nbsp;</span>Rock Creek<span style="background-color: #ffffff;">,&nbsp;</span>Granite Creek<span style="background-color: #ffffff;">&nbsp;and&nbsp;</span>Fisherville<span style="background-color: #ffffff;">&nbsp;(Wild Horse Creek)</span><span style="background-color: #ffffff;">. As you can see in Figure 1, BC has always been home to significant percentages of immigrants to Canada. Other immigrant groups&nbsp;to British Columbia&nbsp;throughout the past 200 years include Indian,&nbsp;East Asian, Italian, Japanese, Scandanavian and&nbsp;German peoples</span><span style="background-color: #ffffff;">. &nbsp;</span></p> <div class="wp-caption aligncenter" style="width: 450px"><a href="http://opentextbc.ca/geography/wp-content/uploads/sites/34/2014/06/Chart_1.jpg" data-url="http://opentextbc.ca/geography/wp-content/uploads/sites/34/2014/06/Chart_1.jpg"><img src="http://opentextbc.ca/geography/wp-content/uploads/sites/34/2014/06/Chart_1.jpg" height="218" width="450" alt="" title="" /></a><div class="wp-caption-text">Figure 1.3 Immigrants residing in Vancouver Census Metropolitan Area as a percentage of Canada’s and British Columbia’s immigrant population, by period of immigration, 2001</div></div> <h2>Railway and Urban Growth</h2> <p>In 1871, British Columbia joined the Canadian Confederation over fears of US annexation, and with the promise that the railway would be extended west. With the construction of the railway came a second wave of immigration to the area. According to census data, the population of BC doubled between 1881, when the railway was finished, and 1891. Resource extraction activities, including mining, fishing and forestry, continued during this time, ensuring a steady economy for people moving to the province.</p> <p>At the beginning of the 20th century, urbanization in BC was focused toward the east, with communities such as Revelstoke and Kamloops gaining population. The railway remained a key route for transporting people and goods across the province&nbsp;during&nbsp;the Great Depression of the 1930s, which saw outward migration from BC urban centres, throughout World War II and the rise in shipbuilding in the Burrard Inlet, and during the postwar economic boom of the 1950s and&nbsp;up through the 1970s.</p> <p>Rapid growth throughout the province was precipitated by large multinational firms interested in expanding the forestry industry, with&nbsp;pulp and paper mills being built in places such as&nbsp;Prince George, Kitimat, Gold River, Castlegar and Kamloops. During this time the provincial government was also involved in several infrastructure expansion projects. The establishment in 1960 of BC Ferries led to the rapid expansion of the water transport within the province. Airport expansion and road upgrades also transformed the connections between cities. The rapid advances&nbsp;of global transportation technologies, combined with falling energy prices that led to globalization throughout the 1970s and into the 1980s led to the boom in oil&nbsp;and natural gas industries, bolstering many northern BC towns. Simultaneously, the global transport of goods became cheaper, production and manufacturing was moved to countries outside of North America and commodity prices declined.&nbsp;This shifting global production economy affected BC in the early 1980s. In 1982 the BC economy shrank by 2.9%. In response,&nbsp;urban redevelopment efforts were spurred on, such as the development of False Creek in Vancouver in preparation for the World’s Fair, Expo ’86.</p> <h2>Contemporary Urbanization in BC</h2> <p>Contemporary urbanization in BC is characterized by significant population growth in southwestern BC cities, depopulation of northern BC urban centres and housing affordability and security throughout the province. Rapidly changing technologies and resource use, as well as the conflict over whether and how to extract resources in the province mean that the exact form of urbanization in BC cities is impossible to predict. In the following section we explore two case studies that look at more contemporary urban processes in Vancouver and Victoria respectively.</p> <h2>Attributions</h2> <ul><li><strong>Figure 1.3</strong> Immigrants residing in Vancouver Census Metropolitan Area as a percentage of Canada’s and British Columbia’s immigrant population, by period of immigration, 2001 by the Government of Canada and Citizenship and Immigration Canada (<a href="http://www.cic.gc.ca/english/notices.asp#copyright" data-url="http://www.cic.gc.ca/english/notices.asp#copyright">http://www.cic.gc.ca/english/notices.asp#copyright</a>).</li> </ul> 
	</div>


	</div>
<div class="chapter standard with-subsections" id="chapter-slug-2-4-case-studies" title="Case Study 1: The Georgia and Dunsmuir Viaducts">
	<div class="chapter-title-wrap">
		<p class="chapter-number">3</p>
		<h1 class="chapter-title">Case Study 1: The Georgia and Dunsmuir Viaducts</h1>
								</div>
	<div class="ugc chapter-ugc">
				
 <h1 id="chapter-67-section-1" class="section-header">Vancouver: The Greenest City?</h1> <p>Vancouver has developed a reputation as being a leader in urban sustainable development based on the density of the downtown core, its walkability and the integration of the natural landscape into its neighbourhoods. This reputation is built on Vancouver’s&nbsp;history of social and environmental activism on&nbsp;various local and global issues&nbsp;such as migration, economic development and resource extraction.&nbsp; The environmental activist organization Greenpeace was founded in Vancouver,&nbsp;and currently the&nbsp;city is&nbsp;implementing&nbsp;a sustainability framework known as the&nbsp;Greenest City Action Plan.</p> <p>The Georgia and Dunsmuir Viaducts, which&nbsp;connect East Vancouver to the downtown core, are remnants of a failed plan to bring a freeway through the heart of Vancouver in the 1970s. The viaducts are what architect <a target="_blank" href="http://www.cca.qc.ca/en/collection/541-aldo-rossi-archive" data-url="http://www.cca.qc.ca/en/collection/541-aldo-rossi-archive">Aldo Rossi </a>calls&nbsp;<strong class="Bold">urban artifacts –&nbsp;</strong>public, material structures that have layers of meaning placed on them by people in the city. Public opposition to the freeway&nbsp;plan is often credited with preserving the city’s&nbsp;historical neighbourhoods such as Gastown, Chinatown and Strathcona. It was a defining moment when urbanist and activist <a target="_blank" href="http://www.janeswalk.org/information/about/jane-jacobs/" data-url="http://www.janeswalk.org/information/about/jane-jacobs/">Jane Jacobs</a>’ ideas of mixed-use urban spaces populated by socially and culturally diverse communities triumphed over urban planner <a target="_blank" href="http://en.wikipedia.org/wiki/Robert_Moses" data-url="http://en.wikipedia.org/wiki/Robert_Moses">Robert Moses</a>’s modernist utopia of highways and highrises. Today, the city is exploring options for removing the viaducts completely under the Greenest City Action Plan.</p> <p>So how is it that a 50-year-old battle about&nbsp;highways in the city helped to make Vancouver environmentally conscious? How does the city implement sustainability policies?</p> <div class="wp-caption aligncenter" id="attachment_65" aria-describedby="caption-attachment-65" style="width: 400px"><a href="http://opentextbc.ca/geography/wp-content/uploads/sites/34/2014/06/IMG_0677-e1405119267767.jpg" data-url="http://opentextbc.ca/geography/wp-content/uploads/sites/34/2014/06/IMG_0677-e1405119267767.jpg"><img class="wp-image-65" alt="Photo: Cristina Temenos" src="http://opentextbc.ca/geography/wp-content/uploads/sites/34/2014/06/IMG_0677-e1405119267767.jpg" height="299" width="400" title=""></a><div class="wp-caption-text" id="caption-attachment-65">Figure 1.4 The Georgia and Dunsmuir Viaducts</div></div> <p>&nbsp;</p> <h2>Urban Decay</h2> <p>In the 1950s many cities in North America were undergoing <strong class="Bold">urban decay, </strong>which was&nbsp;defined by stagnating economies due to deindustrialization, depopulation, changing and racialized populations moving into the urban centres, a wave of immigration to North America, a growing ideology of home ownership and suburbanization, fears of increased crime, and poverty leading to increased instances of ill health, illicit drug use and decreased property values. This narrative of urban decay was often the impetus behind implementing large-scale urban restructuring projects such as highway construction, public housing projects, and modern highrise office buildings.&nbsp;As a result of these large-scale projects, many historic neighbourhoods were destroyed and poor and marginalized communities were displaced.</p> <p>The phenomenon of depopulation and stagnant economies was&nbsp;not as severe in most Canadian cities as&nbsp;in the United States, but Canadian urban planners, politicians and those with economic interests still worried about what might&nbsp;happen to their cities.&nbsp;Vancouver, with a pro-development government at the time, advocated&nbsp;for a large rescaling project based on people driving cars.&nbsp;In 1960, the Vancouver Board of Trade put forward a development plan advocating a 45-mile network of freeways linking the metropolitan region. The Georgia and Dunsmuir Viaducts, built in 1972, are the only completed part of this plan.&nbsp;Around the same time,&nbsp;Project 200, a Vancouver waterfront redevelopment, was introduced. It included a freeway running along English Bay and through Gastown, Chinatown and Strathcona. The plan was to build&nbsp;modern highrise towers and a freeway exit leading commuters straight to parking garages on the waterfront.</p> <p>Luckily, Project 200 also did not come to fruition. In 1971, the federal government stated that money slated for urban redevelopment in British Columbia could not be used for transportation development. The reasons for that decision were not due to a lack of money, or austerity measures but because of the&nbsp;sustained efforts of Strathcona residents&nbsp;organizing against urban renewal projects and the transportation projects that ensued from them.</p> <p><strong>The Freeway</strong></p> <p>Why didn’t these freeway plans materialize as they did in so many other North American cities?&nbsp;The two dominant narratives about why Vancouver did not build the freeway are (1) there was not enough regional planning coordination and resources for a freeway to be built in the metro Vancouver region, and (2) people, through community activism and professional groups, rejected the plan. By 1967, the Chinatown Freeway Debates, as they are commonly known, become&nbsp;weekly events, with 500 to&nbsp;800 citizens crowding city council meetings protesting the destruction of Strathcona.</p> <p>On November 8, 1967, the federal minister responsible for housing, Paul Hellyer, toured Strathcona with local activist Shirley Chan and city planner Darlene Marzari, two of the main people heading community opposition, along with a lawyer, Mike Harcourt, who later became mayor of Vancouver and then premier of the province. This tour had such an impact on&nbsp;Hellyer that he froze federal funding for urban renewal projects across Canada, including funding that Vancouver city hall was counting on to finance freeway construction.</p> <p>The Chinatown Freeway Debates were a turning point in Vancouver’s planning processes. From this point on, community consultation became a benchmark for urban planning in Canada. The 1972 municipal elections ensured that this process was jumpstarted. The Non-Partisan Association (NPA),&nbsp;the&nbsp;municipal political party that had been in power for 30 years, was defeated in both mayoral and council races by the newly formed Electors’ Action Movement (TEAM). Two of the councillors elected were&nbsp;Mike Harcourt and Darlene Marzari, who had earlier helped to organize Strathcona residents.</p> <h2>Viaduct Removal?</h2> <p>Forty&nbsp;years after the planning debate, in&nbsp;2013, Vancouver City Council approved a $2.4 million final planning phase of the Georgia and Dunsmir Viaduct removal. The viaduct removal will open seven acres of land, which is owned partly&nbsp;by the city and partly by&nbsp;a private developer, Concorde Pacific. It will also allow the city to address traffic calming issues that are a direct result of the viaducts having been built in the first place.</p> <p>There is general consensus that the removal of the viaducts is environmentally beneficial for Vancouver, but&nbsp;there remain&nbsp;questions about how the development will proceed, who might be displaced, whether this development will be socially just and which business interests will benefit.</p> <p>It is estimated that about 1,000 housing units could be developed on the land, and&nbsp;20% or less could be&nbsp;designated as affordable housing (City of Vancouver, 2011), which would help the city address another planning priority, homelessness. The redevelopment is also&nbsp;intended to make way for a&nbsp;&nbsp;“greenway” into the&nbsp;downtown,&nbsp;rerouting the traffic that currently travels along a busy entrance to the downtown core. The concern is that&nbsp;this rerouting will endanger one of Vancouver’s oldest community gardens and the produce warehouses that operate along Malkin Avenue.</p> <p>Questions about the nature of&nbsp;urban planning, public consultation and social sustainability have come to the forefront of the debates around&nbsp;the viaduct removal. Neighbourhood residents are asking how the city-favoured plan maintains communities, and what the nature of public consultation is. Strathcona’s legacy of community activism and multiculturalism is a part of its identity. But, as the current debate about the viaduct removal shows, the struggle continues.</p> <h2>Attributions</h2> <ul><li><strong>Figure 1.4</strong> The Georgia and Dunsmuir Viaducts Photo by Cristina Temenos</li> </ul> 

	</div>


	</div>
<div class="chapter standard with-subsections" id="chapter-case-study-2" title="Case Study 2: Dockside Green, Victoria">
	<div class="chapter-title-wrap">
		<p class="chapter-number">4</p>
		<h1 class="chapter-title">Case Study 2: Dockside Green, Victoria</h1>
								</div>
	<div class="ugc chapter-ugc">
				 <p>The case of Dockside Green in Victoria, a mixed-use development built in 2011&nbsp;on an abandoned dockyard, is helpful in illustrating how cities are parts of larger systems, such as environmental, economic and social interactions.</p> <div class="wp-caption aligncenter" id="attachment_660" aria-describedby="caption-attachment-660" style="width: 400px"><a href="http://opentextbc.ca/geography/wp-content/uploads/sites/34/2014/07/dockside1-e1406070154970.jpg" data-url="http://opentextbc.ca/geography/wp-content/uploads/sites/34/2014/07/dockside1-e1406070154970.jpg"><img class="wp-image-660" alt="Figure 1: Dockside Green, Victoria" src="http://opentextbc.ca/geography/wp-content/uploads/sites/34/2014/07/dockside1-e1406070154970.jpg" height="267" width="400" title="" /></a><div class="wp-caption-text" id="caption-attachment-660">Figure 1.5 Dockside Green, Victoria</div></div> <div class="wp-caption aligncenter" id="attachment_661" aria-describedby="caption-attachment-661" style="width: 400px"><a href="http://opentextbc.ca/geography/wp-content/uploads/sites/34/2014/07/dockside2-e1406070424610.jpg" data-url="http://opentextbc.ca/geography/wp-content/uploads/sites/34/2014/07/dockside2-e1406070424610.jpg"><img class="wp-image-661" alt="Figure 2: Wind Power, Dockside Green, Victoria" src="http://opentextbc.ca/geography/wp-content/uploads/sites/34/2014/07/dockside2-e1406070424610.jpg" height="297" width="400" srcset="https://opentextbc.ca/geography/wp-content/uploads/sites/34/2014/07/dockside2-e1406070424610.jpg 799w, https://opentextbc.ca/geography/wp-content/uploads/sites/34/2014/07/dockside2-e1406070424610-300x222.jpg 300w, https://opentextbc.ca/geography/wp-content/uploads/sites/34/2014/07/dockside2-e1406070424610-65x48.jpg 65w, https://opentextbc.ca/geography/wp-content/uploads/sites/34/2014/07/dockside2-e1406070424610-225x166.jpg 225w, https://opentextbc.ca/geography/wp-content/uploads/sites/34/2014/07/dockside2-e1406070424610-350x259.jpg 350w" sizes="auto, (max-width: 400px) 100vw, 400px" title="" /></a><div class="wp-caption-text" id="caption-attachment-661">Figure 1.6 Wind power, Dockside Green, Victoria</div></div> <p>A&nbsp;<strong class="Bold">systems-thinking</strong>&nbsp;approach to understanding cities is based on ecological notions of interconnections. With this perspective, cities&nbsp;are as a series of interrelated social, economic and ecological processes that are in constant interaction and motion. Dockside Green, for example, was financed by a local credit union known for innovative and socially conscious investment strategies. This means that it had the dual goal of creating a healthy community and contributing to a healthier environment.</p> <p>The aim of Dockside Green was to create a community that takes into account environmental, social and economic sustainability, and it is based on&nbsp;<strong class="Bold">new urbanism</strong>&nbsp;principles (Figure 1.7). These principles include, <strong>connectivity</strong>, <strong>sustainability</strong>, <strong>walkability</strong>, <strong>traditional design</strong>, <strong>increased density</strong> and <strong>mixed-use structures</strong>.</p> <div class="wp-caption aligncenter" id="attachment_66" aria-describedby="caption-attachment-66" style="width: 400px"><a href="http://opentextbc.ca/geography/wp-content/uploads/sites/34/2014/06/Cristine-PrinciplesOfUrbanism-01-e1406069906609.png" data-url="http://opentextbc.ca/geography/wp-content/uploads/sites/34/2014/06/Cristine-PrinciplesOfUrbanism-01-e1406069906609.png"><img class="wp-image-66" alt="Figure 1. Principles of New Urbanism" src="http://opentextbc.ca/geography/wp-content/uploads/sites/34/2014/06/Cristine-PrinciplesOfUrbanism-01-e1406069906609.png" height="428" width="400" title="" /></a><div class="wp-caption-text" id="caption-attachment-66">Figure 1.7 Principles of new urbanism</div></div> <p>Before construction could begin, the brownfield site needed extensive environmental remediation at an&nbsp;estimated cost of $12 million. The surrounding community demanded significant input into the waterfront redevelopment because the Gorge Waterway, a saltwater inlet traveling through the city of Victoria, is ecologically important, containing eelgrass beds which are some of the most diverse and productive ecosystems in the world. The beds provide key salmon habitat, act as a nursery space for thousands of marine species, prevent erosion and are a direct food source for migratory birds. The Gorge Waterway also provides Dockside Green with waterfront real estate, increasing the land value of the development.</p> <h2>LEED Development</h2> <p>The design that was chosen for Dockside Green operates under LEED neighbourhood development principles. <strong class="Bold">LEED</strong>, or Leadership in Energy and Environmental Design, is a certification system for green building construction.</p> <h2>Affordability</h2> <p>Housing affordability is a major concern in most Canadian cities, and while Dockside Green has been successful from an environmental sustainability perspective, it has been less so from a housing affordability perspective. Dockside Green is located in Victoria West, a traditionally low-income community in the city. The provision of social housing units was much less that what had been originally proposed in the project, and the main focus on housing affordability was for people making $30,000&nbsp;to $60,000 a year. Many of the units provided were one- and two-bedroom social housing units, which are generally not appropriately sized for low-income families with children. So, while the development has been successful in creating an environmentally high quality of life for its residents, it has been less successful in creating social inclusion.</p> <h2>Attributions</h2> <ul><li><strong>Figure 1.5</strong> Dockside Green, Victoria by Adrianna (<a href="https://flic.kr/p/dVN3kN" target="_blank" data-url="https://flic.kr/p/dVN3kN">https://flic.kr/p/dVN3kN</a>) used under CC-BY-ND 2.0 license (<a href="https://creativecommons.org/licenses/by-nd/2.0/" target="_blank" data-url="https://creativecommons.org/licenses/by-nd/2.0/">https://creativecommons.org/licenses/by-nd/2.0/</a>)</li> <li><strong>Figure 1.6</strong> Wind power, Dockside Green, Victoria by Adrianna (<a href="https://flic.kr/p/dVGqTD" target="_blank" data-url="https://flic.kr/p/dVGqTD">https://flic.kr/p/dVGqTD</a>) used under CC-BY-ND 2.0 license (<a href="https://creativecommons.org/licenses/by-nd/2.0/" target="_blank" data-url="https://creativecommons.org/licenses/by-nd/2.0/">https://creativecommons.org/licenses/by-nd/2.0/</a>)</li> <li><strong>Figure 1.7 </strong>Principles of new urbanism created by Hilda Anggraeni and is released with a CC-BY-SA license. It uses the using the following images and sources: <ul><li>Grafton Street, Dublin (<a href="http://en.wikipedia.org/wiki/Dublin#mediaviewer/File:Grafton_St,_Dublin.jpg" target="_blank" data-url="http://en.wikipedia.org/wiki/Dublin#mediaviewer/File:Grafton_St,_Dublin.jpg">http://en.wikipedia.org/wiki/Dublin#mediaviewer/File:Grafton_St,_Dublin.jpg</a>) by Donaldytong (<a href="http://commons.wikimedia.org/wiki/User:Donaldytong" target="_blank" data-url="http://commons.wikimedia.org/wiki/User:Donaldytong">http://commons.wikimedia.org/wiki/User:Donaldytong</a>) is under CC BY SA (<a href="http://creativecommons.org/licenses/by-sa/3.0/" target="_blank" data-url="http://creativecommons.org/licenses/by-sa/3.0/">http://creativecommons.org/licenses/by-sa/3.0/</a>).</li> <li>Wind turbine with observation deck bruck an der leitha (<a href="http://commons.wikimedia.org/wiki/File:Wind_turbine_with_observation_deck_bruck_an_der_leitha.jpg" target="_blank" data-url="http://commons.wikimedia.org/wiki/File:Wind_turbine_with_observation_deck_bruck_an_der_leitha.jpg">http://commons.wikimedia.org/wiki/File:Wind_turbine_with_observation_deck_bruck_an_der_leitha.jpg</a>) by KoeppiK (<a href="http://commons.wikimedia.org/w/index.php?title=User:KoeppiK&amp;action=edit&amp;redlink=1" target="_blank" data-url="http://commons.wikimedia.org/w/index.php?title=User:KoeppiK&amp;action=edit&amp;redlink=1">http://commons.wikimedia.org/w/index.php?title=User:KoeppiK&amp;action=edit&amp;redlink=1</a>) is under CC BY SA (<a href="http://creativecommons.org/licenses/by-sa/3.0/" target="_blank" data-url="http://creativecommons.org/licenses/by-sa/3.0/">http://creativecommons.org/licenses/by-sa/3.0/</a>).</li> <li>Tampa Florida November 2013 (<a href="http://en.wikipedia.org/wiki/File:Tampa_Florida_November_2013-2b.jpg" target="_blank" data-url="http://en.wikipedia.org/wiki/File:Tampa_Florida_November_2013-2b.jpg">http://en.wikipedia.org/wiki/File:Tampa_Florida_November_2013-2b.jpg</a>) by Alvesgaspar <a href="Alvesgaspar" target="_blank" data-url="Alvesgaspar">(http://commons.wikimedia.org/wiki/User:Alvesgaspar</a>) is under CC BY SA (<a href="http://creativecommons.org/licenses/by-sa/3.0/" target="_blank" data-url="http://creativecommons.org/licenses/by-sa/3.0/">http://creativecommons.org/licenses/by-sa/3.0/</a>).</li> <li>1784 Plan of the City of San Francisco of Quito (<a href="http://commons.wikimedia.org/wiki/File:1784_Plan_of_the_City_of_San_Francisco_of_Quito.jpg" target="_blank" data-url="http://commons.wikimedia.org/wiki/File:1784_Plan_of_the_City_of_San_Francisco_of_Quito.jpg">http://commons.wikimedia.org/wiki/File:1784_Plan_of_the_City_of_San_Francisco_of_Quito.jpg</a>) by Jorge Juan and Antonio de Ulloa (Ortiz, Alfonso 2007, Damero, FONSAL, Quito.) is under Public Domain.</li> <li>022306-CelebrationFL11 (<a href="http://en.wikipedia.org/wiki/New_Urbanism#mediaviewer/File:022306-CelebrationFL11.jpg" target="_blank" data-url="http://en.wikipedia.org/wiki/New_Urbanism#mediaviewer/File:022306-CelebrationFL11.jpg">http://en.wikipedia.org/wiki/New_Urbanism#mediaviewer/File:022306-CelebrationFL11.jpg</a>) by Bobak Ha’Eri (<a href="http://en.wikipedia.org/wiki/User:Bobak" target="_blank" data-url="http://en.wikipedia.org/wiki/User:Bobak">http://en.wikipedia.org/wiki/User:Bobak</a>) is under CC BY SA (<a href="http://creativecommons.org/licenses/by-sa/2.5/" target="_blank" data-url="http://creativecommons.org/licenses/by-sa/2.5/">http://creativecommons.org/licenses/by-sa/2.5/</a>).</li> <li>Prospect New Town in Longmont, Colorado <a href="DSCN3187_prospectnewtown_e_600.jpg" target="_blank" data-url="DSCN3187_prospectnewtown_e_600.jpg">(http://en.wikipedia.org/wiki/New_Urbanism#mediaviewer/File:DSCN3187_prospectnewtown_e_600.jpg</a>) by Decumanus <a href="Decumanus" target="_blank" data-url="Decumanus">(http://commons.wikimedia.org/wiki/User:Decumanus</a>) is under CC BY SA (<a href="http://creativecommons.org/licenses/by-sa/3.0/" target="_blank" data-url="http://creativecommons.org/licenses/by-sa/3.0/">http://creativecommons.org/licenses/by-sa/3.0/</a>).</li> <li>Café de Flore (<a href="http://en.wikipedia.org/wiki/Coffeehouse#mediaviewer/File:Caf%C3%A9_de_Flore.jpg" target="_blank" data-url="http://en.wikipedia.org/wiki/Coffeehouse#mediaviewer/File:Caf%C3%A9_de_Flore.jpg">http://en.wikipedia.org/wiki/Coffeehouse#mediaviewer/File:Caf%C3%A9_de_Flore.jpg</a>) by Arnaud 25 (<a href="http://commons.wikimedia.org/wiki/User:Arnaud_25" target="_blank" data-url="http://commons.wikimedia.org/wiki/User:Arnaud_25">http://commons.wikimedia.org/wiki/User:Arnaud_25</a>) is under Public Domain.</li> </ul> </li> </ul> 
	</div>


	</div>
<div class="chapter standard with-subsections" id="chapter-slug-2-5-summary" title="Summary">
	<div class="chapter-title-wrap">
		<p class="chapter-number">5</p>
		<h1 class="chapter-title">Summary</h1>
								</div>
	<div class="ugc chapter-ugc">
				 <p>&nbsp;</p> <p>The&nbsp; historical background of urbanization of British Columbia dates back to the first settlements by First Nations communities approximately 5,000 years ago. The establishment of settlements along the coast and rivers of BC served as important agriculture and trade routes. At the start of the 18th century the First Nations landscape began to change as a result of the British occupation and colonial domination in the BC region. Cities such as Victoria became prominent trading and military posts and Victoria was established as the first colonial city in BC. Economic drivers such as forestry, trapping, fishing and gold led to a more rapid urbanization in 1858.</p> <p>The rise of immigration, as a result of building the Canadian Pacific Railway mostly by&nbsp;Chinese workers, began to change the cultural composition of British Columbia. The rise in Chinese immigration resulted in the establishment of Chinatowns in BC, which reflected the view that as visible minorities, the Chinese were inferior and should therefore live apart. Once the railway was completed in 1881 the population of BC doubled in a 10-year period (1881-1891).</p> <p>The development of the Canadian Pacific Railway also spurred a transportation boom that resulted in a demographic change in outlying community populations. The urbanization in the 20th century saw Revelstoke and Kamloops gaining population. As the railway was a source for transporting people and goods across British Columbia, there was then an outward migration from BC urban centres through World War II. During the postwar economic boom of the 1950s and&nbsp;up through the 1970s, there was also the rise in shipbuilding in the Burrard Inlet.</p> <p>The economic and population booms that occurred in interior cities across British Columbia resulted in the need for several infrastructure expansion projects, such as BC Ferries and road and airport expansion. Growing global transportation technologies created&nbsp;a boom in the oil and natural gas industries throughout the 1970s and early 1980s. However, with an economic shrinkage of 2.9% in 1982, BC began to increase its efforts in urban redevelopment, especially with the Expo ’86 in Vancouver.</p> <p>A “global sense of place” is a way of viewing&nbsp;a&nbsp;city as globalized or worldly precisely because of its relationship to other places and the mobile processes that are ongoing in places. Likewise, a global sense of place means that&nbsp;the territoriality, or what makes a place unique, is able to be understood because other places are different.</p> <p>A global sense of place characterizes places in three ways:</p> <ol><li>Places have multiple identities and meanings. The meaning is dependent on the people who are experiencing a place.</li> <li>Places are more than physical locations; they are made up of processes.</li> <li>Places are not static; they are ongoing and ever changing because of relationships to other places.</li> </ol> <p>The two case studies highlight the urban processes and considerations involved in sustainable development. The first case study, Vancouver: The&nbsp;Greenest City?questions the true urban sustainable development of Vancouver through the examples of Project 200 and the Georgia and Dunsmuir Viaducts removal. The second case study, Dockside Green, discusses the urban sustainability of developing a LEED neighbourhood and the considerations involved in the development,&nbsp;such as the environmental impact of developing along the Gorge Waterway as well as the socio-economic impact of developing social housing units that have limited social inclusion.</p> 
	</div>


	</div>
<div class="chapter standard with-subsections" id="chapter-slug-2-8-key-terms" title="Key Terms">
	<div class="chapter-title-wrap">
		<p class="chapter-number">6</p>
		<h1 class="chapter-title">Key Terms</h1>
								</div>
	<div class="ugc chapter-ugc">
				 <div class="bcc-box bcc-success"><h3>Key Terms</h3> <p><strong class="Bold">City: </strong>A constellation of people and social, political, and economic institutions and&nbsp;infrastructures&nbsp;within a physical location.</p> <p><strong class="Bold">Colonial city: </strong>A settlement either mapped onto an existing settlement or created to establish economic and military dominance in a colony.</p> <p><span itemscope="itemscope" itemtype="http://schema.org/WebPage" itemref="about copyrightHolder copyrightYear inLanguage publisher"><strong>Deterritorialization: </strong>The severing of social, cultural and political ties from a homeland.<strong><br /> </strong></span></p> <p><span itemscope="itemscope" itemtype="http://schema.org/WebPage" itemref="about copyrightHolder copyrightYear inLanguage publisher"><strong>Displacement:</strong>&nbsp; The coerced movement of a people from their traditional homeland.<strong><br /> </strong></span></p> <p><strong class="Bold">Global sense of place: </strong>Every city is globalized or worldly precisely because of its relationship to other places, and the mobile processes that are ongoing in places. Likewise, a global sense of place means that&nbsp;the territoriality, or what makes a place unique, is able to be understood because other places are different.</p> <p><strong class="Bold">LEED </strong>(Leadership in Energy and Environmental Design): A certification system for green building construction.</p> <p><strong class="Bold">New urbanism:</strong> Connectivity, sustainability, walkability, traditional design, increased density and mixed-use structures.</p> <p><span itemscope="itemscope" itemtype="http://schema.org/WebPage" itemref="about copyrightHolder copyrightYear inLanguage publisher"><strong>Reterritorialization: </strong>the rebuilding or reconstruction of a previously deterritorialized place.<br /> </span></p> <p><strong class="Bold">Systems -thinking:</strong> An approach to understanding cities based on ecological notions of interconnections. This perspective sees cities as a series of interrelated social, economic and ecological processes that are in constant interaction and motion.</p> <p><strong class="Bold">Urbanization: </strong>Combines various socio-economic, political, technological and environmental processes that affect the way that cities are made up and how people live in cities.</p> <p><strong class="Bold">Urban artifacts : </strong>Public material structures that have layers of meaning placed on them by people in the city.</p> <p><strong class="Bold">Urban decay:</strong> Processes defined by stagnating economies due to deindustrialization, depopulation of cities, changing and racialized populations moving into the city, immigration, a growing ideology of home ownership and suburbanization, fears of increased crime, and poverty leading to increased instances of ill health, illicit drug use and decreased property values.</p> </div> <p>&nbsp;</p> <p>&nbsp;</p> 
	</div>


	</div>
<div class="chapter standard with-subsections" id="chapter-slug-2-6-activities" title="Suggested Activities">
	<div class="chapter-title-wrap">
		<p class="chapter-number">7</p>
		<h1 class="chapter-title">Suggested Activities</h1>
								</div>
	<div class="ugc chapter-ugc">
				 <div class="bcc-box bcc-info"><h3>Suggested Activities</h3> <h2>Activity 1</h2> <p>Find a local urban issue that you are interested in. Research all sides of the argument.</p> <h2>Activity 2</h2> <p>Write a blog post that explains a local&nbsp;issue of interest to you or your community.&nbsp;Make sure you situate it in the local history, and explain the implications of potential outcomes. Keep a journal about this issue.</p> <h2>Activity 3</h2> <p>Create or add to a Wikipedia entry on this issue (remember to include your sources).</p> <h2>Activity 4</h2> <p>Visit <a href="http://wikimapia.org" target="_blank" data-url="http://wikimapia.org">Wikimapia</a><span class="footnote"><span class="footnote-indirect" data-fnref="69-1"></span></span> or <a href="http://www.openstreetmap.org" target="_blank" data-url="http://www.openstreetmap.org">OpenStreetMaps</a><span class="footnote"><span class="footnote-indirect" data-fnref="69-2"></span></span> and&nbsp;find your neighbourhood or the community in which you live. In this chapter we learned that places have multiple identities. Is your understanding of your neighbourhood represented on the map? If not, add volunteered geographic information to the map to represent your understanding of place. Change the lines, add points of interest or of significance to your community on this open source online mapping platforms.</p> <h2>Activity 5</h2> <p>Find a community group that is actively engaged with the issue. Act as a participant observer and volunteer your time and skills to create a product that the group will find useful (e.g., a map, a history, a report, or an infographic).</p> <h2>Activity 6</h2> <p>Ask a family member to create a sketch map of his or her&nbsp;day-to-day experiences. Ask him or her&nbsp;to identify places in the community that have changed over time. Ask questions about areas that have either become more urban or have perhaps experienced urban decay.</p> </div> <p>&nbsp;</p> 
	</div>
			
				
				<div class="footnotes"><div id='69-1'>
<p>Wikimapia <a href="http://wikimapia.org" target="_blank" data-url="http://wikimapia.org">http://wikimapia.org</a></p>

</div><div id='69-2'>
<p>OpenStreeMaps <a href="http://www.openstreetmap.org" target="_blank" data-url="http://www.openstreetmap.org">http://www.openstreetmap.org</a></p>

</div></div>
	</div>
<div class="chapter standard with-subsections" id="chapter-slug-2-7-references-and-resources" title="References and Resources">
	<div class="chapter-title-wrap">
		<p class="chapter-number">8</p>
		<h1 class="chapter-title">References and Resources</h1>
								</div>
	<div class="ugc chapter-ugc">
				 <h2>References</h2> <p>Belshaw, J.D. 2008, Becoming British Columbia: A Population History, UBC Press.</p> <p>Berelowitz, Lance. 2005. Dream City: Vancouver and the Global Imagination<em class="Italic">.&nbsp;</em>Vancouver: Douglas and McIntyre.</p> <p>Blomley, Nicholas, Ley, David and Wyly, Elvyn<em class="Italic">.&nbsp;</em>2011. “Gentrification pushes out the poor.” Vancouver Sun, Feb 2, http://www.sfu.ca/~blomley/op-ed.pdf</p> <p>City of Vancouver. 2011. Report to Council (June 26, 2011): Viaducts and False Creek Flats Planning Eastern Core Strategy. Director of Planning and Engineering Services, http://vancouver.ca/docs/eastern-core/core-strategy-council-report.pdf</p> <p>Cole, Yolande<em class="Italic">.</em>&nbsp;“Vancouver votes to proceed with two-year study of viaducts removal.” The Georgia Straight, 26 June, 2013.</p> <p>Dale, A., &amp; Newman, L. L. (2009). Sustainable development for some: green urban development and affordability.&nbsp;<em class="Italic">Local Environment</em>, <em class="Italic">14</em> (7), 669-681.</p> <p>Dockside Green Website.&nbsp;http://www.docksidegreen.com Date Accessed: June 10, 2014.</p> <p>Driftmier, Peter. 2012, Fall. Tearing Down the Viaducts: Green for all or Green for Some? [Podcast]. City: Redeye Vancouver. Coop Radio 100.5 FM.</p> <p>Harcourt, Mike and Cameron, Ken. 2007. City making in paradise. Nine decisions that saved Vancouver<em class="Italic">.&nbsp;</em>Vancouver/Toronto: Douglas &amp; McIntyre.</p> <p>Hasson, Schlomo and Ley, David. 1994. Neighbourhood Organizations and the Welfare State<em class="Italic">.&nbsp;</em>Toronto: University of Toronto Press.</p> <p>Hulchanski, David and Shapcott, M. 2004. Finding room: Options for a Canadian Rental Housing Strategy<em class="Italic">.&nbsp;</em>Toronto: CUCS Press.</p> <p>Liscombe, Rhodri W. 2011. “A study in Modern(ist) urbanism: planning Vancouver, 1945–1965.” Urban History 38 (1): 124-149.</p> <p>Massey, D. (1991). A global sense of place.&nbsp;<em class="Italic">Marxism today</em>, <em class="Italic">35</em>(6), 24-29.</p> <p>Rosol, Marit &amp; Temenos, Cristina. (In Press). The Greenest City Experience: Exploring Social Action and Social Sustainability in Vancouver, Canada. Mössner, S., Freytag, T., Krueger, R. (eds)&nbsp;<em class="Italic">Adventures in Urban Sustainable Development:</em>&nbsp;<em class="Italic">Theoretical interventions and notes from the field.&nbsp;</em>MIT Press.</p> <h2>Resources</h2> <ul><li><a href="http://www.fcm.ca" target="_blank" data-url="http://www.fcm.ca">Federation of Canadian Municipalities </a></li> <li><a href="http://www.citypopulation.de/Canada-BritishColumbia.html" target="_blank" data-url="http://www.citypopulation.de/Canada-BritishColumbia.html">Interactive demographic map of BC cities </a></li> <li><a href="http://indigenousfoundations.arts.ubc.ca/home/government-policy/the-residential-school-system.html" target="_blank" data-url="http://indigenousfoundations.arts.ubc.ca/home/government-policy/the-residential-school-system.html">Residential School Primer </a></li> <li><a href="http://www.terrain.org/unsprawl/25/" target="_blank" data-url="http://www.terrain.org/unsprawl/25/">Dockside Green Case Study from Terrain.org </a></li> <li><a href="http://www.theatlantic.com/international/archive/2011/08/is-this-the-worlds-greenest-neighborhood/244121/" target="_blank" data-url="http://www.theatlantic.com/international/archive/2011/08/is-this-the-worlds-greenest-neighborhood/244121/">Is This The World’s Greenest Neighbourhood</a>&nbsp; (The Atlantic)</li> </ul> 
	</div>


	</div>

</div>
<div class="part-wrapper" id="part-chapter-3-wrapper">
    <div class="part  " id="part-chapter-3">
	<div class="part-title-wrap">
		<p class="part-number">II</p>
		<h1 class="part-title">2. Socio-Economics in British Columbia</h1>
	</div>
	<div class="ugc part-ugc">
		<div class="bcc-box bcc-highlight"><h3>Learning Objectives</h3> <ul><li>Discuss the measurement of socio-economic development and well-being through the use of statistical tools.</li> <li>Construct British Columbia (BC) as a desirable place to live and work.</li> <li>Assess what is understood by quality of life and BC’s (Vancouver) rank.</li> <li>Debate the “hidden” social issues behind quality of life.</li> <li>Appraise the cost of real estate as a frame for socio-economic well-being.</li> </ul> </div> <p>&nbsp;</p>
	</div>
			
				
	</div>
<div class="chapter standard with-subsections" id="chapter-slug-3-2-introduction" title="Introduction">
	<div class="chapter-title-wrap">
		<p class="chapter-number">9</p>
		<h1 class="chapter-title">Introduction</h1>
								</div>
	<div class="ugc chapter-ugc">
				 <p>This chapter will focus on the notion of quality-of-life measures, livable cities and some social issues.</p> <p>In Geography, economic development analysis often focuses on a core-periphery global divide based on advanced technological economies versus less-developed countries (LDCs) or what is sometimes referred to as the Global South or the Third World.</p> <p>Economic development is measured based on a country’s <strong>gross domestic product (GDP)</strong>, <strong>gross national income (GNI)</strong> and <strong>purchasing power parity (PPP)</strong>.</p> <p><strong class="Bold">Gross domestic product</strong>&nbsp;(GDP) is usually used as an estimate of the total value of all materials, foodstuffs, goods and services that a country produces in one year. As GDP is a measure of commodities, the figure for each country is divided by the total population of the country in order to get the&nbsp;per capita GDP.</p> <p><strong class="Bold">Gross national income</strong>&nbsp;(GNI) is a measure of the income that flows into a country from production no matter where in the world companies from that country may be operating.</p> <p><strong>P</strong><strong class="Bold">urchasing power parity&nbsp;</strong>(PPP) is the&nbsp;third important measurement of economic development.&nbsp;This tool calculates&nbsp;how much the local currency of a country can buy locally (i.e., what can you buy with CAD 20 in Canada compared with its equivalent in Colombia.</p> <p>There are a number of other tools used to measure economic development and these are available in the resource section.</p> 
	</div>


	</div>
<div class="chapter standard with-subsections" id="chapter-quality-of-life-measures" title="Quality-of-Life Measures">
	<div class="chapter-title-wrap">
		<p class="chapter-number">10</p>
		<h1 class="chapter-title">Quality-of-Life Measures</h1>
								</div>
	<div class="ugc chapter-ugc">
				 <p>Generalizations of the divide between core and periphery, Global South and Global North, and Third World and&nbsp;First World, often lead to representing the different countries as&nbsp;<em class="Italic">poor</em>&nbsp;and&nbsp;<em class="Italic">rich</em>&nbsp;countries. This is a very general description with&nbsp;<em class="Italic">poor</em>&nbsp;countries regarded as ones where the standard of living is lower than those regarded as&nbsp;<em class="Italic">rich</em>.&nbsp;Usually this means that people in&nbsp;<em class="Italic">rich</em>&nbsp;countries have higher incomes that allow them access to better&nbsp;living conditions, health and education. GNI in rich and poor countries is&nbsp;therefore a measure of economic performance, but it is also used as a reliable&nbsp;<em class="Italic">macro</em>&nbsp;measure of social development.&nbsp;However, many believe that these statistics are not a good measure of general social well-being as they do not take into account the spatiality of economic distribution.</p> <p>And&nbsp;what about&nbsp;the uneven income distribution and different opportunities within the cities of the Global North? For example, Vancouver, as the largest city in British Columbia, is ranked among the top most livable cities in the world. BC, as a province, is a destination for people from all over Canada as well as the world as a very desirable place to live and work. Large numbers of good schools and a comprehensive health-care system, among other factors, make BC an attractive location. But is that&nbsp;all good news for BC and its residents?</p> <h2>Quality of Life</h2> <p><strong class="Bold">Quality-of-life&nbsp;</strong>(QOL) surveys are another tool that are used globally to measure standards of living based on indicators other than economic ones. Introduced as a concept to Geography in the 1970s,&nbsp;<strong>quality of life</strong><span style="background-color: #ffffff;color: #252525"><strong>&nbsp;</strong>is the general&nbsp;</span>well-being<span style="background-color: #ffffff;color: #252525">&nbsp;of individuals and societies. It was originally used in studies of territorial spatial indicators (Knox, 1975; Smith, 1973), and is now used <span style="color: #252525">as a measurement in many fields including&nbsp;</span>international development<span style="background-color: #ffffff;color: #252525">, health care, politics and employment.&nbsp;</span> </span></p> <p><span style="background-color: #ffffff;color: #252525">Today, QOL is used to measure more than&nbsp;GDP or GNI (which are based only on&nbsp;</span><span style="background-color: #ffffff;color: #252525">income as discussed abovein the previous paragraph). QOL includes not only wealth and employment but also the built environment, physical and mental health, education, recreation and leisure time, and social belonging.</span></p> <p>There are a number of quality-of-life surveys including the <a href="http://www.oecdbetterlifeindex.org/" target="_blank" data-url="http://www.oecdbetterlifeindex.org/">OECD Better Life Index</a> <span class="footnote"><span class="footnote-indirect" data-fnref="349-1"></span></span> and the <a href="http://www.mercer.com/insights/view/2014/quality-of-living-rankings-spotlight-emerging-cities.html" target="_blank" data-url="http://www.mercer.com/insights/view/2014/quality-of-living-rankings-spotlight-emerging-cities.html">Mercer Quality of Living Survey</a> <span class="footnote"><span class="footnote-indirect" data-fnref="349-2"></span></span> In both these surveys Canada rates very highly, with four Canadian cities (Vancouver, Montreal, Ottawa and Toronto), dominating the list of&nbsp;top places to live in North America. The OECD Better Life Survey puts Canada as third overall in the world as the best place to live after Australia and Sweden.</p> 
	</div>
			
				
				<div class="footnotes"><div id='349-1'>
<p>OECD Better Life Index <a href="http://www.oecdbetterlifeindex.org/" target="_blank" data-url="http://www.oecdbetterlifeindex.org/">http://www.oecdbetterlifeindex.org/</a></p>

</div><div id='349-2'>
<p>Mercer Quality of Living Survey. <a href="http://www.mercer.com/insights/view/2014/quality-of-living-rankings-spotlight-emerging-cities.html" target="_blank" data-url="http://www.mercer.com/insights/view/2014/quality-of-living-rankings-spotlight-emerging-cities.html">http://www.mercer.com/insights/view/2014/quality-of-living-rankings-spotlight-emerging-cities.html</a></p>

</div></div>
	</div>
<div class="chapter standard with-subsections" id="chapter-homelessness-and-poverty-in-the-first-world" title="Homelessness and Poverty in the First World">
	<div class="chapter-title-wrap">
		<p class="chapter-number">11</p>
		<h1 class="chapter-title">Homelessness and Poverty in the First World</h1>
								</div>
	<div class="ugc chapter-ugc">
				 <p>Homelessness is a complex social problem, and the characteristics of homelessness vary geographically (Gregory, Johnston, Pratt, Watts, &amp; Whatmore,&nbsp;2009).&nbsp;Homelessness has increased dramatically in the Global North since the 1970s especially among the most vulnerable populations (Takahashi, 1996).</p> <p>Homelessness, or the threat of homelessness, is not just people living or sleeping on the street. Sometimes homelessness is not visible, but it still exists where people are living in&nbsp;abandoned buildings, living in tenements, using emergency shelters, using family or friends as places to stay or even “couch surfing.” The line between&nbsp;being housed and being homeless is often not clear, as people can find themselves in a cycle of moving between temporary “homes” (e.g., staying with family or friends) and shelters for the homeless.&nbsp;As well, many people&nbsp;live&nbsp;in housing that does not meet health and safety standards (e.g., the presence of mould;&nbsp;inadequate electrical or heating systems). All of these living situations&nbsp;put people at risk of poor physical, mental and emotional health.</p> <p>Homelessness is usually publicly stigmatized, and government policies that affect homeless people and their rights and access to public space are often harsh (Mitchell, 2003).</p> <p>Can you imagine that these scenes or situations take place in Canada and specifically in BC?</p> <h2>The Causes of Homelessness</h2> <p>Homelessness is an outcome of the complex interplay of structural factors, systemic failures and individual circumstances (Gaetz, Donaldson, Richter, &amp; Gulliver,&nbsp;2013):</p> <ol><li>Structural factors are&nbsp;where the cost of living has increased but without an adequate&nbsp;increase in income, particularly for those in the lower income brackets or those on social assistance.</li> <li>Systemic failures occur when people fall between the cracks of a country’s systems of care.&nbsp;For example, when people are discharged from hospitals or correctional facilities into emergency shelters or when youth transition out of the child welfare system.</li> <li>Personal circumstances may come into play when&nbsp;individuals and families experience catastrophic events such as job loss, illness or a&nbsp;house fire. Traumatic events or health problems can add to the risk of becoming homeless when housing or income is&nbsp;in short supply.</li> <li>Family violence and conflict, particularly for women, children and youth, may push individuals to flee their homes in order to protect themselves.</li> </ol> 
	</div>


	</div>
<div class="chapter standard with-subsections" id="chapter-slug-3-3-case-studies" title="Case Study 1: Victoria and Williams Lake">
	<div class="chapter-title-wrap">
		<p class="chapter-number">12</p>
		<h1 class="chapter-title">Case Study 1: Victoria and Williams Lake</h1>
								</div>
	<div class="ugc chapter-ugc">
				 <p>This case study on homelessness focuses on BC’s capital, Victoria, and on the interior city of Williams Lake.</p> <div class="wp-caption aligncenter" id="attachment_74" aria-describedby="caption-attachment-74" style="width: 400px"><a href="http://opentextbc.ca/geography/wp-content/uploads/sites/34/2014/06/Siobhan_williamsLake_2-011-e1406148931473.png" data-url="http://opentextbc.ca/geography/wp-content/uploads/sites/34/2014/06/Siobhan_williamsLake_2-011-e1406148931473.png"><img class="wp-image-74" alt="Figure 4.1. Locations of Victoria and Williams Lake" src="http://opentextbc.ca/geography/wp-content/uploads/sites/34/2014/06/Siobhan_williamsLake_2-011-e1406148931473.png" height="381" width="400" title="" /></a><div class="wp-caption-text" id="caption-attachment-74">Figure 2.1. Locations of Victoria and Williams Lake</div></div> <h2>Victoria</h2> <p>Victoria, the capital of BC, is located on the southern tip of Vancouver Island.&nbsp;The city’s population stands at approximately 83,000 but serves as a hub for a regional population of 360,000.&nbsp;<span style="background-color: #ffffff; color: #252525;">Known as the “City of Gardens,” Victoria is an attractive,&nbsp;popular tourist destination with a thriving technology sector, which&nbsp;has risen to be the city’s&nbsp;largest revenue-generating private industry.&nbsp;The city’s other main industries are&nbsp;food products, tourism, education, and federal and provincial government administration and services.&nbsp;</span></p> <p>Despite Victoria’s reputation as a tourist destination, homelessness is a serious problem in the downtown area, as is drug use.&nbsp;The first homeless count in Victoria took place in&nbsp;January 2005, and was carried out as part of a volunteer study by the&nbsp;Victoria Cool Aid Society. That first count totalled&nbsp;approximately 700 individuals, with 50% of those people identifying themselves as being of&nbsp;First Nations origin &nbsp;(Homeless Count – 2005 Victoria, BC Cool Aid Society).&nbsp;The number of homeless people increased dramatically with the anticipated tourism boom of the 2010 Winter Olympics.</p> <h2>Williams Lake</h2> <div class="wp-caption aligncenter" id="attachment_75" aria-describedby="caption-attachment-75" style="width: 400px"><a href="http://opentextbc.ca/geography/wp-content/uploads/sites/34/2014/06/Screen_Shot_2014-06-11_at_8.51_.20_AM_.png" data-url="http://opentextbc.ca/geography/wp-content/uploads/sites/34/2014/06/Screen_Shot_2014-06-11_at_8.51_.20_AM_.png"><img class="wp-image-75" alt="Figure 4.2. Cariboo Regional District showing location of Williams Lake" src="http://opentextbc.ca/geography/wp-content/uploads/sites/34/2014/06/Screen_Shot_2014-06-11_at_8.51_.20_AM_.png" height="246" width="400" srcset="https://opentextbc.ca/geography/wp-content/uploads/sites/34/2014/06/Screen_Shot_2014-06-11_at_8.51_.20_AM_.png 801w, https://opentextbc.ca/geography/wp-content/uploads/sites/34/2014/06/Screen_Shot_2014-06-11_at_8.51_.20_AM_-300x184.png 300w, https://opentextbc.ca/geography/wp-content/uploads/sites/34/2014/06/Screen_Shot_2014-06-11_at_8.51_.20_AM_-65x39.png 65w, https://opentextbc.ca/geography/wp-content/uploads/sites/34/2014/06/Screen_Shot_2014-06-11_at_8.51_.20_AM_-225x138.png 225w, https://opentextbc.ca/geography/wp-content/uploads/sites/34/2014/06/Screen_Shot_2014-06-11_at_8.51_.20_AM_-350x214.png 350w" sizes="auto, (max-width: 400px) 100vw, 400px" title="" /></a><div class="wp-caption-text" id="caption-attachment-75">Figure 2.2 Cariboo Regional District showing location of Williams Lake (click for larger)</div></div> <p>Williams Lake, is a city in the&nbsp;central interior&nbsp;of&nbsp;BC. Located in the region known as the Cariboo, it is the largest urban centre between&nbsp;Kamloops&lt; and&nbsp;Prince George, with a population of 11,150 in the city limits.&nbsp;The primary industries in Williams Lake are&nbsp;forestry, logging, milling,&nbsp;mining&nbsp;and&nbsp;ranching. Williams Lake is best known for the Williams Lake Stampede. This event, held annually&nbsp;on a weekend on or around&nbsp;Canada Day,&nbsp;features&nbsp;Canadian Professional Rodeo Association&nbsp;action including&nbsp;bull riding,&nbsp;barrel racing,&nbsp;bareback&nbsp;riding,&nbsp;tie-down roping,&nbsp;steer wrestling,&nbsp;team roping&nbsp;and chuck wagon&nbsp;races.</p> <div class="wp-caption aligncenter" id="attachment_76" aria-describedby="caption-attachment-76" style="width: 400px"><a href="http://opentextbc.ca/geography/wp-content/uploads/sites/34/2014/06/4772852669_c8c1a4bc61_o-e1405119902485.jpg" data-url="http://opentextbc.ca/geography/wp-content/uploads/sites/34/2014/06/4772852669_c8c1a4bc61_o-e1405119902485.jpg"><img class="wp-image-76" alt="Figure 2. Stampede at Williams Lake BC by Moosealope" src="http://opentextbc.ca/geography/wp-content/uploads/sites/34/2014/06/4772852669_c8c1a4bc61_o-e1405119902485.jpg" height="243" width="400" title="" /></a><div class="wp-caption-text" id="caption-attachment-76">Figure 2.3 Stampede at Williams Lake BC</div></div> <p>The indigenous ethnic makeup of Williams Lake makes it an interesting case study in terms of quality of life and homelessness. The Cariboo‐Chilcotin&nbsp;ethnic makeup, of which Williams Lake is a part of, is vastly different from the rest of BC. In the whole of BC, the Aboriginal population is 4.8%, whereas as in Cariboo‐Chilcotin, it is 16.3%. The majority of First Nations people live on the 15 Secwepemc, Carrier and Tsilhqot’in&nbsp;communities in the area, but a growing number are choosing to live in Williams Lake. Census Canada 2011&nbsp;figures suggest that the Aboriginal population in Williams Lake increased by approximately 130% between 1991 and 2011. Data from 2005 illustrate the difference in income between the Aboriginal population, other visible minorities and non-visible minorities.</p> <div class="wp-caption aligncenter" id="attachment_77" aria-describedby="caption-attachment-77" style="width: 400px"><a href="http://opentextbc.ca/geography/wp-content/uploads/sites/34/2014/06/Siobhan_medianIncome-03-03-e1405119956603.png" data-url="http://opentextbc.ca/geography/wp-content/uploads/sites/34/2014/06/Siobhan_medianIncome-03-03-e1405119956603.png"><img class="wp-image-77" alt="Figure 3. 2005 Median Income by Ethnic Group by Hilda Anggraeni adapted from Statistics Canada. 2007. Williams Lake, British Columbia. 2006 Census. Statistics Canada Catalogue. Ottawa" src="http://opentextbc.ca/geography/wp-content/uploads/sites/34/2014/06/Siobhan_medianIncome-03-03-e1405119956603.png" height="240" width="400" title="" /></a><div class="wp-caption-text" id="caption-attachment-77">Figure 2.4 2005 Williams Lake Median income by ethnic group by Hilda Anggraeni adapted from Statistics Canada, 2007</div></div> <p>Labour force participation rates&nbsp;have declined over the past five census periods&nbsp;with&nbsp;the collapse of the forestry industry in the area, partially caused by the&nbsp;mountain pine beetle infestation. Commuting patterns suggest that most Williams Lake residents leave the city to find&nbsp;employment, especially male residents, some of whom commute as far away as Alberta.</p> <p>According to Census Canada 2011, Williams Lake has a high proportion of renters in the region, who are&nbsp;regarded as an at-risk vulnerable group for living in poverty due to uncertain income and rising costs. In fact,&nbsp;38% of renters in Williams Lake spent 30% of their income on rent compared with 13% by homeowners.</p> <h2>Attributions</h2> <ul><li>Figure 2.1. British Columbia Map by Hilda Anggraeni derived from The Atlas of Canada <a href="//atlas.nrcan.gc.ca/site/english/maps/reference/outlineprov_terr/bc_outline" target="_blank" data-url="//atlas.nrcan.gc.ca/site/english/maps/reference/outlineprov_terr/bc_outline">(http://atlas.nrcan.gc.ca/site/english/maps/reference/outlineprov_terr/bc_outline</a>) and used is under Open Government Licence (<a href="http://data.gc.ca/eng/open-government-licence-canada" target="_blank" data-url="http://data.gc.ca/eng/open-government-licence-canada">http://data.gc.ca/eng/open-government-licence-canada</a>).</li> <li><strong>Figure 2.2</strong> Cariboo Regional District showing location of Williams Lake (<a href="http://www.unbc.ca/sites/default/files/sections/community-development-institute/reviewofsocioeconomiccharacteristisinwilliamslakeedwtemp2014-01-07.pdf" target="_blank" data-url="http://www.unbc.ca/sites/default/files/sections/community-development-institute/reviewofsocioeconomiccharacteristisinwilliamslakeedwtemp2014-01-07.pdf">http://www.unbc.ca/sites/default/files/sections/community-development-institute/reviewofsocioeconomiccharacteristisinwilliamslakeedwtemp2014-01-07.pdf</a>) by Kyle Kusch and used under CC-BY-NC-ND license (<a href="http://creativecommons.org/licenses/by-nc-nd/4.0/" target="_blank" data-url="http://creativecommons.org/licenses/by-nc-nd/4.0/">http://creativecommons.org/licenses/by-nc-nd/4.0/</a>)</li> <li><strong>Figure 2.3</strong> Stampede at Williams Lake BC by Moosealope (<a href="http://www.flickr.com/photos/8510057@N02/4772852669/in/photostream/" target="_blank" data-url="http://www.flickr.com/photos/8510057@N02/4772852669/in/photostream/">http://www.flickr.com/photos/8510057@N02/4772852669/in/photostream/</a>) used under CC-BY 2.0 license (<a href="https://creativecommons.org/licenses/by/2.0/" target="_blank" data-url="https://creativecommons.org/licenses/by/2.0/">https://creativecommons.org/licenses/by/2.0/</a>)</li> <li><strong>Figure 2.4</strong> 2005 Median income by ethnic group by Hilda Anggraeni adapted from Statistics Canada, 2007.</li> </ul> 
	</div>


	</div>
<div class="chapter standard with-subsections" id="chapter-case-study-2-2" title="Case Study 2: Housing Affordability">
	<div class="chapter-title-wrap">
		<p class="chapter-number">13</p>
		<h1 class="chapter-title">Case Study 2: Housing Affordability</h1>
								</div>
	<div class="ugc chapter-ugc">
				 <h2>The Cost of Real Estate and Access to Housing</h2> <p>Affordability of housing<span style="background-color: #ffffff; color: #252525;">&nbsp;in&nbsp;</span>Canada<span style="background-color: #ffffff; color: #252525;">&nbsp;presents a complex paradox. Canada is considered to be among the more affordable places in the Global North to live, with&nbsp;</span><span style="background-color: #ffffff; color: #252525;">80% of Canadians being served by market-based housing,&nbsp;which&nbsp;includes individual home ownership and private rental housing.</span><span style="background-color: #ffffff; color: #252525;">&nbsp;However BC and specifically Vancouver do not fare well in this national picture of affordability.&nbsp;</span></p> <p>The rising inequality gap of affordable housing presents a significant challenge for BC households who are priced out of rental and ownership housing markets. Statistics Canada reported that while Canada’s real GDP) per capita increased by about 50% between 1980 and 2006,&nbsp;and the average earnings among the top 20% of full-time full-year employees grew by 17.9%,&nbsp;among those in the bottom 25% of the distribution average earnings decreased by 13.3% (Statistics Canada, 2006).&nbsp;Lack of affordable housing is one of a number of&nbsp;complex&nbsp;factors that leads to homelessness&nbsp;(Hulchanski, 2009).</p> <div class="wp-caption aligncenter" id="attachment_78" aria-describedby="caption-attachment-78" style="width: 400px"><a href="http://opentextbc.ca/geography/wp-content/uploads/sites/34/2014/06/Siobhan_householdIncome_VSproperty_-e1406061502216.png" data-url="http://opentextbc.ca/geography/wp-content/uploads/sites/34/2014/06/Siobhan_householdIncome_VSproperty_-e1406061502216.png"><img class="wp-image-78" alt="Figure 4.5. Housing Cost in Vancouver BC compared to other cities in Canada" src="http://opentextbc.ca/geography/wp-content/uploads/sites/34/2014/06/Siobhan_householdIncome_VSproperty_-e1406061502216.png" height="286" width="400" title="" /></a><div class="wp-caption-text" id="caption-attachment-78">Figure 2.5 Housing cost in Vancouver, BC, compared with&nbsp;other cities in Canada (source: Royal Bank of Canada, 2012)</div></div> <p>According to&nbsp;the urban planning think tank Demographia (2014), says Metro Vancouver has the second-highest housing prices in the world.&nbsp;The research compared urban areas with over&nbsp;one million residents in <strong>OECD (<strong class="Bold"><strong>Organisation for Economic Co-operation and Development</strong></strong>)</strong> countries around the world, and&nbsp;Vancouver came out second when income and cost of housing were compared. Blame has been placed on Vancouver’s strong urban containment policies (Hutton, 2004), which are said to&nbsp;have caused the city’s affordability to deteriorate markedly.&nbsp;<span style="background-color: #ffffff; color: #111111;">The average house price in Metro Vancouver is $670,300, which would require 80% of the average median household income to service the mortgage.&nbsp;</span></p> <p><span style="background-color: #ffffff; color: #111111;">Vancouver is seen as a very desirable city to live in, and therefore it comes with a cost. This situation is not limited to Greater Vancouver as the Demographia research shows that&nbsp;Victoria, Kelowna and the Fraser Valley are also some of the most unaffordable places in Canada.<br /> </span></p> <h2>Attributions</h2> <ul><li><strong>Figure 2.5</strong> Housing cost in Vancouver, BC, compared to other cities in Canada by Hilda Aangranni</li> </ul> <p>&nbsp;</p> 
	</div>


	</div>
<div class="chapter standard with-subsections" id="chapter-slug-3-4-summary" title="Summary">
	<div class="chapter-title-wrap">
		<p class="chapter-number">14</p>
		<h1 class="chapter-title">Summary</h1>
								</div>
	<div class="ugc chapter-ugc">
				 <p>The study of economics and growth in Geography is fundamentally about uneven development: a core-periphery global divide, sometimes referred to as the Global South and Global North or Third World and First World.&nbsp;The rich countries, or those located in the Global North/First World, are expected to have higher incomes that&nbsp;provide residents with greater access to better&nbsp;living conditions, health care and education. However, this representation can be misleading as articulated in the case studies. Figure might be&nbsp;telling us about a minority of rich people in a country in the Global South or neglecting very little on poor populations living in the Global North.</p> <p>Economic development is often measured by&nbsp;a country’s gross domestic product (GDP), gross national income (GNI) and purchasing power parity (PPP). For additional economic measurement tools, visit the resource section of this chapter. There are other indicators and tools available to measure standards of living, one of which is&nbsp;the quality-of-life (QOL) survey.</p> 
	</div>


	</div>
<div class="chapter standard with-subsections" id="chapter-slug-3-6-key-terms" title="Key Terms">
	<div class="chapter-title-wrap">
		<p class="chapter-number">15</p>
		<h1 class="chapter-title">Key Terms</h1>
								</div>
	<div class="ugc chapter-ugc">
				 <div class="bcc-box bcc-success"><h3>Key&nbsp; Terms</h3> <p><strong class="Bold">Gross domestic product</strong>&nbsp;(GDP):&nbsp;An estimate of the total value of all materials, foodstuffs, goods and services that a country produces in one year. As GDP is a measure of commodities, the figure for each country is divided by the total population of the country in order to get the&nbsp;per capita<em class="Italic">.</em></p> <p><strong class="Bold">Gross national income</strong>&nbsp;<strong>(GNI):</strong> A measure of the income that flows into a country from production no matter where in the world companies from that country may be operating.</p> <p><strong class="Bold"><strong>Organisation for Economic Co-operation and Development (OECD):&nbsp;</strong></strong>An international economic organization with the mission&nbsp;to promote policies that will improve the economic and social well-being of people around the world.</p> <p><strong>Purchasing power parity</strong>&nbsp;<strong>(PPP):</strong> A&nbsp;tool that&nbsp;calculates&nbsp;how much the local currency of a country can buy locally (i.e., what you can&nbsp;buy with CAD 20&nbsp;Canada compared with&nbsp;its equivalent in Colombia.</p> <p><strong class="Bold">Quality of life (QOL):&nbsp;</strong>A measure of the general&nbsp;well-being&nbsp;of individuals and societies,&nbsp;using&nbsp;the indicators of income, wealth, employment, the built environment, physical and mental health, education, social belonging and leisure time.&nbsp;QOL is used as a measurement in many fields including&nbsp;international development, healthcare, politics and employment.</p> </div> <p>&nbsp;</p> 
	</div>


	</div>
<div class="chapter standard with-subsections" id="chapter-slug-3-5-activities" title="Suggested Activities">
	<div class="chapter-title-wrap">
		<p class="chapter-number">16</p>
		<h1 class="chapter-title">Suggested Activities</h1>
								</div>
	<div class="ugc chapter-ugc">
				 <div class="bcc-box bcc-info"><h3 itemprop="educationalUse">Suggested Activities</h3> <h2>Activity 1</h2> <p>Look at the following images of people living on the streets. Can you identify where in the world the image is from?</p> <div class="wp-caption aligncenter" id="attachment_1289" aria-describedby="caption-attachment-1289" style="width: 500px"><a href="http://opentextbc.ca/geography/wp-content/uploads/sites/34/2014/09/Chpt2Activities.jpg" data-url="http://opentextbc.ca/geography/wp-content/uploads/sites/34/2014/09/Chpt2Activities.jpg"><img src="http://opentextbc.ca/geography/wp-content/uploads/sites/34/2014/09/Chpt2Activities.jpg" alt="Fig 2.6 Homelessness around the world" class="wp-image-1289" height="375" width="500" srcset="https://opentextbc.ca/geography/wp-content/uploads/sites/34/2014/09/Chpt2Activities.jpg 800w, https://opentextbc.ca/geography/wp-content/uploads/sites/34/2014/09/Chpt2Activities-300x225.jpg 300w, https://opentextbc.ca/geography/wp-content/uploads/sites/34/2014/09/Chpt2Activities-65x48.jpg 65w, https://opentextbc.ca/geography/wp-content/uploads/sites/34/2014/09/Chpt2Activities-225x168.jpg 225w, https://opentextbc.ca/geography/wp-content/uploads/sites/34/2014/09/Chpt2Activities-350x262.jpg 350w" sizes="auto, (max-width: 500px) 100vw, 500px" title="" /></a><div class="wp-caption-text" id="caption-attachment-1289">Fig 2.6 Homelessness around the world</div></div> <h2>Activity 2</h2> <p>Watch the video on the quality of life in Williams Lake <span class="footnote"><span class="footnote-indirect" data-fnref="83-1"></span></span> and with a partner highlight some of the best things about living in Williams Lake. Is homelessness present in your area? Are you aware of any policies by the municipal or local government to deal with homelessness? How does your area compare with either Victoria or Williams Lake?</p> <h2>Activity 3</h2> <p>Watch the <a href="a href=" target="_blank" data-url="a href=">short video on the affordability of housing in the Greater Vancouver</a> area.<span class="footnote"><span class="footnote-indirect" data-fnref="83-2"></span></span> What is most shocking about the information provided in the video? Why do you think Vancouver is such an unaffordable place to buy property?</p> <h2>Activity 4</h2> <p>Look at the fact sheet (figure 2.7) about homelessness in Victoria, BC, and discuss with a partner which figure/fact is most shocking to you and why? Can you relate any of these figures to your local area?</p> <div class="wp-caption aligncenter" id="attachment_82" aria-describedby="caption-attachment-82" style="width: 400px"><a href="http://opentextbc.ca/geography/wp-content/uploads/sites/34/2014/06/AttitudesTowardsHomelessnessInGreaterVictoriaSurvey20141-e1406063423334.png" data-url="http://opentextbc.ca/geography/wp-content/uploads/sites/34/2014/06/AttitudesTowardsHomelessnessInGreaterVictoriaSurvey20141-e1406063423334.png"><img class="wp-image-82" alt="Figure 10. Facts on Homelessness in BC by Greater Victoria Coalition to End Homelessness (www.victoriahomelessness.ca)" src="http://opentextbc.ca/geography/wp-content/uploads/sites/34/2014/06/AttitudesTowardsHomelessnessInGreaterVictoriaSurvey20141-e1406063423334.png" height="659" width="400" title="" /></a><div class="wp-caption-text" id="caption-attachment-82">Figure 2.7 Facts on Homelessness in BC by Greater Victoria Coalition to End Homelessness (www.victoriahomelessness.ca)</div></div> <h2>Activity 5</h2> <p>Calculate the cost of living in BC using the co<a href="http://www.costofliving.welcomebc.ca/CostOfLiving.aspx" target="_blank" data-url="http://www.costofliving.welcomebc.ca/CostOfLiving.aspx">st-of-living calculator</a><span class="footnote"><span class="footnote-indirect" data-fnref="83-3"></span></span> and work out the details for the following scenarios:</p> <ol><li>Peter earns CAD 50,000&nbsp;a year and&nbsp;Janice&nbsp;earns CAD 45,000. They have two young children both of whom are in school.</li> <li>Edward earns CAD 150,000 CAD a year and his wife Barbara earns CAD 80,000. Their three children are grown up.</li> <li>Polly earns CAD 45,000&nbsp;a year and is not married; she has&nbsp;one son.</li> </ol> <h2>Activity 6</h2> <p>Imagine that you are Polly, the single parent earning CAD 45,000&nbsp;a year, and you&nbsp;must find assistance with housing. Use the <a href="http://www.bchousing.org/Initiatives/Providing/Subsidized/Types" target="_blank" data-url="http://www.bchousing.org/Initiatives/Providing/Subsidized/Types">BC Housing website</a><span class="footnote"><span class="footnote-indirect" data-fnref="83-4"></span></span> and outline the required steps and procedures you&nbsp;would need to complete in order to receive subsidized housing. Do you&nbsp;qualify? Why or why not?</p> <h2>Activity 7</h2> <p>Relating affordable housing to your context:</p> <ul><li>The Mayor of Vancouver <a href="http://www.mayorofvancouver.ca/tag/housing-affordability" target="_blank" data-url="http://www.mayorofvancouver.ca/tag/housing-affordability">promises affordable housing for all</a>, including students.<span class="footnote"><span class="footnote-indirect" data-fnref="83-5"></span></span> Do you live in student accommodation? Do you have friends who live in off-campus housing? What do you think about the conditions that you and/or your friends are expected to live in? What can be done to change some of these conditions?</li> <li>Interview your parents, a relative or a friend who owns their own home. Ask them when they bought their home and if they know the difference in its value today. Ask them what they think of the cost of housing in BC and what options there are for young people planning to purchase their first home.</li> </ul> <h2>Activity 8</h2> <p>Take action. The <a href="http://victoriahomelessness.ca" target="_blank" data-url="http://victoriahomelessness.ca">Greater Victoria Coalition to End Homelessness</a><span class="footnote"><span class="footnote-indirect" data-fnref="83-6"></span></span> offers many volunteer opportunities that&nbsp;students can engage in. A list of community groups in Williams Lake can be found at&nbsp;<a href="http://www.povnet.org/find-an-advocate/453,73?page=1" target="_blank" data-url="http://www.povnet.org/find-an-advocate/453,73?page=1">Find An Advocate: Williams Lake, Aboriginal and First Nations</a> <span class="footnote"><span class="footnote-indirect" data-fnref="83-7"></span></span>, and <a href="http://sheway.vcn.bc.ca/resources/resources-housing" target="_blank" data-url="http://sheway.vcn.bc.ca/resources/resources-housing">Sheway</a><span class="footnote"><span class="footnote-indirect" data-fnref="83-8"></span></span> provides emergency housing for women and children and offers volunteer opportunities.</p> </div> <h2>Attributions</h2> <ul><li>Figure 2.6 Man sleeping on sidewalk by The Blackbird (<a href="http://en.wikipedia.org/wiki/File:Man_sleeping_on_Canadian_sidewalk.jpg" target="_blank" data-url="http://en.wikipedia.org/wiki/File:Man_sleeping_on_Canadian_sidewalk.jpg">http://en.wikipedia.org/wiki/File:Man_sleeping_on_Canadian_sidewalk.jpg</a>) used under CC BY-SA 2.0 (<a href="http://creativecommons.org/licenses/by-sa/2.0/deed.en" target="_blank" data-url="http://creativecommons.org/licenses/by-sa/2.0/deed.en">http://creativecommons.org/licenses/by-sa/2.0/deed.en</a>) Girl sitting on the street by Steve Evans (<a href="http://en.wikipedia.org/wiki/File:India_poverty.jpg" target="_blank" data-url="http://en.wikipedia.org/wiki/File:India_poverty.jpg">http://en.wikipedia.org/wiki/File:India_poverty.jpg</a>) used under CC-BY 2.0 (<a href="http://creativecommons.org/licenses/by/2.0/deed.en" target="_blank" data-url="http://creativecommons.org/licenses/by/2.0/deed.en">http://creativecommons.org/licenses/by/2.0/deed.en</a>) Street dwellers by Kounosu (<a href="http://en.wikipedia.org/wiki/File:Street_dwellers_in_San%27ya_district_in_Tokyo_Japan.jpg" target="_blank" data-url="http://en.wikipedia.org/wiki/File:Street_dwellers_in_San%27ya_district_in_Tokyo_Japan.jpg">http://en.wikipedia.org/wiki/File:Street_dwellers_in_San%27ya_district_in_Tokyo_Japan.jpg</a>) used under CC BY-SA 3.0&nbsp; (<a href="http://creativecommons.org/licenses/by-sa/3.0/deed.en" target="_blank" data-url="http://creativecommons.org/licenses/by-sa/3.0/deed.en">http://creativecommons.org/licenses/by-sa/3.0/deed.en</a>) Living on empties by Jellymc (<a href="http://www.flickr.com/photos/jellymc/9564981924/in/photostream/" target="_blank" data-url="http://www.flickr.com/photos/jellymc/9564981924/in/photostream/">http://www.flickr.com/photos/jellymc/9564981924/in/photostream/</a>) used under CC-BY 2.0 (<a href="https://creativecommons.org/licenses/by/2.0/" target="_blank" data-url="https://creativecommons.org/licenses/by/2.0/">https://creativecommons.org/licenses/by/2.0/</a>)</li> <li>Figure 2.7 Facts on homelessness in BC by Greater Victoria Coalition to End Homelessness (<a href="http://victoriahomelessness.ca/get-informed/fact-sheets/" target="_blank" data-url="http://victoriahomelessness.ca/get-informed/fact-sheets/">http://victoriahomelessness.ca/get-informed/fact-sheets/</a>) used with permission.</li> </ul> <p>&nbsp;</p> <p>&nbsp;</p> 
	</div>
			
				
				<div class="footnotes"><div id='83-1'>
<p>Quality of Life in Williams Lake video <a href="http://www.elocallink.tv/clients3/can/brcolumbia/williamslake2012/tourplay.php?movie=willabccan_qol_rev3_iwd&amp;spon=qualityo" target="_blank" data-url="http://www.elocallink.tv/clients3/can/brcolumbia/williamslake2012/tourplay.php?movie=willabccan_qol_rev3_iwd&amp;spon=qualityo">http://www.elocallink.tv/clients3/can/brcolumbia/williamslake2012/tourplay.php?movie=willabccan_qol_rev3_iwd&amp;spon=qualityo</a></p>

</div><div id='83-2'>
<p>World’s second least affordable city by Canadian Broadcasting Corporation (CBC) (<a href="http://www.cbc.ca/news/canada/british-columbia/vancouver-s-housing-2nd-least-affordable-in-world-1.2505524" target="_blank" data-url="http://www.cbc.ca/news/canada/british-columbia/vancouver-s-housing-2nd-least-affordable-in-world-1.2505524">http://www.cbc.ca/news/canada/british-columbia/vancouver-s-housing-2nd-least-affordable-in-world-1.2505524</a>)</p>

</div><div id='83-3'>
<p>Cost of Living calculator <a href="http://www.costofliving.welcomebc.ca/CostOfLiving.aspx" target="_blank" data-url="http://www.costofliving.welcomebc.ca/CostOfLiving.aspx">http://www.costofliving.welcomebc.ca/CostOfLiving.aspx</a></p>

</div><div id='83-4'>
<p>BC Housing website <a href="http://www.bchousing.org/Initiatives/Providing/Subsidized/Types" target="_blank" data-url="http://www.bchousing.org/Initiatives/Providing/Subsidized/Types">http://www.bchousing.org/Initiatives/Providing/Subsidized/Types</a></p>

</div><div id='83-5'>
<p>Affordable housing for all, including student <a href="http://www.mayorofvancouver.ca/tag/housing-affordability" target="_blank" data-url="http://www.mayorofvancouver.ca/tag/housing-affordability">http://www.mayorofvancouver.ca/tag/housing-affordability</a></p>

</div><div id='83-6'>
<p>Greater Victoria Coalition to End Homelessness <a href="http://victoriahomelessness.ca" target="_blank" data-url="http://victoriahomelessness.ca">http://victoriahomelessness.ca</a></p>

</div><div id='83-7'>
<p>Find An Advocate: Williams Lake, Aboriginal and First Nations <a href="http://www.povnet.org/find-an-advocate/453,73?page=1" target="_blank" data-url="http://www.povnet.org/find-an-advocate/453,73?page=1">http://www.povnet.org/find-an-advocate/453,73?page=1</a></p>

</div><div id='83-8'>
<p>Sheway <a href="//sheway.vcn.bc.ca/resources/resources-housing/" target="_blank" data-url="//sheway.vcn.bc.ca/resources/resources-housing/"> http://sheway.vcn.bc.ca/resources/resources-housing/</a></p>

</div></div>
	</div>
<div class="chapter standard with-subsections" id="chapter-slug-3-5-references-and-resources" title="References and Resources">
	<div class="chapter-title-wrap">
		<p class="chapter-number">17</p>
		<h1 class="chapter-title">References and Resources</h1>
								</div>
	<div class="ugc chapter-ugc">
				 <h2>References</h2> <p>Census Canada Directory 2011&nbsp;h<a href="denied:ttp://www12.statcan.gc.ca/census-recensement/2011/ref/dict/index-eng.cfm" data-url="ttp://www12.statcan.gc.ca/census-recensement/2011/ref/dict/index-eng.cfm">ttp://www12.statcan.gc.ca/census-recensement/2011/ref/dict/index-eng.cfm</a></p> <p>Demographia 2014 10th Annual Demographia International Housing Affordability Survey 2014, Rating for Metropolitan Markets</p> <p>Gaetz, S. Donaldson, J., Richter, T., &amp; Gulliver, T. (2013). The state of homelessness in Canada 2013. Canadian Alliance to End Homelessness</p> <p>Gregory, D., Johnston, R., Pratt, G. Watts, M.J., and Whatmore, S. 2009&nbsp;<em class="Italic">The Dictionary of Human Geography</em>&nbsp;Malden and Oxford:&nbsp;Wiley-Blackwell</p> <p>Hutton, T.A., 2004. Post-industrialism, Post-modernism and the Reproduction of Vancouver’s Central Area: Retheorising the 21st-century City. Urban Stud 41, 1953–1982. doi:10.1080/0042098042000256332</p> <p>Hulchanski, D.J. 2009. “Homelessness in Canada: Past, Present and Future”. Growing Home: Housing and Homelessness in Canada. Calgary, Alberta: University of Calgary.</p> <p>Knox, P.L. 1975.&nbsp;<em class="Italic">Social well-being: a spatial perspective</em>. Oxford: The Clarendon Press.</p> <p>Mitchell, D. 2003&nbsp;<em class="Italic">The Right to the City: social justice and the fight for public space</em>. New York: Guilford Press</p> <p>Smith, D.M. 1973.&nbsp;<em class="Italic">The geography of social well-being in the United States: an introduction to territoral social indicators</em>. New York: McGraw-Hill.</p> <p>Statistics Canada 2006 <a href="http://www12.statcan.ca/census-recensement/2006/as-sa/97-563/tables-tableaux-notes-eng.cfm" target="_blank" data-url="http://www12.statcan.ca/census-recensement/2006/as-sa/97-563/tables-tableaux-notes-eng.cfm">http://www12.statcan.ca/census-recensement/2006/as-sa/97-563/tables-tableaux-notes-eng.cfm</a></p> <p>Takahashi, L.M., 1996. A decade of understanding homelessness in the USA: from characterization to representation. Prog Hum Geogr 20, 291–310. doi:10.1177/030913259602000301</p> <h2>Resources</h2> <ul><li><a href="http://www.oecdbetterlifeindex.org" target="_blank" data-url="http://www.oecdbetterlifeindex.org">OECD Better Life Index</a></li> <li><a href="http://business.financialpost.com/2013/05/28/canada-housing-oecd/" target="_blank" data-url="http://business.financialpost.com/2013/05/28/canada-housing-oecd/">Canadians best-off in housing, third overall in new OECD quality of life&nbsp;survey (Financial post)</a></li> <li><a href="http://victoriahomelessness.ca/wp-content/uploads/2013/09/GVCEH_ReportHousingSupports_FINAL.pdf" target="_blank" data-url="http://victoriahomelessness.ca/wp-content/uploads/2013/09/GVCEH_ReportHousingSupports_FINAL.pdf">Greater Victoria Report on Housing and Supports 2012/13</a></li> <li><a href="http://www.williamslake.ca/230/Social-Development" target="_blank" data-url="http://www.williamslake.ca/230/Social-Development">Williams Lake Social Development</a></li> <li><a href="http://www.homelesshub.ca/community-profiles/british-columbia/victoria" target="_blank" data-url="http://www.homelesshub.ca/community-profiles/british-columbia/victoria">Homeless Hub: Victoria</a></li> <li><a href="http://www.cid-bdc.ca/sites/default/files/pdf/Williams%20Lake.pdf" target="_blank" data-url="http://www.cid-bdc.ca/sites/default/files/pdf/Williams%20Lake.pdf">Community Snapshot: Williams Lake</a></li> </ul> <p>&nbsp;</p> <p>&nbsp;</p> 
	</div>


	</div>

</div>
<div class="part-wrapper" id="part-chapter-4-wrapper">
    <div class="part  " id="part-chapter-4">
	<div class="part-title-wrap">
		<p class="part-number">III</p>
		<h1 class="part-title">3. Aboriginal Issues in British Columbia</h1>
	</div>
	<div class="ugc part-ugc">
		<div class="bcc-box bcc-highlight"><h3>Learning Objectives</h3> <ul><li>Create a comprehensive historical summary of the Aboriginal titles and treaties.</li> <li>Identify the geographical locations of the BC treaty negotiations.</li> <li>Explain the difference between comprehensive and specific claims.</li> <li>Critically evaluate the role of the residential schools in Canadian nation building.</li> </ul> </div> <p>&nbsp;</p>
	</div>
			
				
	</div>
<div class="chapter standard with-subsections" id="chapter-slug-4-2-introduction" title="Introduction">
	<div class="chapter-title-wrap">
		<p class="chapter-number">18</p>
		<h1 class="chapter-title">Introduction</h1>
								</div>
	<div class="ugc chapter-ugc">
				 <p>Archeological evidence shows that humans have inhabited the area now known as British Columbia (BC) for at least 10,000 to 12,000&nbsp;years. The two most widely recognized routes&nbsp;for the migration of humans into the region are along the coast and through an interior ice-free corridor.</p> <p>The term <strong class="Bold">Aboriginal</strong> refers to the ancestors of these inhabitants and includes the distinct subgroups of Inuit, Métis and First Nations peoples.</p> <p>Pre-contact Aboriginal&nbsp;communities were located throughout BC in&nbsp;three cultural regions identified as&nbsp;the northwest coast, southern Interior, and northern Interior. These three cultural regions had dramatically different ecosystems to which indigenous people&nbsp;adapted.&nbsp;The southern Interior was the most climatically dry, the northern Interior the coldest, and the northwest coast the wettest and richest in terms of animal and plant resources.</p> <p>Although the pre-contact Aboriginal&nbsp;population&nbsp;may have numbered over 300,000,&nbsp;by 1881&nbsp;European&nbsp;settlement had reduced Aboriginal population to an estimated 40,000.&nbsp;In fact, increasing European contact and settlement from the 19th century until present has had a major impact on every&nbsp;aspect&nbsp;of Aboriginal life.</p> <p>The 2011 National Household Survey found that 232,290 people identified&nbsp;as Aboriginal in BC. This represents 16% of the total number of Aboriginal&nbsp;people in Canada (1,400,685) and 5.4% of the entire BC population. The number of people self identifying as Aboriginal has increased significantly&nbsp;since the early 1990s (1996 = 139,655;&nbsp; 2001 = 170,020;&nbsp; 2006 = 196,075; 2011 = 232,290) due to both increases in population and an increasing willingness of people (especially those over 35 and Métis) to identify as Aboriginal.&nbsp;Of the BC Aboriginal population,&nbsp;66.7%&nbsp;identified as&nbsp;First Nations; 29.9% as Métis; and 3.4% as&nbsp;Inuit, multiple Aboriginal identities or Aboriginal identities not included elsewhere (see&nbsp;the table below).&nbsp;The median age of the Aboriginal population in 2011 was 28.9 years, much lower than the&nbsp;42.2 years for the non-Aboriginal population in BC.&nbsp;Most of the Aboriginal population live off reserve, with only 44.2% of the 112,400 First Nations people&nbsp;with <strong class="Bold">registered Indian status </strong>living on reserve.</p> <div class="wp-caption aligncenter" id="attachment_87" aria-describedby="caption-attachment-87" style="width: 800px"><a href="http://opentextbc.ca/geography/wp-content/uploads/sites/34/2014/06/Population_by_Aboriginal_identity_British_Columbia_Canada-e1406064686413.png" data-url="http://opentextbc.ca/geography/wp-content/uploads/sites/34/2014/06/Population_by_Aboriginal_identity_British_Columbia_Canada-e1406064686413.png"><img class="size-full wp-image-87" alt="Figure 1. NHS Focus on Geography Series – British Columbia" src="http://opentextbc.ca/geography/wp-content/uploads/sites/34/2014/06/Population_by_Aboriginal_identity_British_Columbia_Canada-e1406064686413.png" height="417" width="800" title="" /></a><div class="wp-caption-text" id="caption-attachment-87">Table 3.1. NHS Focus on Geography Series – British Columbia</div></div> <p>While the majority of BC Aboriginals self identify as First Nations, the population is exceptionally diverse. For example, it includes&nbsp;203 First Nations and over 30&nbsp;spoken languages. According to the <strong class="Bold">First Peoples Culture Council</strong> (FPCC),&nbsp;over 60% of all First Nations languages are spoken in BC. However, the FPCC&nbsp;estimates that&nbsp;the percentage of fluent speakers of native languages among Aboriginal populations&nbsp;declined to approximately 5.1%&nbsp;in 2010. The <a href="http://maps.fphlcc.ca/" target="_blank" data-url="http://maps.fphlcc.ca/">interactive&nbsp;First Nations Language Map of BC</a> <span class="footnote"><span class="footnote-indirect" data-fnref="88-1"></span></span> shows the historical and contemporary&nbsp;spatial distribution of languages.</p> <p>Despite recent positive trends&nbsp;of&nbsp;health, employment status and educational attainment&nbsp;indicators for BC’s Aboriginal communities, the same indicators reveal that&nbsp;off-reserve Aboriginal&nbsp;people&nbsp;continue&nbsp;to trail non-Aboriginals. As we will see below, the difference in these&nbsp;indicators&nbsp;is inextricably linked to BC’s colonial history of repressing Aboriginal access to traditional resources, Aboriginal political organization and Aboriginal cultural expression. The&nbsp;historic failure to negotiate treaties&nbsp;with First Nations has led to ongoing, contemporary efforts to negotiate a “new relationship”&nbsp;that respects&nbsp;Aboriginal rights and title as defined by the Royal Proclamation of 1763,&nbsp;the Constitution of Canada and legal jurisprudence.</p> <h2>First Contact</h2> <p>European contact with Aboriginal people in BC occurred later than it did in Eastern Canada.&nbsp;Initial contact occurred along coastal BC in 1774 when Spanish explorers sailed north from San Francisco and stopped at Nookta Sound, where they traded with the Mowachaht, part of the Nuu-chah-nulth First Nation. Four years later in 1778, British Captain James Cook stopped in Nootka Sound to repair his ship, staying for the better part of a month, where he initiated trade with the Mowachaht.&nbsp;The motivation for exploration in the region at the time was the fur trade in sea otter pelts, which were highly valued in Europe and many parts of Asia, as well as the establishment of colonial sovereignty over the land.</p> <p>By the early 1800s, overland European explorers in search of beaver pelts, mostly commissioned by the Montreal-based North West Company, made contact with Aboriginal people living in eastern BC. The routes they travelled followed established Aboriginal trade routes, often called “<strong class="Bold">grease trails</strong>,” after the oil produced from oolichan fish, and extending from the coast inland.</p> <p>Conflict over land arose as contact between Aboriginal peoples and settlers increased. In 1858 the Fraser River gold rush drastically increased European and American migration and settlement to BC, with 25,000 to 30,000 people entering the area.&nbsp;The increase of settlers was matched by&nbsp;increased conflict over&nbsp;trespass&nbsp;and land use.&nbsp;Gold mining destroyed natural habitat, especially in freshwater marine environments, which in turn disturbed key food systems on a broader scale.</p> <h2>Attributions</h2> <ul><li><strong>Table 3.1</strong>&nbsp; NHS Focus on Geography Series – British Columbia from Statistics Canada (<a href="http://www12.statcan.gc.ca/nhs-enm/2011/as-sa/fogs-spg/Pages/FOG.cfm?lang=E&amp;level=2&amp;GeoCode=59" target="_blank" data-url="http://www12.statcan.gc.ca/nhs-enm/2011/as-sa/fogs-spg/Pages/FOG.cfm?lang=E&amp;level=2&amp;GeoCode=59">http://www12.statcan.gc.ca/nhs-enm/2011/as-sa/fogs-spg/Pages/FOG.cfm?lang=E&amp;level=2&amp;GeoCode=59</a>) and used under non-commercial government license terms of use <a href="http://www.cic.gc.ca/english/notices.asp#copyright" data-url="http://www.cic.gc.ca/english/notices.asp#copyright">http://www.cic.gc.ca/english/notices.asp#copyright</a></li> </ul> 
	</div>
			
				
				<div class="footnotes"><div id='88-1'>
<p>Interactive First Nations Language Map of BC <a href="http://maps.fphlcc.ca/" target="_blank" data-url="http://maps.fphlcc.ca/">http://maps.fphlcc.ca/</a></p>

</div></div>
	</div>
<div class="chapter standard with-subsections" id="chapter-slug-4-3-territories-natural-resources-and-treaties" title="Territories, Natural Resources and First Treaties">
	<div class="chapter-title-wrap">
		<p class="chapter-number">19</p>
		<h1 class="chapter-title">Territories, Natural Resources and First Treaties</h1>
								</div>
	<div class="ugc chapter-ugc">
				 <p>The <a href="http://laws-lois.justice.gc.ca/eng/CONST/page-15.html#h-38" target="_blank" data-url="http://laws-lois.justice.gc.ca/eng/CONST/page-15.html#h-38"><strong class="Bold">Constitution Act, 1982 </strong></a><span class="footnote"><span class="footnote-indirect" data-fnref="89-1"></span></span> and Canadian court decisions indicate that treaties&nbsp;over land and natural resource use must be negotiated with Aboriginal communities in order to respect Aboriginal title and rights.&nbsp;Yet unlike many of the First Nations in&nbsp;the rest of Canada who&nbsp;have negotiated treaties such as the <a href="http://www.aadnc-aandc.gc.ca/eng/1360948213124/1360948312708" target="_blank" data-url="http://www.aadnc-aandc.gc.ca/eng/1360948213124/1360948312708"><strong class="Bold">Numbered Treaties</strong></a> <span class="footnote"><span class="footnote-indirect" data-fnref="89-2"></span></span> the majority of&nbsp;First Nations in BC have no negotiated treaties. Aboriginal rights and title are thus&nbsp;contentious&nbsp;issues in&nbsp;BC where many&nbsp;lands are sometimes referred to as “unceded territory,” and many&nbsp;seminal constitutional law&nbsp;court cases regarding Aboriginal title and rights have unfolded.</p> <p>Since there were very few historical or modern treaties within BC, the&nbsp;<strong class="Bold"><a href="http://www.bctreaty.net/" target="_blank" data-url="http://www.bctreaty.net/">British Columbia Treaty Process</a> (BCTP) </strong><span class="footnote"><span class="footnote-indirect" data-fnref="89-3"></span></span> began&nbsp;in 1992 involving&nbsp;the provincial government (BC), federal government (Canada), and several First Nations. According to the BC Treaty Commission (2014), a <strong class="Bold">modern treaty</strong> is a negotiated agreement that sets out clearly defined rights and responsibilities of First Nations and the federal and provincial governments over far-reaching matters. These include land ownership, governance, wildlife and environmental management, financial benefits and taxation. A treaty is also a full and formal expression of reconciliation between First Nations and government.</p> <p>In recognition of&nbsp;the need for an orderly framework for negotiation with indigenous communities in 18th century&nbsp;North America, the British Crown issued the <a href="http://indigenousfoundations.arts.ubc.ca/home/government-policy/royal-proclamation-1763.html" target="_blank" data-url="http://indigenousfoundations.arts.ubc.ca/home/government-policy/royal-proclamation-1763.html"><strong class="Bold">Royal Proclamation of 1763</strong></a> <span class="footnote"><span class="footnote-indirect" data-fnref="89-4"></span></span>. Among its several functions, the proclamation&nbsp;affirmed Aboriginal rights and title. For this reason, it&nbsp;is called&nbsp;the <strong class="Bold">Indian Magna Carta</strong> by some scholars. The proclamation is enshrined in the Constitution Act, 1982&nbsp;in Section 25 (of the Canadian Charter of Rights and Freedoms) and has bearing on&nbsp;Section 35, which provides constitutional protection for Aboriginal treaty rights.&nbsp;While the proclamation now forms&nbsp;the basis of many Aboriginal claims to land and resources in Canada, the historical implementation of the proclamation may have undermined the sovereignty of existing indigenous communities.</p> <h2>First Treaties in BC</h2> <p>The first treaties created in BC were established by Sir&nbsp;James Douglas (Vancouver Island governor)&nbsp;as the Hudson’s Bay Company moved it’s fur-trading headquarters in 1849 from Fort Vancouver (present-day Vancouver, Washington, at the mouth of the Columbia River) to Fort Victoria (present-day Victoria, BC), and the Colony of Vancouver Island was established. These treaties are called the <strong class="Bold">Douglas Treaties</strong> and resulted in land purchases&nbsp;covering some 930 square kilometres on Vancouver Island.</p> <p>By 1858,&nbsp;thousands of gold prospectors had arrived in the Fraser Canyon gold rush.&nbsp;The&nbsp;influx and dispersion of population from this gold rush and the&nbsp;Cariboo gold rush (1861) strained government resources, led to the establishment of the Colony of British Columbia (1858), and resulted in several conflicts with and failure to negotiate treaties&nbsp;with Aboriginal populations. The Colony of Vancouver Island was merged into the&nbsp;Colony of British Columbia in 1866, and the Colony of British Columbia then joined the Canadian Confederation in 1871. There were no new treaties signed with BC First Nations until the 1899&nbsp;signing of Treaty 8 by First Nations in the northeast of BC.</p> <p>The historical political lineage described above&nbsp;is important as the BC provincial government has&nbsp;argued in court that&nbsp;the Royal Proclamation of 1763 does&nbsp;not apply to BC as there was no British settlement in BC at the time and&nbsp;that Aboriginal title&nbsp;was extinguished when Canadian Confederation occurred in 1871 (see <a href="http://www.bctreaty.net/files_3/pdf_documents/delgamuukw.pdf" data-url="http://www.bctreaty.net/files_3/pdf_documents/delgamuukw.pdf">Delgamuukw v. British Columbia&nbsp;1997</a>).</p> <p>Attempts to create further treaties and to address Aboriginal title and rights have, until relatively recently,&nbsp;been stymied by laws that made First Nations customs illegal (such as the potlatch) and limited political enfranchisement and legal representation. For example, the 1876 Indian Act not only defined status and non-status Indians, it enforced a particular type of governance model&nbsp;within the band and made it a federal crime to prosecute, raise money or organize to pursue First Nations claims in court. Of significance to Aboriginal land claims, this&nbsp;last limitation on litigation&nbsp;was repealed by the revised 1951 Indian Act.&nbsp;A number of court decisions since the 1970s have&nbsp;provided some clarification of&nbsp;aspects of Aboriginal title and rights and a legal framework for pursuing claims.&nbsp;For example, the cumulative impacts of the Calder (1973), Sparrow (1990) and Delgamuukw (1997) legal decisions have traced the contours of Aboriginal claim making.</p> 
	</div>
			
				
				<div class="footnotes"><div id='89-1'>
<p>Constitution Act, 1982 <a href="http://laws-lois.justice.gc.ca/eng/CONST/page-15.html#h-38" target="_blank" data-url="http://laws-lois.justice.gc.ca/eng/CONST/page-15.html#h-38">http://laws-lois.justice.gc.ca/eng/CONST/page-15.html#h-38</a></p>

</div><div id='89-2'>
<p>Numbered Treaties, <a href="http://www.aadnc-aandc.gc.ca/eng/1360948213124/1360948312708" target="_blank" data-url="http://www.aadnc-aandc.gc.ca/eng/1360948213124/1360948312708">http://www.aadnc-aandc.gc.ca/eng/1360948213124/1360948312708</a></p>

</div><div id='89-3'>
<p>British Columbia Treaty Process <a href="http://www.bctreaty.net" target="_blank" data-url="http://www.bctreaty.net">http://www.bctreaty.net</a></p>

</div><div id='89-4'>
<p>Royal Proclomation of 1763 <a href="http://indigenousfoundations.arts.ubc.ca/home/government-policy/royal-proclamation-1763.html" target="_blank" data-url="http://indigenousfoundations.arts.ubc.ca/home/government-policy/royal-proclamation-1763.html">http://indigenousfoundations.arts.ubc.ca/home/government-policy/royal-proclamation-1763.html</a></p>

</div></div>
	</div>
<div class="chapter standard with-subsections" id="chapter-modern-treaties" title="Modern Treaties and Claims">
	<div class="chapter-title-wrap">
		<p class="chapter-number">20</p>
		<h1 class="chapter-title">Modern Treaties and Claims</h1>
								</div>
	<div class="ugc chapter-ugc">
				 <p>There are two types of claims relevant to treaty making: comprehensive claims and specific claims. Comprehensive claims involve&nbsp;unfinished treaty making in Canada where Aboriginal rights are not covered by past treaties. Specific claims are meant to deal with past grievances of First Nations related to historic treaties or management of&nbsp;First Nations resources.</p> <p>Most modern treaty negotiations in BC occur&nbsp;within&nbsp;the <strong>British Columbia Treaty Process (BCTP)</strong>, although there have been some&nbsp;successful negotiation processes outside of BCTP. The BCTP is a voluntary process, and not all First Nations are interested in participating.</p> <p>In 1999-2000, both the&nbsp;McLeod Lake Indian Band Treaty No. 8 Adhesion and Settlement Agreement&nbsp;and the&nbsp;Nisga’a Final Agreement were ratified and went&nbsp;into effect. The McLeod Lake agreement rectified the exclusion of the McLeod Lake Indian Band from Treaty 8 by transferring&nbsp;19,810 hectares of Crown land to the band. It received unanimous support in the BC Legislature. The Nisga’a agreement was hailed as the BC’s first modern-day land treaty. It is&nbsp;a comprehensive agreement that includes surface and subsurface rights, removal of Indian Act application, cash compensation, agreements around wildlife and&nbsp;fisheries,&nbsp;and self-government provisions.</p> <p>Within the BCTP, 60 First Nations are&nbsp;participating in&nbsp;49 sets of negotiations, representing about two-thirds of all First Nations people in BC. As a process, the BCTP&nbsp;includes the <a href="http://www.bctreaty.net/files/sixstages.php" target="_blank" data-url="http://www.bctreaty.net/files/sixstages.php">six stages</a>&nbsp;<span class="footnote"><span class="footnote-indirect" data-fnref="378-1"></span></span> as outlined in the table.</p> <table class="wikitable" style="background-color: #f9f9f9; border-collapse: collapse; border: 1px solid #aaaaaa; font-family: sans-serif; font-size: 13.6364px; line-height: 20.3636px; margin: 1em 0px;"><caption>Table 3.2 6 Stages of Treaty Negotiations</caption> <tbody><tr><th>Stage Number</th> <th>Stage Name</th> <th>Description</th> <th></th> </tr> <tr><td>Stage 1</td> <td>Statement of Intent to Negotiate</td> <td>A First Nation submits a statement of intent (SOI) stating, among other things, who is claiming, proof that the negotiating party is supported by the community and where the claim will be made.</td> <td></td> </tr> <tr><td>Stage 2</td> <td>Readiness to Negotiate</td> <td>Within 45 days of submitting the SOI the parties must sit down and show that all parties have the will and resources to negotiate a treaty.</td> <td></td> </tr> <tr><td>Stage 3</td> <td>Negotiation of a Framework Agreement</td> <td>This is basically the “table of contents” of a comprehensive treaty. The three parties agree on the subjects to be negotiated and an estimated time frame for Stage 4 agreement-in-principle negotiations.</td> <td></td> </tr> <tr><td>Stage 4</td> <td>Negotiation of an Agreement In Principle</td> <td>The negotiating parties examine in detail the elements outlined in their framework agreement with the goal of solving all the problems and creating a working treaty.</td> <td></td> </tr> <tr><td>Stage 5</td> <td>Negotiation to Finalize a Treaty</td> <td>The treaty for all intents and purposes is finished at this stage, but it&nbsp;has to be approved by all parties of the negotiating team.</td> <td></td> </tr> <tr><td>Stage 6</td> <td>Implementation of the Treaty</td> <td>The final stage: applying and running the First Nation as set out by the treaty.</td> <td></td> </tr> </tbody> </table> <p>As of 2014, a few treaties have been completed, including&nbsp;the Maa-nulth First Nations Treaty&nbsp;and the&nbsp;Tsawwassen First Nation Treaty. Other treaties are pending final ratification by the Canadian government, such as the&nbsp;Tla’amin Nation Treaty and&nbsp;Yale First Nation Treaty.&nbsp; The large majority of First Nations involved in BCTP are in Stage 4.</p> <p>The status of BC treaty negotiations is outlined on <a href="http://www.bctreaty.net/nations/nation_maps/Treaty-Negotiations-in-British-Columbia-Map.pdf" target="_blank" data-url="http://www.bctreaty.net/nations/nation_maps/Treaty-Negotiations-in-British-Columbia-Map.pdf">this map </a><span class="footnote"><span class="footnote-indirect" data-fnref="378-2"></span></span> from the BC Treaty website.</p> 
	</div>
			
				
				<div class="footnotes"><div id='378-1'>
<p>Six stages <a href="http://www.bctreaty.net/files/sixstages.php" target="_blank" data-url="http://www.bctreaty.net/files/sixstages.php">http://www.bctreaty.net/files/sixstages.php</a></p>

</div><div id='378-2'>
<p>Status of BC treaty negotiations (map) <a href="http://www.bctreaty.net/nations/nation_maps/Treaty-Negotiations-in-British-Columbia-Map.pdf" target="_blank" data-url="http://www.bctreaty.net/nations/nation_maps/Treaty-Negotiations-in-British-Columbia-Map.pdf">http://www.bctreaty.net/nations/nation_maps/Treaty-Negotiations-in-British-Columbia-Map.pdf</a></p>

</div></div>
	</div>
<div class="chapter standard with-subsections" id="chapter-slug-4-4-case-study" title="Case Study 1: The Indian Residential School System">
	<div class="chapter-title-wrap">
		<p class="chapter-number">21</p>
		<h1 class="chapter-title">Case Study 1: The Indian Residential School System</h1>
								</div>
	<div class="ugc chapter-ugc">
				 <p>The Indian residential school system was created by the Canadian government in the mid-1880s and ran until the last school was shut in 1996.&nbsp;The goal of the residential school system was to educate and assimilate Aboriginal children into Christian, Euro-Canadian cultural norms and knowledge bases. <strong class="Bold">Assimilation </strong>is a process of social integration that requires adopting, by choice or necessity, the ways of a different and often hegemonic culture or society. The majority of the schools were federally funded and run by various Christian churches. From 1920 to 1948, attendance was compulsory for&nbsp;Aboriginal children between the ages of four and 16. There were 139 federally funded Indian residential schools in Canada, 18 of which were in&nbsp;BC.</p> <div class="wp-caption aligncenter" id="attachment_90" aria-describedby="caption-attachment-90" style="width: 400px"><a href="http://opentextbc.ca/geography/wp-content/uploads/sites/34/2014/06/Cristine_residentialSchoolOfCanada-03-e1406065344518.png" data-url="http://opentextbc.ca/geography/wp-content/uploads/sites/34/2014/06/Cristine_residentialSchoolOfCanada-03-e1406065344518.png"><img class="wp-image-90" alt="Figure 2. Locations of Residential Schools" src="http://opentextbc.ca/geography/wp-content/uploads/sites/34/2014/06/Cristine_residentialSchoolOfCanada-03-e1406065344518.png" height="367" width="400" title="" /></a><div class="wp-caption-text" id="caption-attachment-90">Figure 3.1. Locations of residential schools (license: CC-BY-NC-ND 4.0 http://creativecommons.org/licenses/by-nc-nd/4.0/)</div></div> <p>Most of the schools were located off of reserve land, and forced the separation of children from their families, their communities and their land over long periods of time. In the residential schools, siblings were often separated to help break traditional habits, and by extension, family ties. Under the auspices of assimilation, speaking native languages was forbidden, even outside of the classroom, as&nbsp;was traditional clothing, food and other culturally specific habits or traditions. The&nbsp;children were punished if these rules were broken. As a result of this severe restriction of culture and heritage, many language skills and traditional knowledge was lost.</p> <p>Systematic physical, sexual and psychological abuse was widespread within the residential school system, as the testimonies of many residential school survivors have made clear.&nbsp;Poor&nbsp;nutritional standards and&nbsp;medical care&nbsp;contributed to a high mortality rate among children at residential schools. In fact, some schools had up to a 50% mortality rate.&nbsp;Many died of tuberculosis, pneumonia and malnutrition.&nbsp;The education in the schools was considered sub-par:&nbsp;despite the attempt to extinguish native languages in favour of English and French, literacy was not a primary goal of education in the schools, and students often only received up to a Grade 5 level of literacy skills.&nbsp;Instead, labour skills training was the main focus, including sewing and laundry work for women, and farming and carpentry for men.</p> <h2>Systematic Assimilation</h2> <p>The systematic assimilation and forced movement of Aboriginal children off their land and away from their families is considered to be a form of <strong class="Bold">cultural genocide. </strong>This process did more than just destroy ties to culture and land; the forced separation of Aboriginal children also left them without nurturing families, or the knowledge and skills to interact with and raise their own families. Consequently, the residential school system had far-reaching health, social and migratory effects. The high suicide rate among Aboriginal men for example, is attributed in part to the abuses that many people suffered in the residential school system. The forced and&nbsp;violent assimilation processes created a mistrust among social groups and perpetuated the fault lines between Aboriginal and non-Aboriginal people&nbsp;that exist throughout Canada.</p> <p>The last residential school to operate in BC was the Christie (Kakawis) Indian residential school on Meares Island.&nbsp;It was run from 1900 until 1983 by the Roman Catholic Church.&nbsp;It averaged about 44 students at any one time, with most being from Ahousaht, Opitsat, Hesquiat, Nootka, Kyuquot, and the west coast of Vancouver&nbsp;Island.</p> <div class="wp-caption aligncenter" id="attachment_648" aria-describedby="caption-attachment-648" style="width: 400px"><a href="http://opentextbc.ca/geography/wp-content/uploads/sites/34/2014/07/kakawis.jpg" data-url="http://opentextbc.ca/geography/wp-content/uploads/sites/34/2014/07/kakawis.jpg"><img class="wp-image-648" alt="Figure 3. Christie (Kakawis) Indian Residential School on Meares Island" src="http://opentextbc.ca/geography/wp-content/uploads/sites/34/2014/07/kakawis.jpg" height="314" width="400" srcset="https://opentextbc.ca/geography/wp-content/uploads/sites/34/2014/07/kakawis.jpg 800w, https://opentextbc.ca/geography/wp-content/uploads/sites/34/2014/07/kakawis-300x235.jpg 300w, https://opentextbc.ca/geography/wp-content/uploads/sites/34/2014/07/kakawis-65x50.jpg 65w, https://opentextbc.ca/geography/wp-content/uploads/sites/34/2014/07/kakawis-225x176.jpg 225w, https://opentextbc.ca/geography/wp-content/uploads/sites/34/2014/07/kakawis-350x274.jpg 350w" sizes="auto, (max-width: 400px) 100vw, 400px" title="" /></a><div class="wp-caption-text" id="caption-attachment-648">Figure 3.2 Christie (Kakawis) Indian residential school on Meares Island. CC-BY-NC-ND 4.0</div></div> <p>St. Joseph’s Mission in Williams Lake, another BC residential school,&nbsp;operated from 1890 to&nbsp;1981, and&nbsp;at its busiest&nbsp;in the 1950s it had roughly 300 students coming from the surrounding Shuswap region.&nbsp;Unlike at the Christie school, parental visits were not allowed during the school year, and students were only allowed to return home for one month of the year.&nbsp;Over the course of the 1990s and 2000s, 23 charges of sexual assault were brought forward from former students against three individuals who had worked&nbsp;at the school.</p> <h2>Statement of Reconciliation</h2> <p>By&nbsp;the 1950s, the Canadian government could no longer deny that the Indian residential school system was detrimental to individuals and society more broadly. With reducing enrollments&nbsp;the schools began to be closed down, but&nbsp;it wasn’t until 1996 that the last residential school closed. In 1986, the United Church of Canada issued a formal apology for their participation in the system, followed in 1993 and 1994&nbsp;by apologies from the Anglican and Presbyterian Churches of Canada.&nbsp;By this time many cases of abuse had been brought forward in the court systems across Canada. In 1998, the&nbsp;Government of Canada issued a Statement of Reconciliation, and the&nbsp;<strong>Aboriginal Healing Foundation</strong> was established.</p> <p>Between 1998 and&nbsp;2005, many former students of residential schools brought forward a class action lawsuit against the Government of Canada asking for compensation for the abuses endured during the schools’ tenure. &nbsp;A settlement was reached in 2005 that set out a $1.9 billion compensation package and established the <strong>Truth and Reconciliation Commission</strong>. <span style="background-color: #ffffff;">In 2007, the settlement packaged was finalized, and in </span>2008 the government finally issued an official apology for the residential school system. Of the almost $2 billion settlement, individual survivors could claim $10,000 for the first year of their attendance at a residential school, and up to $3,000 for each year of attendance afterward.&nbsp;However, it was deemed essential that the Aboriginals not only be compensated financially, but&nbsp;also have the&nbsp;full extent of the damage done be acknowledged within Canadian society,&nbsp;and to begin the processes of reconciliation and healing.</p> <h2>Truth and Reconciliation Commission</h2> <p>What does “reconciliation” mean and for whom?&nbsp;How can reconciliation&nbsp;have multiple meanings and&nbsp;what is being reconciled? These questions arise when we consider the role of the Truth and Reconciliation Commission in the ongoing history and legacy of the residential school system.&nbsp;Officially, the <a href="http://www.trc.ca/websites/trcinstitution/index.php?p=7#Principles" target="_blank" data-url="http://www.trc.ca/websites/trcinstitution/index.php?p=7#Principles">introduction of the Truth and Reconciliation Mandate</a> <span class="footnote"><span class="footnote-indirect" data-fnref="92-1"></span></span> states:</p> <blockquote><p>The truth telling and reconciliation process as part of an overall holistic and comprehensive response to the Indian Residential School legacy is a sincere indication and acknowledgement of the injustices and harms experienced by Aboriginal people and the need for continued healing. This is a profound commitment to establishing new relationships embedded in mutual recognition and respect that will forge a brighter future. The truth of our common experiences will help set our spirits free and pave the way to reconciliation.</p></blockquote> <p>To that end, the Truth and Reconciliation Commission has sponsored many events across Canada. Its goal is to prepare a comprehensive historical record, including hearing and documenting the truths of former residential school students, their families&nbsp;and communities. The commission sees the process of truth gathering as an essential part of ongoing reconciliation and healing. It is important to remember that reconciliation is an individual as well as a collective process. The Truth and Reconciliation Commission is a product of the Canadian government, and some contend that as long as&nbsp;there is ongoing oppression and systematic inequality of Aboriginal people, the reconciliation process cannot be completed. Along this line, it is important to think about how the commission is&nbsp;part of <em>both</em> an ongoing process of healing and an ongoing process of colonialism.</p> <h2>Attributions</h2> <ul><li><strong>Figure 3.1</strong> Derived from residential school locations&nbsp;<a href="//www.trc.ca/websites/trcinstitution/index.php?p=12" target="_blank" data-url="//www.trc.ca/websites/trcinstitution/index.php?p=12">(http://www.trc.ca/websites/trcinstitution/index.php?p=12</a>)&nbsp;by Truth and Reconciliation (<a href="http://www.trc.ca/websites/trcinstitution/index.php?p=3" target="_blank" data-url="http://www.trc.ca/websites/trcinstitution/index.php?p=3">http://www.trc.ca/websites/trcinstitution/index.php?p=3</a>). Image license: CC BY-NC-ND 4.0 (<a href="http://creativecommons.org/licenses/by-nc-nd/4.0/" target="_blank" data-url="http://creativecommons.org/licenses/by-nc-nd/4.0/">http://creativecommons.org/licenses/by-nc-nd/4.0/</a>)</li> <li><strong>Figure 3.2</strong> Christie (Kakawis) Indian residential School on Mears Island (<a href="http://irsr.ca/photogallery/?wppa-album=20&amp;wppa-cover=0&amp;wppa-occur=1&amp;wppa-photo=158" target="_blank" data-url="http://irsr.ca/photogallery/?wppa-album=20&amp;wppa-cover=0&amp;wppa-occur=1&amp;wppa-photo=158">http://irsr.ca/photogallery/?wppa-album=20&amp;wppa-cover=0&amp;wppa-occur=1&amp;wppa-photo=158</a>) CC-BY-NC-ND 4.0 (<a href="http://creativecommons.org/licenses/by-nc-nd/4.0/" target="_blank" data-url="http://creativecommons.org/licenses/by-nc-nd/4.0/">http://creativecommons.org/licenses/by-nc-nd/4.0/</a>) and used with permission from Indian Residential School Resources (<a href="http://irsr.ca/" target="_blank" data-url="http://irsr.ca/">http://irsr.ca/</a>).</li> </ul> 
	</div>
			
				
				<div class="footnotes"><div id='92-1'>
<p>Introduction to the Truth and Reconciliation Mandate <a href="http://www.trc.ca/websites/trcinstitution/index.php?p=7#Principles" target="_blank" data-url="http://www.trc.ca/websites/trcinstitution/index.php?p=7#Principles">http://www.trc.ca/websites/trcinstitution/index.php?p=7#Principles</a></p>

</div></div>
	</div>
<div class="chapter standard with-subsections" id="chapter-slug-4-5-summary" title="Summary">
	<div class="chapter-title-wrap">
		<p class="chapter-number">22</p>
		<h1 class="chapter-title">Summary</h1>
								</div>
	<div class="ugc chapter-ugc">
				 <p>The area now known as British Columbia (BC) has been inhabited for at least 10,000 to 12,000&nbsp;years. The term “Aboriginal” refers to the ancestors of those inhabitants and&nbsp; includes the distinct subgroups of Inuit, Métis and First Nations peoples. Precontact Aboriginal&nbsp;communities were located throughout BC in&nbsp;three cultural regions identified as&nbsp;the northwest coast, southern Interior and northern Interior.</p> <p>Prior to 1881, the pre-contact Aboriginal population numbered over 300,000. However with the establishment of the European settlement in 1881 the Aboriginal population numbers were reduced to an estimated 40,000.&nbsp;In fact, increasing European contact and settlement from the 19th century until present day has had a major impact on every&nbsp;aspect&nbsp;of Aboriginal life, which is articulated in the case study on the Indian residential school system.</p> <p>In 1858 the Fraser River gold rush drastically increased European and American migration and settlement to BC, with 25,000 to 30,000 people entering the area.&nbsp;The increase of settlers in the area caused&nbsp;conflict over&nbsp;trespass&nbsp;and land use.&nbsp;Gold mining destroyed natural habitat, especially in freshwater marine environments, which in turn disturbed key food systems on a broader scale.</p> <p>Unlike much of the rest of Canada, the majority of&nbsp;First Nations in BC have no negotiated treaties. The first treaties created in BC were established by Sir&nbsp;James Douglas (Vancouver Island governor)&nbsp;as the Hudson’s Bay Company moved its fur trading headquarters from Fort Vancouver (present-day Vancouver, Washington, at the mouth of the Columbia River) to Fort Victoria (present-day Victoria, BC). These treaties are called the Douglas Treaties and resulted in land purchases&nbsp;covering some 930 square kilometres on Vancouver Island.</p> <p>Attempts to create further treaties and to address Aboriginal title and rights have until relatively recently&nbsp;been stymied by laws that made First Nations customs illegal (such as the potlatch) and limited political enfranchisement and legal representation. The <strong class="Bold">Nisga’a agreement </strong>was hailed as BC’s first modern-day land treaty. It is&nbsp;a comprehensive agreement that includes surface and subsurface rights, removal of Indian Act application, cash compensation, agreements around wildlife and&nbsp;fisheries&nbsp;and self-government providisons. As of 2014, a few treaties have been completed, including&nbsp;the Maa-nulth First Nations Treaty&nbsp;and the&nbsp;Tsawwassen First Nation Treaty. Other treaties are pending final ratification by the Canadian government, such as the&nbsp;Tla’amin Nation Treaty and&nbsp;Yale First Nation Treaty.</p> 
	</div>


	</div>
<div class="chapter standard with-subsections" id="chapter-slug-4-8-key-terms" title="Key Terms">
	<div class="chapter-title-wrap">
		<p class="chapter-number">23</p>
		<h1 class="chapter-title">Key Terms</h1>
								</div>
	<div class="ugc chapter-ugc">
				 <div class="bcc-box bcc-success"><h3>Key Terms</h3> <p><strong class="Bold">Aboriginal:</strong> people who inhabited the land before the arrival of colonists.&nbsp;Includes the distinct subgroups of Inuit, Métis and First Nations peoples.</p> <p><strong>Aboriginal Healing Foundation:</strong>&nbsp; An Aboriginal-managed, national, Ottawa-based, not-for-profit private corporation established March 31, 1998,which was&nbsp;provided with a one-time grant of $350 million by the federal government as part of Gathering Strength — Canada’s Aboriginal Action Plan. The Aboriginal Healing Foundation was given an 11-year mandate, ending March 31, 2009, to encourage and support, through research and funding contributions, community-based Aboriginal-directed healing initiatives that&nbsp;addressed the legacy of physical and sexual abuse suffered in Canada’s Indian residential schools, including intergenerational impacts.</p> <p><strong>Assimilation:&nbsp;</strong>A process of social integration that requires adopting, by choice or necessity, the ways of a different and often hegemonic culture or society.</p> <p><strong class="Bold">British Columbia Treaty Process (BCTP):&nbsp;</strong>A land claims negotiation process started in 1993 to resolve outstanding issues,&nbsp;including claims to unextinguished Aboriginal rights,&nbsp;with British Columbia’s First Nations.</p> <p><strong class="Bold">Constitution Act, 1982&nbsp;</strong><strong>Section 35:&nbsp;</strong>The section of the Canadian Constitution that &nbsp;“recognizes and affirms” the existing Aboriginal and treaty rights in Canada. These rights protect the activities, practice or traditions that are integral to the distinct cultures of Aboriginal peoples. The treaty rights protect and enforce agreements between the Crown and the Aboriginal peoples. Section 35 also provides protection of Aboriginal title over&nbsp;the use of land for traditional practices. These rights extend to Indian, Inuit and Métis people.</p> <p><span itemscope="itemscope" itemtype="http://schema.org/WebPage" itemref="about copyrightHolder copyrightYear inLanguage publisher"><strong class="Bold">Cultural genocide </strong>is the process of undermining, suppressing and ultimately eliminating native cultures (<a target="_blank" href="http://sociologyindex.com/cultural_genocide.htm" data-url="http://sociologyindex.com/cultural_genocide.htm">Sociology Index</a>).<strong class="Bold"><br /> </strong></span></p> <p><strong class="Bold">Douglas Treaties: </strong>Also known as the Vancouver Island Treaties or the Fort Victoria Treaties, a series of treaties signed between certain indigenous groups on Vancouver Island and the Colony of Vancouver Island.</p> <p><strong class="Bold">First Peoples Culture Council:&nbsp;</strong>A First Nations-run Crown corporation with a mandate to support the revitalization of Aboriginal language, arts and culture in British Columbia. It&nbsp;provides funding and resources to communities, monitors the status of First Nations languages and develops policy recommendations for First Nations leadership and government.</p> <p><strong class="Bold">Grease trails</strong>: Aboriginal trade routes&nbsp;named after the oil produced from oolichan fish and extending from the coast inland.</p> <p><span itemscope="itemscope" itemtype="http://schema.org/WebPage" itemref="about copyrightHolder copyrightYear inLanguage publisher"><strong class="Bold">Indian Magna Carta</strong></span> Another term used by some scholars for the Royal Proclamation of 1763.</p> <p><strong class="Bold">Modern treaty:</strong>&nbsp; A negotiated agreement that sets out clearly defined rights and responsibilities of First Nations and the federal and provincial governments over far-reaching matters.</p> <p><strong class="Bold">Nisga’a agreement:&nbsp;</strong> BC’s first modern-day land treaty. It is&nbsp;a comprehensive agreement that includes surface and subsurface rights, removal of Indian Act application, cash compensation, agreements around wildlife and&nbsp;fisheries&nbsp;and self-government provision.</p> <p><strong class="Bold">Numbered treaties:</strong>&nbsp;A series of 11 treaties signed between the Aboriginal peoples in Canada and the reigning monarch of Canada (Victoria, Edward VII or George V) from 1871 to 1921.</p> <p><strong>Registered Indian Status:</strong> Under the Indian Act, means&nbsp;being&nbsp;eligible&nbsp;for Indian status (i.e., registered Indians). The Indian Register is the official record identifying all Status Indians in Canada. <a href="https://www.aadnc-aandc.gc.ca/eng/1100100032472/1100100032473" target="_blank" data-url="https://www.aadnc-aandc.gc.ca/eng/1100100032472/1100100032473">https://www.aadnc-aandc.gc.ca/eng/1100100032472/1100100032473</a></p> <p><strong class="Bold">Royal Proclamation of 1763</strong>: A&nbsp;proclamation&nbsp;that affirmed Aboriginal rights and title. Sometimes referred to as the&nbsp;<strong class="Bold">Indian Magna Carta</strong>. The proclamation is enshrined in the Constitution Act, 1982&nbsp;in Section 25 (of the Canadian Charter of Rights and Freedoms) and has bearing on&nbsp;Section 35 which provides constitutional protection for Aboriginal treaty rights.&nbsp;While the proclamation now forms&nbsp;the basis of many Aboriginal claims to land and resources in Canada, the historical implementation of the proclamation may have undermined the sovereignty of existing indigenous communities.<span><br /> </span><br /> <strong>Truth and Reconciliation Commission:</strong>&nbsp;A Commission organized by the federal government and Aboriginal people with a mandate to learn the truth about what happened in the residential schools and to inform all Canadians of those findings.&nbsp;The Commission will rely on records held by those who operated and funded the schools, testimony from officials of the institutions that operated the schools and experiences reported by survivors, their families, communities and anyone personally affected by the residential school experience and its subsequent impacts.</p> </div> <p>&nbsp;</p> 
	</div>


	</div>
<div class="chapter standard with-subsections" id="chapter-slug-4-6-activities" title="Suggested Activities">
	<div class="chapter-title-wrap">
		<p class="chapter-number">24</p>
		<h1 class="chapter-title">Suggested Activities</h1>
								</div>
	<div class="ugc chapter-ugc">
				 <div class="bcc-box bcc-info"><h3>Suggested Activities</h3> <h2>Activity 1</h2> <p>Watch the documentary&nbsp;<em class="Italic">The Fallen Feather:&nbsp;Indian Industrial Residential Schools and Canadian Confederation.</em>&nbsp;Write a critical reflection on the role of the residential schools in Canadian nation building.</p> <h2>Activity 2</h2> <p>Choose one known&nbsp;sacred place in your region&nbsp;and make a presentation on&nbsp;why this place is sacred, how it is being protected or what steps might be done to better protect it.</p> <h2>Activity 3</h2> <p>Choose one of the ongoing treaty negotiations. Create a presentation that summarizes the historical claim, the process leading to negotiation and the status of negotiations.</p> <h2>Activity 4</h2> <p>Volunteer with an organization that advocates for or go to an event that is about the experiences of Aboriginal communities. Write a critical reflection that analyzes the educational value of your experience, outlines the major things you learned and proposes ways to improve,&nbsp;contribute or share the experience.</p> <h2>Activity 5</h2> <p>Complete the following case study: <a href="http://ubcfarm.ubc.ca/case-studies/ethnobotany-case-study/" data-url="http://ubcfarm.ubc.ca/case-studies/ethnobotany-case-study/">Ethnobotany</a>. This case study aims to explore respectful ways to learn about and engage with traditional knowledge about plants found on the UBC campus, and the historical and contemporary relationships that occur between plants and people.</p> <h2>Activity 6</h2> <p>Complete the following case study: <a href="http://ubcfarm.ubc.ca/case-studies/indigenous-food-sovereignty/" data-url="http://ubcfarm.ubc.ca/case-studies/indigenous-food-sovereignty/">Indigenous Food Sovereignty</a>&nbsp;This case study examines issues related to Indigenous food sovereignty in the context of the UBC campus – including the colonialization and transformation of traditional regional food systems, land rights and access, and pathways to decolonizing research and relationships.</p> </div> <p>&nbsp;</p> 
	</div>


	</div>
<div class="chapter standard with-subsections" id="chapter-slug-4-7-references-and-resources" title="References and Resources">
	<div class="chapter-title-wrap">
		<p class="chapter-number">25</p>
		<h1 class="chapter-title">References and Resources</h1>
								</div>
	<div class="ugc chapter-ugc">
				 <h2>References</h2> <p>BC Treaty Commission, n.d. Frequently Asked Questions [WWW Document]. URL <a href="http://www.bctreaty.net/files/faqs.php" data-url="http://www.bctreaty.net/files/faqs.php">http://www.bctreaty.net/files/faqs.php</a> (accessed 8.27.14).</p> <p>Government of Canada, S.C., 2013. British Columbia – Focus on Geography Series – 2011 National Household Survey (NHS) [WWW Document]. URL <a href="http://www12.statcan.gc.ca/nhs-enm/2011/as-sa/fogs-spg/Pages/FOG.cfm?lang=E&amp;level=2&amp;GeoCode=59" target="_blank" data-url="http://www12.statcan.gc.ca/nhs-enm/2011/as-sa/fogs-spg/Pages/FOG.cfm?lang=E&amp;level=2&amp;GeoCode=59">http://www12.statcan.gc.ca/nhs-enm/2011/as-sa/fogs-spg/Pages/FOG.cfm?lang=E&amp;level=2&amp;GeoCode=59</a> (accessed 7.22.14).</p> <p>Hirsch, M. (2003). Trading across time and space: Culture along the North American “Grease Trails” from a European perspective.<em class="Italic">&nbsp;Canadian Studies International Interdisciplinary Conference:&nbsp;Across Time &amp; Space Visions of Canada from Abroad.&nbsp;</em>University College of the Cariboo, Kamloops, Sept 12-14, 2003. Access:&nbsp;<a target="_blank" href="http://www.centerfortraditionalmedicine.org/uploads/2/3/7/5/23750643/oolichan.paper.mirjam.pdf" data-url="http://www.centerfortraditionalmedicine.org/uploads/2/3/7/5/23750643/oolichan.paper.mirjam.pdf">http://www.centerfortraditionalmedicine.org/uploads/2/3/7/5/23750643/oolichan.paper.mirjam.pdf</a></p> <p>Indian Residential School Resources <a target="_blank" href="http://irsr.ca" data-url="http://irsr.ca">http://irsr.ca</a> Date Accessed 11 June 2014</p> <p>Rice, Brian and Snyder, Anna. (ND) &nbsp;Reconciliation in the Context of a Settler Society: Healing the Legacy of Colonialism in Canada. Accessed:&nbsp;<a target="_blank" href="http://speakingmytruth.ca/?page_id=686" data-url="http://speakingmytruth.ca/?page_id=686">http://speakingmytruth.ca/?page_id=686</a> on 11 June 2014.</p> <h2>Resources</h2> <ul><li><a href="http://maps.fphlcc.ca" data-url="http://maps.fphlcc.ca">First People’s Language Map</a></li> <li><a href="http://indigenousfoundations.arts.ubc.ca/home.html" data-url="http://indigenousfoundations.arts.ubc.ca/home.html">Indigenous Foundations </a></li> <li><a href="http://irsr.ca" data-url="http://irsr.ca">Indian Residential School Resources </a></li> <li><a href="http://www.bcstats.gov.bc.ca/StatisticsBySubject/AboriginalPeoples/ExternalLinks.aspx" target="_blank" data-url="http://www.bcstats.gov.bc.ca/StatisticsBySubject/AboriginalPeoples/ExternalLinks.aspx">BC Stats: External Links</a></li> <li><a href="http://www.bcstats.gov.bc.ca/StatisticsBySubject/AboriginalPeoples.aspx" target="_blank" data-url="http://www.bcstats.gov.bc.ca/StatisticsBySubject/AboriginalPeoples.aspx">BC Government: Aboriginal Peoples of BC</a></li> <li><a href="http://www12.statcan.gc.ca/nhs-enm/2011/as-sa/fogs-spg/Pages/FOG.cfm?lang=E&amp;level=2&amp;GeoCode=59" target="_blank" data-url="http://www12.statcan.gc.ca/nhs-enm/2011/as-sa/fogs-spg/Pages/FOG.cfm?lang=E&amp;level=2&amp;GeoCode=59">NHS Focus on Geography Series: BC</a></li> <li><a href="http://www.fpcc.ca" target="_blank" data-url="http://www.fpcc.ca">First Peoples’ Cultural Council</a></li> </ul> 
	</div>


	</div>

</div>
<div class="part-wrapper" id="part-chapter-5-wrapper">
    <div class="part  " id="part-chapter-5">
	<div class="part-title-wrap">
		<p class="part-number">IV</p>
		<h1 class="part-title">4. Resources in British Columbia</h1>
	</div>
	<div class="ugc part-ugc">
		<div class="bcc-box bcc-highlight"><h3>Learning Objectives</h3> <ul><li>Discuss the difference between biological substances and natural resources.</li> <li>Discuss British Columbia (BC) richness in resources and link to the economy.</li> <li>Assess the link between resource extraction, land and economy since the 1800s.</li> <li>Debate the&nbsp;social and environmental costs associated with mining.</li> <li>Appraise the future prospects for the relationship between Aboriginal people, non-Aboriginal people and the use of land.</li> </ul> </div> <p>&nbsp;</p>
	</div>
			
				
	</div>
<div class="chapter standard with-subsections" id="chapter-slug-5-2-introduction" title="Introduction">
	<div class="chapter-title-wrap">
		<p class="chapter-number">26</p>
		<h1 class="chapter-title">Introduction</h1>
								</div>
	<div class="ugc chapter-ugc">
				 <p>Although all living organisms require biological resources (<span style="background-color: #ffffff; color: #252525;">such as food, water or shelter), it is the human&nbsp;perspective of a&nbsp;</span>natural resource<span style="background-color: #ffffff; color: #252525;">&nbsp;as anything obtained from the&nbsp;</span>environment<span style="background-color: #ffffff; color: #252525;">&nbsp;to satisfy human needs and wants that gives&nbsp;the term&nbsp;its importance in the context of Geography. </span></p> <p><span style="background-color: #ffffff; color: #252525;">British Columbia is rich in natural resources including l</span>umber, copper, coal, natural gas, oil, zinc, gold, silver, nickel, iron and fish. As resource extraction is directly linked to land use and territory, what does this mean for&nbsp;issues of ownership for First Nations communities, and for the sustainability of the environment for BC residents more broadly?</p> <p>The focus of this chapter is on contemporary extraction resource industries and their impact.</p> 
	</div>


	</div>
<div class="chapter standard with-subsections" id="chapter-what-are-resources" title="What are Resources?">
	<div class="chapter-title-wrap">
		<p class="chapter-number">27</p>
		<h1 class="chapter-title">What are Resources?</h1>
								</div>
	<div class="ugc chapter-ugc">
				 <div class="entry-content"><p>Traditionally a resource was defined as a product of biological, ecological or geological processes (natural resources) that&nbsp;satisfies human wants. Resources are&nbsp;part of an ecosystem and one where it is important to maintain biodiversity and the Earth’s life-support systems (Costanzia et al., 1997). In more modern times the concept&nbsp;resources has come to refer to&nbsp;processes of capitalism and specifically to notions of development and state formation (Gregory et al., 2009).</p> <p>Resources are now in the hands of governments or powerful corporations and the&nbsp;manner in which these resources are managed affects all humans as well as&nbsp;the physical environment.</p> <h2>Economic vs Ecological Views</h2> <p><span style="background-color: #ffffff; color: #252525;">There are three fundamental differences between economic and ecological views on resources:</span></p> <ol><li><span style="background-color: #ffffff; color: #252525;">An economic resource is human-centred </span><span style="background-color: #ffffff; color: #252525;">and the ecological resource definition is nature-centred.</span></li> <li><span style="background-color: #ffffff; color: #252525;">An economic view includes desire along with necessity, whereas the biological view is about basic biological needs.</span></li> <li><span style="background-color: #ffffff; color: #252525;">Economic systems are based on markets of currency exchanged for goods and services, whereas biological systems are based on natural processes of growth, maintenance and reproduction.</span></li> </ol> <p>Natural resources therefore need be differentiated from human-made resources, such as money, factories, information, labour and computers. Many humans use natural resources without considering the broader consequences of their use. For example every time you get in a car and drive you are using oil that&nbsp;pollutes the atmosphere through the exhaust gases released. When we turn on our gas central heating in the winter we are adding to the level of CO2 in the atmosphere.&nbsp;Consider also how oil and gas have a role in international economic and political relations. What is the role of Saudi Arabia or Qatar given the world’s wider dependence on their oil and gas?</p> <p>Any substance found in Earth’s biosphere is simply another part of nature and is&nbsp;of no importance or value economically — that is, until society has a use for it.</p> <h2>When does a substance become a natural resource?</h2> <ol><li>When cultural value is given to the substance, as&nbsp;people desire and accept the use of&nbsp;the natural resource. Think of the cultural value and importance for people in BC to own and drive their own car. Do you own a car? Would you like to own a car?</li> <li>When it benefits technology and&nbsp;a society is able to process or extract the natural resource for use. Did you know that the original cars by Henry Ford were designed to run on batteries but when the technology to process petroleum was invented it quickly became a much cheaper alternative.</li> <li>When it benefits the economic system and&nbsp;a society can affect or define the price and availability of a natural resource. For example, corporations are now “fracking” (hydraulic fracturing) in&nbsp;the tar sands of Alberta as they have the money to do so. In contrast, consider conditions in some Global South countries where power cuts are common <span style="background-color: #ffffff; color: #222222;">occurrences because&nbsp;</span>the government cannot afford to pay suppliers for the necessary&nbsp;oil.</li> </ol> </div> 
	</div>


	</div>
<div class="chapter standard with-subsections" id="chapter-slug-5-3-british-columbias-natural-resources" title="Mining in BC">
	<div class="chapter-title-wrap">
		<p class="chapter-number">28</p>
		<h1 class="chapter-title">Mining in BC</h1>
								</div>
	<div class="ugc chapter-ugc">
				 <p>British Columbia (BC) is rich in natural resources, and the extraction of these resources has been linked to historical processes. In British Columbia, there are 3 primary natural resources that have deep connections to the provinces past; mining, forestry and fisheries. In later chapters we will explore the fisheries and forestry in more detail. In this chapter, we’ll examine mining in British Columbia.</p> <h2>Mining in BC</h2> <p>With the signing of the Oregon Treaty in 1846, <strong>boundary country</strong> opened up and the exploration of BC’s mines grew massively. The mining of coal, metals and minerals began&nbsp;with the gold rush in the 1850s and continues today.</p> <p>Some significant factors to note about the mining of metals in BC include:</p> <ul><li>Coal and gold were both mined before the gold rush started.</li> <li>Gold finds were small and only mined for short periods.</li> <li>Gold was predominant until silver was discovered in the late 1800s in the Kootenays.</li> <li>New techniques, including open pit mining,&nbsp;led to new mining developments: <ul><li>Copper, lead and zinc were mined</li> <li>By the 1960s&nbsp;iron ore was being mined in the Gulf of Georgia</li> <li>The&nbsp;discovery of&nbsp;<strong>molybdenum</strong> allowed&nbsp;steel to be made much harder when used as an alloy</li> </ul> </li> </ul> <div class="wp-caption aligncenter" id="attachment_99" aria-describedby="caption-attachment-99" style="width: 400px"><a href="http://opentextbc.ca/geography/wp-content/uploads/sites/34/2014/06/siobhan_BCrevenueFromNaturalResources-04-e1406066327607.png" data-url="http://opentextbc.ca/geography/wp-content/uploads/sites/34/2014/06/siobhan_BCrevenueFromNaturalResources-04-e1406066327607.png"><img class="wp-image-99" alt="Figure 1. Revenue from BC&amp;#039;s natural resource mining 2013" src="http://opentextbc.ca/geography/wp-content/uploads/sites/34/2014/06/siobhan_BCrevenueFromNaturalResources-04-e1406066327607.png" height="281" width="400" title="" /></a><div class="wp-caption-text" id="caption-attachment-99">Figure 4.1 Revenue from BC’s natural resource mining 2013</div></div> <p>Coal, which was one of the original resources mined in BC, is still of great significance today with&nbsp;31 million tonnes produced in 2013,&nbsp;representing 43% of BC natural resource revenues, contributing to&nbsp;close to $400 million to provincial revenue. Figure 1&nbsp;illustrates the significance of coal and the other major resources mined in BC today. The following are facts about mining in BC today:</p> <ol><li>Mining is estimated to be worth&nbsp;$5.6 billion for the province, almost double what it was in 2001.</li> <li>The&nbsp;gross mining revenues for the mining industry were&nbsp;$8.5 billion in 2013.</li> <li>The number of people working in BC’s mining industry in 2013 increased to 10,720 up from 10,419 in 2012.</li> <li>Vancouver is the world’s leading centre of expertise for mineral exploration, and there are&nbsp;at least&nbsp;1,200 exploration companies located in BC.</li> <li>Coal accounts for 39% of the total volume handled at the Port of Vancouver, which moves shipments to China, Japan and other Asian markets.</li> </ol> <div class="wp-caption aligncenter" id="attachment_100" aria-describedby="caption-attachment-100" style="width: 800px"><a href="http://www.empr.gov.bc.ca/Mining/Geoscience/PublicationsCatalogue/OpenFiles/2013/Documents/2013-01/OF2013-1.pdf" target="_blank" data-url="http://www.empr.gov.bc.ca/Mining/Geoscience/PublicationsCatalogue/OpenFiles/2013/Documents/2013-01/OF2013-1.pdf"><img class="wp-image-100" alt="Figure 2. Operating Mines and Selected Exploration Projects in British Columbia 2013 by Ministry of Energy and Mines. CC-BY-NC-ND 4.0 (http://creativecommons.org/licenses/by-nc-nd/4.0/)" src="http://opentextbc.ca/geography/wp-content/uploads/sites/34/2014/06/Screen_Shot_2014-06-11_at_11.58_.26_AM_-e1406066529961.png" height="508" width="800" title="" /></a><div class="wp-caption-text" id="caption-attachment-100">Figure 4.2. Operating mines and selected exploration projects in British Columbia, 2013, by Ministry of Energy and Mines. Click map for a larger version. If you are reading this in the print version, see the attributions list for the full link to the resource.</div></div> <h2>Social and Environmental Costs</h2> <p>It seems, then, that mining is of great importance to the province of BC and to its local and international economy. But what are the social and environmental costs associated with the mining of natural resources in BC?</p> <p>The greatest social cost has been the access to land and the land rights of BC’s First Nations. Up to now the BC government has signed 14 economic development agreements with First Nations across the province. These agreements commit the provincial government to share up to 37%&nbsp;of the BC mineral tax from mining operations collected within First Nations traditional territories. Two&nbsp;recent agreements signed with First Nations&nbsp;involve&nbsp;the Huckleberry Mine, a few hundred kilometres&nbsp;from Williams Lake , and the Gibraltar Mine.</p> <p>Mining also presents environmental costs. BC’s diverse and pristine physical environment is highly regarded a&nbsp;reason the province&nbsp;is promoted as being one of the best places to live, but mining is threatening this.&nbsp;Water is mining’s biggest casualty and affects all of BC’s residents. There have been several threats to groundwater sources, which is where we get our drinking water from, including in the Greater Vancouver and Victoria areas.</p> <p>The second case study in this chapter&nbsp;focuses on an&nbsp;operational mine and the impact it has on the&nbsp;local people,&nbsp;specifically&nbsp;First Nations people, and the&nbsp;environment.</p> <h2>Attributions</h2> <ul><li><strong>Figure 4.1</strong> Revenue from BC’s natural resource mining 2013. Created by Hilda Anggraeni adapted from Mining BC website facts (<a href="http://www.mining.bc.ca/mining-facts" target="_blank" data-url="http://www.mining.bc.ca/mining-facts">http://www.mining.bc.ca/mining-facts</a>)</li> <li><strong>Figure 4.2</strong> Operating mines and selected exploration projects in British Columbia 2013 by Ministry of Energy and Mines (<a href="http://www.empr.gov.bc.ca/Mining/Geoscience/PublicationsCatalogue/OpenFiles/Pages/default.aspx" target="_blank" data-url="http://www.empr.gov.bc.ca/Mining/Geoscience/PublicationsCatalogue/OpenFiles/Pages/default.aspx">http://www.empr.gov.bc.ca/Mining/Geoscience/PublicationsCatalogue/OpenFiles/Pages/default.aspx</a>) used under CC-BY-NC-ND 4.0 (<a href="http://creativecommons.org/licenses/by-nc-nd/4.0/" target="_blank" data-url="http://creativecommons.org/licenses/by-nc-nd/4.0/">http://creativecommons.org/licenses/by-nc-nd/4.0/</a>) Find a large size version of this map at: <a href="http://www.empr.gov.bc.ca/Mining/Geoscience/PublicationsCatalogue/OpenFiles/2013/Documents/2013-01/OF2013-1.pdf" target="_blank" data-url="http://www.empr.gov.bc.ca/Mining/Geoscience/PublicationsCatalogue/OpenFiles/2013/Documents/2013-01/OF2013-1.pdf">http://www.empr.gov.bc.ca/Mining/Geoscience/PublicationsCatalogue/OpenFiles/2013/Documents/2013-01/OF2013-1.pdf</a></li> </ul> 
	</div>


	</div>
<div class="chapter standard with-subsections" id="chapter-slug-5-4-case-studies" title="Case Study 1: The Gold Rush">
	<div class="chapter-title-wrap">
		<p class="chapter-number">29</p>
		<h1 class="chapter-title">Case Study 1: The Gold Rush</h1>
								</div>
	<div class="ugc chapter-ugc">
				 <div class="wp-caption aligncenter" id="attachment_102" aria-describedby="caption-attachment-102" style="width: 400px"><a href="http://opentextbc.ca/geography/wp-content/uploads/sites/34/2014/06/BC-New_Eldorado-e1404947870961.jpg" data-url="http://opentextbc.ca/geography/wp-content/uploads/sites/34/2014/06/BC-New_Eldorado-e1404947870961.jpg"><img class="wp-image-102" alt="Figure 1. BC as the new El Dorado by Peter Winkworth- Library and Archives Canada, Acc. No. R9266-3470 Peter Winkworth Collection of Canadian This image is available from Library and Archives Canada." src="http://opentextbc.ca/geography/wp-content/uploads/sites/34/2014/06/BC-New_Eldorado-e1404947870961.jpg" height="290" width="400" title="" /></a><div class="wp-caption-text" id="caption-attachment-102">Figure 4.3 BC as the new El Dorado by Peter Winkworth Library and Archives Canada</div></div> <p>B<span style="background-color: #ffffff;">ritish Columbia experienced&nbsp;two big gold rushes, one in 1858 on the Fraser River and the other in 1862 in the Cariboo district, and a number of smaller gold rushes. In each, tens of thousands of men (and a few women) sailed north from California, where the gold rush was coming to an end,&nbsp;to land in Esquimalt Harbour on Vancouver Island, not far from Fort Victoria. </span></p> <p><span style="background-color: #ffffff;">Every&nbsp;miner had to&nbsp;fist travel to&nbsp;Victoria in order to obtain a license to prospect and pan for gold in BC, making the city a services hub for the mining industry. At that time,&nbsp;</span><span style="background-color: #ffffff;">Fort Victoria was tiny with about&nbsp;500 immigrants living on southern Vancouver Island. Most of these were&nbsp;Hudson’s Bay Company employees, farmers and their families. Within two months of the news of the discovery of gold in 1858,&nbsp;</span>the population grew to over 20,000. There was little infrastructure for all these new arrivals and&nbsp;Fort Victoria became a tent city as miners camped while they purchased their mining licenses&nbsp;and all their supplies.</p> <p><span style="background-color: #ffffff;">Although much of the historical documentation and focus is on the mining for gold during this time, it is also important to note that there was mining happening in other&nbsp;areas, such as&nbsp;c</span>oal, oil, natural gas, silver and&nbsp;copper.&nbsp;The expansion of all these other resources occurred after the 1960s when the technology for open pit mining was developed.</p> <h2>Gold Rush Regions</h2> <p>If you are viewing this on the Web, you can use the interactive map here&nbsp;to learn a little more on each of the regions around BC where gold was discovered and prospecting took place. If you are reading this book in print, the static map shows the regions in a standard map.</p> <p style="text-align: center;"></p> <div class="textbox interactive-content interactive-content--iframe"><span class="interactive-content__icon"></span> <p>One or more interactive elements has been excluded from this version of the text. You can view them online here: <a href="https://opentextbc.ca/geography/?p=111" title="Case Study 1: The Gold Rush" data-url="https://opentextbc.ca/geography/?p=111">https://opentextbc.ca/geography/?p=111</a> </p> </div> <br /> <small>View <a style="color: #0000ff; text-align: left;" href="https://www.google.com/maps/ms?msa=0&amp;msid=206001999525231667103.0004fb997745c1087bebd&amp;hl=en&amp;ie=UTF8&amp;t=m&amp;source=embed&amp;ll=55.002826,-125.332031&amp;spn=12.628107,30.717773&amp;z=5" data-url="https://www.google.com/maps/ms?msa=0&amp;msid=206001999525231667103.0004fb997745c1087bebd&amp;hl=en&amp;ie=UTF8&amp;t=m&amp;source=embed&amp;ll=55.002826,-125.332031&amp;spn=12.628107,30.717773&amp;z=5">BC gold rush</a> in a larger map</small> <p>&nbsp;</p> <p>&nbsp;</p> <div class="wp-caption aligncenter" style="width: 942px"><a href="http://opentextbc.ca/geography/wp-content/uploads/sites/34/2014/06/siobhan_timeline_onePage-03.png" data-url="http://opentextbc.ca/geography/wp-content/uploads/sites/34/2014/06/siobhan_timeline_onePage-03.png"><img alt="Gold Rush time line and location" src="http://opentextbc.ca/geography/wp-content/uploads/sites/34/2014/06/siobhan_timeline_onePage-03.png" height="1219" width="942" title="" /></a><div class="wp-caption-text">Figure 4.4 British Columbia gold rush: Regions amd timeline</div></div> <h2>Women and Chinese prospectors during BC’s Gold Rush</h2> <h3>Women</h3> <p>Women played an important role in the era of the gold rush.&nbsp;Many women prospectors searched the rivers of BC alongside the men or indeed with their husbands or family. But it was the lack of women that also factored into this era.&nbsp;During the earlier periods of the gold rush,&nbsp;there were&nbsp;<span style="background-color: #ffffff;">so few women in the towns&nbsp; that brides were sent for from other parts of the world. An example is the Anglican minister in Lillooet, Robert C. Brown, who initiated the Columbia Emigration Society with its sole&nbsp;purpose being to arrange for young women from England to be sent to the Cariboo as potential brides for the miners!</span></p> <div class="wp-caption aligncenter" id="attachment_104" aria-describedby="caption-attachment-104" style="width: 400px"><a href="http://opentextbc.ca/geography/wp-content/uploads/sites/34/2014/06/b3006d00-9a14-4991-bd6b-765aa9db0310-A72954-e1404947531958.jpg" data-url="http://opentextbc.ca/geography/wp-content/uploads/sites/34/2014/06/b3006d00-9a14-4991-bd6b-765aa9db0310-A72954-e1404947531958.jpg"><img class="wp-image-104" alt="Figure 3. Women panning for Gold by Louis Denison Taylor is in the public domain (source: http://searcharchives.vancouver.ca/woman-panning-for-gold)" src="http://opentextbc.ca/geography/wp-content/uploads/sites/34/2014/06/b3006d00-9a14-4991-bd6b-765aa9db0310-A72954-e1404947531958.jpg" height="391" width="400" title="" /></a><div class="wp-caption-text" id="caption-attachment-104">Figure 4.5 Woman panning for Gold by Louis Denison Taylor</div></div> <h3>Chinese Prospectors</h3> <p>During the Cariboo gold rush the first Chinese community was established in Canada in Barkerville. Discrimination toward Asians prevented&nbsp;the Chinese from&nbsp;prospecting anywhere&nbsp;other than on abandoned sites, and so they did not make as much money as the white prospectors. Despite this discrimination, the Chinese community thrived by providing many of the required services to the 20,000 prospectors who&nbsp;came into the Barkerville region in the 1860s, including&nbsp;operating grocery stores and restaurants. At the height of the gold rush there were as many as 5,000 Chinese living there.</p> <p>During both the Fraser and Cariboo gold rushes, Chinese immigrants also landed in Fort Victoria, having moved from California to escape the discrimination there, and once the gold rush was over, many stayed on.&nbsp;In Victoria,&nbsp;the Chinese started import businesses and worked as small merchants, building&nbsp;a strong community in the city. The first Chinatown in Canada was founded in Victoria in the 1850s, and by the end of the 1860s there were approximately 7,000 Chinese living in British Columbia.</p> <h2>First Nations during BC’s Gold Rush</h2> <p>In historical accounts of&nbsp;BC’s gold rush, First Nations peoples of the area are overlooked, but they certainly played&nbsp;an important role.</p> <p>The Aboriginal residents were essential to the prospectors, providing them with goods such as&nbsp;canoes and food, and services such as guides and translators. Both Aboriginals and prospectors&nbsp;benefited from the relationship a&nbsp;the&nbsp;Aboriginals wanted to trade and the prospectors needed the goods and access to local knowledge.</p> <p>As the number of prospectors increased in the rush to find gold, their own local knowledge grew&nbsp;and&nbsp;the initial mutually beneficial relationship began to collapse. As time went on First Nations people were marginalized&nbsp;and even terrorized on their own lands.</p> <p>The photograph from 1898 in Figure 4 shows the contrast between&nbsp;the buildings in Vancouver in the background and&nbsp;First Nations peoples attempting to maintain their livelihood on their territory.</p> <div class="wp-caption aligncenter" id="attachment_105" aria-describedby="caption-attachment-105" style="width: 400px"><a href="http://opentextbc.ca/geography/wp-content/uploads/sites/34/2014/06/5d924a17-bed7-4549-a32d-87b560223f70-A09221_141.jpg" data-url="http://opentextbc.ca/geography/wp-content/uploads/sites/34/2014/06/5d924a17-bed7-4549-a32d-87b560223f70-A09221_141.jpg"><img class="wp-image-105" alt="Figure 4. First Nations people camped on Alexander Street beach at foot of Columbia Street by Major James Skitt Matthews (http://searcharchives.vancouver.ca/first-nations-people-camped-on-alexander-street-beach-at-foot-of-columbia-street) is in the public domain (http://en.wikipedia.org/wiki/Public_domain)" src="http://opentextbc.ca/geography/wp-content/uploads/sites/34/2014/06/5d924a17-bed7-4549-a32d-87b560223f70-A09221_141.jpg" height="305" width="400" srcset="https://opentextbc.ca/geography/wp-content/uploads/sites/34/2014/06/5d924a17-bed7-4549-a32d-87b560223f70-A09221_141.jpg 480w, https://opentextbc.ca/geography/wp-content/uploads/sites/34/2014/06/5d924a17-bed7-4549-a32d-87b560223f70-A09221_141-300x228.jpg 300w, https://opentextbc.ca/geography/wp-content/uploads/sites/34/2014/06/5d924a17-bed7-4549-a32d-87b560223f70-A09221_141-65x49.jpg 65w, https://opentextbc.ca/geography/wp-content/uploads/sites/34/2014/06/5d924a17-bed7-4549-a32d-87b560223f70-A09221_141-225x171.jpg 225w, https://opentextbc.ca/geography/wp-content/uploads/sites/34/2014/06/5d924a17-bed7-4549-a32d-87b560223f70-A09221_141-350x266.jpg 350w" sizes="auto, (max-width: 400px) 100vw, 400px" title="" /></a><div class="wp-caption-text" id="caption-attachment-105">Figure 4.6 First Nations people camped on Alexander Street beach at foot of Columbia Street by Major James Skitt Matthews, 1898</div></div> <h2>&nbsp;Attributions</h2> <ul><li><strong>Figure 4.3</strong> BC as the new El Dorado by Peter Winkworth- Library and Archives Canada, Acc. No. R9266-3470 Peter Winkworth Collection of Canadian This image is in the Public Domain and is available from Library and Archives Canada (<a href="http://www.collectionscanada.gc.ca/pam_archives/public_mikan/index.php?fuseaction=genitem.displayItem&amp;lang=eng&amp;rec_nbr=3022666&amp;rec_nbr_list=3022666" target="_blank" data-url="http://www.collectionscanada.gc.ca/pam_archives/public_mikan/index.php?fuseaction=genitem.displayItem&amp;lang=eng&amp;rec_nbr=3022666&amp;rec_nbr_list=3022666">http://www.collectionscanada.gc.ca/pam_archives/public_mikan/index.php?fuseaction=genitem.displayItem&amp;lang=eng&amp;rec_nbr=3022666&amp;rec_nbr_list=3022666</a>).</li> <li><strong>Figure 4.4</strong> British Columbia gold rush: Regions and timeline created by Hilda Anggraeni</li> <li><strong>Figure 4.5</strong> Women panning for Gold by Louis Denison Taylor is in the Public Domain (source: <a href="http://searcharchives.vancouver.ca/woman-panning-for-gold" target="_blank" data-url="http://searcharchives.vancouver.ca/woman-panning-for-gold">http://searcharchives.vancouver.ca/woman-panning-for-gold</a>)</li> <li><strong>Figure 4.6</strong> First Nations people camped on Alexander Street beach at foot of Columbia Street by Major James Skitt Matthews is in the Public Domain (source: <a href="http://searcharchives.vancouver.ca/first-nations-people-camped-on-alexander-street-beach-at-foot-of-columbia-street" target="_blank" data-url="http://searcharchives.vancouver.ca/first-nations-people-camped-on-alexander-street-beach-at-foot-of-columbia-street">http://searcharchives.vancouver.ca/first-nations-people-camped-on-alexander-street-beach-at-foot-of-columbia-street</a>)</li> </ul> 
	</div>


	</div>
<div class="chapter standard with-subsections" id="chapter-case-study-2-3" title="Case Study 2: Carrier Nation and the Endako Mine">
	<div class="chapter-title-wrap">
		<p class="chapter-number">30</p>
		<h1 class="chapter-title">Case Study 2: Carrier Nation and the Endako Mine</h1>
								</div>
	<div class="ugc chapter-ugc">
				 <h2>Mining in BC and First Nations peoples</h2> <p>In BC, mines and potential mines often lie in or are close to the traditional lands of First Nations people.&nbsp;The Province is legally obligated to consult and accommodate First Nations on land and resource decisions that could impact Aboriginal interests.</p> <p>Mining is a double-edged sword for the Aboriginal people of BC:&nbsp;on the one hand it provides employment and financial gain (when they are granted proper rights, which is not always the case), but on the other it&nbsp;interferes with traditional use of lands and significantly harms the environment to which their culture is inextricably linked.</p> <p>Although BC mining laws do&nbsp;provide some level of protection for First Nations, the laws still favour industry and do not regulate the protections over&nbsp;First Nations land and rights. First Nations peoples face bureaucracy at every corner in terms of registering claims or addressing issues of exploration, production or closing of mining sites in BC.</p> <h2>Unemployment</h2> <p>Why do First Nations people engage with mining companies despite the fact that they face unjust treatment and bureaucracy? One of the most important reasons is the high&nbsp;unemployment rates in the Aboriginal communities, especially among the&nbsp;youth.&nbsp;Consequently, many Aboriginal people support mining within their land as the industry provides employment and a regular income to many. Since 2001, Aboriginal people have benefited from&nbsp;increased levels of employment in&nbsp;British Columbia&nbsp;due to the economic growth associated with mining, construction and the services linked to these (White, Michalowski, &amp; Cross, 2006).</p> <p>Skii km Lax Ha,&nbsp;a small band near Hazelton, is an example of an Aboriginal group that has&nbsp;had a positive experience with the location of the mines on its&nbsp;land. However, not all&nbsp;experiences are&nbsp;positive and often the local people suffer as does the environment.</p> <h2>Carrier Nation</h2> <p>The Carrier First Nation, located in the mid-interior of the province, is one group that has not benefited from mining.</p> <div class="wp-caption aligncenter" id="attachment_106" aria-describedby="caption-attachment-106" style="width: 400px"><a href="http://opentextbc.ca/geography/wp-content/uploads/sites/34/2014/06/464px-CarrierCommunities.jpg" data-url="http://opentextbc.ca/geography/wp-content/uploads/sites/34/2014/06/464px-CarrierCommunities.jpg"><img class="wp-image-106" alt="Figure 1. Communities Within the Carrier Language Area" src="http://opentextbc.ca/geography/wp-content/uploads/sites/34/2014/06/464px-CarrierCommunities.jpg" height="517" width="400" srcset="https://opentextbc.ca/geography/wp-content/uploads/sites/34/2014/06/464px-CarrierCommunities.jpg 464w, https://opentextbc.ca/geography/wp-content/uploads/sites/34/2014/06/464px-CarrierCommunities-232x300.jpg 232w, https://opentextbc.ca/geography/wp-content/uploads/sites/34/2014/06/464px-CarrierCommunities-65x84.jpg 65w, https://opentextbc.ca/geography/wp-content/uploads/sites/34/2014/06/464px-CarrierCommunities-225x290.jpg 225w, https://opentextbc.ca/geography/wp-content/uploads/sites/34/2014/06/464px-CarrierCommunities-350x452.jpg 350w" sizes="auto, (max-width: 400px) 100vw, 400px" title="" /></a><div class="wp-caption-text" id="caption-attachment-106">Figure 4.7 Communities within the Carrier language area</div></div> <p>Over the last several years there has been considerable increase in mining exploration and activities within the Carrier territory.&nbsp; Both the province of BC and mining companies are investing in inventories and exploration of minerals. Despite the fact that&nbsp;billions&nbsp;of dollars have been made from the mines on their land, the Carrier communities have gained little or no benefit.</p> <p><strong>Endako Mine</strong></p> <p>Located West of Fraser Lake in BC, the&nbsp;Endako mine is one of the largest&nbsp;molybdenum&nbsp;mines in North America, with&nbsp;reserves amounting to 448.4 million tonnes of molybdenum ore&nbsp;resulting in 148,000 tonnes of molybdenum. One of the older mines in British Columbia, Endako is owned by US-based Thompson Creek Metals and&nbsp;began operations in 1965. It is&nbsp;a major employer in the area and has recently been expanding its operations.</p> <div class="wp-caption aligncenter" id="attachment_107" aria-describedby="caption-attachment-107" style="width: 400px"><a href="http://opentextbc.ca/geography/wp-content/uploads/sites/34/2014/06/siobhan_endako_mine-05-e1406068041415.png" data-url="http://opentextbc.ca/geography/wp-content/uploads/sites/34/2014/06/siobhan_endako_mine-05-e1406068041415.png"><img class="wp-image-107" alt="Figure 2. Location of Endako Mine" src="http://opentextbc.ca/geography/wp-content/uploads/sites/34/2014/06/siobhan_endako_mine-05-e1406068041415.png" height="381" width="400" title="" /></a><div class="wp-caption-text" id="caption-attachment-107">Figure 4.8 Location of Endako mine</div></div> <p>Local First Nations (Stellate’en, Nadleh Wut’en) have filed&nbsp;lawsuits against Endako Mines for failure to consult on the mine expansion occurring today. Another concern is that&nbsp;consultation did not occur initially&nbsp;in the 1960s when the mine opened, and the courts have refused to acknowledge First Nations rights and title flowing from that time period to today.</p> <p>Thompson Creek Metals’ recent expansion of&nbsp;its operations to Mount Milligan (halfway between Fort St. James and Mackenzie, just southeast of Fraser Lake), is&nbsp;opposed by some First Nations,&nbsp;but nevertheless the copper-gold mine has been&nbsp;approved. The load out facility will be in Mackenzie and mining is regarded as a&nbsp;new employment&nbsp;asset&nbsp;to the town which is primarily based around logging and&nbsp;lumber.</p> <h2>Environmental Issues</h2> <p>The BC Ministry of Environment has identified that <strong class="Bold">effluent</strong> from Endako mines is affecting aquatic environment in Francois Lake, just one of many environmental impacts of the mine to the surrounding area. Although the wastewater discharged from the&nbsp;molybdenum mine does not exceed its permit limits (5.6 million cubic metres a year of seepage and run-off from tailings dams and the mine site, which is&nbsp;enough discharge to fill more than 2,200 Olympic-sized swimming pools a year), monitoring indicates that effluent is affecting the aquatic environment in Francois Lake, the Endako River, and streams originating from the mine site.</p> <p>Specifically, monitoring by the BC Ministry of Environment indicates that elevated levels of contaminants of concern&nbsp;are reaching Francois Lake and influencing the physiology of the prickly sculpin, normally a bottom-feeding fish. The <strong>sculpin</strong> is a sentinel species, which can provide advance warning of dangers to the environment. These fish are experiencing reduced reproductive capabilities&nbsp;and enlarged liver sizes due to the toxins.</p> <div class="wp-caption aligncenter" id="attachment_110" aria-describedby="caption-attachment-110" style="width: 300px"><a href="http://opentextbc.ca/geography/wp-content/uploads/sites/34/2014/06/800px-Antlered_Sculpin.jpg" data-url="http://opentextbc.ca/geography/wp-content/uploads/sites/34/2014/06/800px-Antlered_Sculpin.jpg"><img class="size-medium wp-image-110" alt="Figure 4. Sculpin fish" src="http://opentextbc.ca/geography/wp-content/uploads/sites/34/2014/06/800px-Antlered_Sculpin-300x171.jpg" height="171" width="300" srcset="https://opentextbc.ca/geography/wp-content/uploads/sites/34/2014/06/800px-Antlered_Sculpin-300x171.jpg 300w, https://opentextbc.ca/geography/wp-content/uploads/sites/34/2014/06/800px-Antlered_Sculpin-65x37.jpg 65w, https://opentextbc.ca/geography/wp-content/uploads/sites/34/2014/06/800px-Antlered_Sculpin-225x128.jpg 225w, https://opentextbc.ca/geography/wp-content/uploads/sites/34/2014/06/800px-Antlered_Sculpin-350x200.jpg 350w, https://opentextbc.ca/geography/wp-content/uploads/sites/34/2014/06/800px-Antlered_Sculpin.jpg 800w" sizes="auto, (max-width: 300px) 100vw, 300px" title="" /></a><div class="wp-caption-text" id="caption-attachment-110">Figure 4.9 Sculpin fish</div></div> <p>A BC Ministry of Environment report showed that federal guidelines on BC water-quality guidelines were exceeded at the Sweetnam Creek outlet in Francois Lake, just south of the mine operation at Endako. Sulphate, phosphorus, aluminum&nbsp;and molybdenum were all found in the water.</p> <p>David Bailey, Director of the Environment for Thompson Creek Metals, has said that the evaluation of the latest monitoring results was&nbsp;preliminary, and that a&nbsp;re-evaluation of its permit limits would be up for discussion as part of an ongoing analysis, including with Environment Canada (Hoekstra, 2014). However, he maintained that the company would only make changes supported by good science.</p> <h2>Moving Forward</h2> <p>Chief Martin Louie of&nbsp;Nadleh Whut’en, says that all First Nations and local residents should be concerned that the Endako Mine being allowed to pollute the environment. The problem, in his opinion, is that the mine is old and is therefore operating using outdated practices&nbsp;and poor standards. The pressure on the local ecosystems is of great concern to him and his people and there is a need for discussion with First Nations leaders, industries and government in order to&nbsp;define&nbsp;cumulative impacts.&nbsp;The issue is ongoing for Endako and the land of the Carrier peoples.</p> <h2>Attributions</h2> <ul><li><strong>Figure 4.6</strong> Communities within the Carrier language area. By Michelle Loughheed (<a href="http://en.wikipedia.org/wiki/File:CarrierCommunities.jpg" target="_blank" data-url="http://en.wikipedia.org/wiki/File:CarrierCommunities.jpg">http://en.wikipedia.org/wiki/File:CarrierCommunities.jpg</a>) under CC BY-SA 2.5 (<a href="http://creativecommons.org/licenses/by-sa/2.5/" target="_blank" data-url="http://creativecommons.org/licenses/by-sa/2.5/">http://creativecommons.org/licenses/by-sa/2.5/</a>)</li> <li><strong>Figure 4.7</strong> Location of Endako mine by Hilda Anggraeni derived from British Columbia Map from The Atlas of Canada (<a href="http://atlas.nrcan.gc.ca/site/english/maps/reference/outlineprov_terr/bc_outline" target="_blank" data-url="http://atlas.nrcan.gc.ca/site/english/maps/reference/outlineprov_terr/bc_outline">http://atlas.nrcan.gc.ca/site/english/maps/reference/outlineprov_terr/bc_outline</a>) used under Open Government Licence (<a href="http://data.gc.ca/eng/open-government-licence-canada" target="_blank" data-url="http://data.gc.ca/eng/open-government-licence-canada">http://data.gc.ca/eng/open-government-licence-canada</a>).</li> <li><strong>Figure 4.8</strong> Area surrounding Endako mine including Endako River and Fraser Lake by Hilda Anggraeni derived from British Columbia Map from The Atlas of Canada (<a href="http://atlas.nrcan.gc.ca/site/english/maps/reference/outlineprov_terr/bc_outline" target="_blank" data-url="http://atlas.nrcan.gc.ca/site/english/maps/reference/outlineprov_terr/bc_outline">http://atlas.nrcan.gc.ca/site/english/maps/reference/outlineprov_terr/bc_outline</a>) used under Open Government Licence (<a href="http://data.gc.ca/eng/open-government-licence-canada" target="_blank" data-url="http://data.gc.ca/eng/open-government-licence-canada">http://data.gc.ca/eng/open-government-licence-canada</a>).</li> <li><strong>Figure 4.9</strong> Sculpin fish by&nbsp;Kitty Mecklenburg (<a href="http://commons.wikimedia.org/wiki/File:Antlered_Sculpin.jpg" target="_blank" data-url="http://commons.wikimedia.org/wiki/File:Antlered_Sculpin.jpg">http://commons.wikimedia.org/wiki/File:Antlered_Sculpin.jpg</a>) is in the Public Domain</li> </ul> 
	</div>


	</div>
<div class="chapter standard with-subsections" id="chapter-slug-5-5-summary" title="Summary">
	<div class="chapter-title-wrap">
		<p class="chapter-number">31</p>
		<h1 class="chapter-title">Summary</h1>
								</div>
	<div class="ugc chapter-ugc">
				 <p>While all organisms require biological resource to survive, Geography is more concerned with the human perspective of resources and how resources can be used to satisfy human needs.&nbsp; More recently, resources have become connected to processes of capitalism and economic development. Most natural resources are now controlled by governments or by powerful corporations.</p> <p>Resources are often viewed with one of two, often opposing, perspectives; Economic or Ecological, and there is a distinction between man-made resources and natural resources. A substance becomes a natural resource when cultural value is giving to a substance, when it benefits society, or when it benefits the economic system.</p> <p>British Columbia is rich with natural resources, and the extraction of these resources has had a major influence on the development of British Columbia. Mining in BC represents 43% of BC’s natural resource revenues, with coal alone accounting for 39% of the total volume of goods shipped from the Port of Vancouver. However, mining also comes with social and environmental costs, including strained relations with First Nations regarding land access and threatening the provinces water system.</p> <p>British Columbia was the site of a number of gold rushes from 1850-1890 during which the first Chinese community was established in the province in Barkerville. Both women and First Nations had important, but often underrepresented roles during this period. Women often panned for gold alongside male miners, while First Nations knowledge of the local geography made them valuable guides until miners were familiar enough with the land that they did not need the services of First Nations guides anymore and First Nations people were marginalized on their own lands.</p> <p>Indeed, the relationship between mining and First nations in British Columbia has historically been seen as a double edged sword, bringing economic benefits to First Nations communities on one hand, while often interfering with their traditional use of the land. This uneasy relationship is illustrated in the second case study which examines the relationship between The Carrier Nation and Thompson Creek Metals and the Endako Mine.</p> 
	</div>


	</div>
<div class="chapter standard with-subsections" id="chapter-slug-5-8-key-terms" title="Key Terms">
	<div class="chapter-title-wrap">
		<p class="chapter-number">32</p>
		<h1 class="chapter-title">Key Terms</h1>
								</div>
	<div class="ugc chapter-ugc">
				 <div class="bcc-box bcc-success"><h3>Key Terms</h3> <p><strong>Boundary country:</strong>&nbsp;A historical designation for a district in southern British Columbia lying, as its name suggests, along the boundary between Canada and the United States.<strong><br /> <strong><strong class="Bold"><br /> Effluent:</strong></strong></strong> An outflowing of water or gas from a natural body of water, or from a humanmade structure.<strong><strong><br /> </strong><br /> <strong>Molybdenum:</strong> </strong>A silvery-white, hard transition metal.<br /> <strong><br /> <strong>Sculpin:</strong></strong> A type of fish. Sculpins occur in many types of habitat, including ocean and freshwater zones. They live in rivers, submarine canyons, kelp forests and shallow littoral habitat types, such as tidepools.</p> </div> <p><!--?xml version="1.0" encoding="UTF-8"?? --></p> 
	</div>


	</div>
<div class="chapter standard with-subsections" id="chapter-slug-5-6-activities" title="Suggested Activities">
	<div class="chapter-title-wrap">
		<p class="chapter-number">33</p>
		<h1 class="chapter-title">Suggested Activities</h1>
								</div>
	<div class="ugc chapter-ugc">
				 <div class="bcc-box bcc-info"><h3 itemprop="educationalUse">Suggested Activities</h3> <h2>Activity 1</h2> <p>On the <a href="http://www.mineralsed.ca/s/Geology.asp" target="_blank" data-url="http://www.mineralsed.ca/s/Geology.asp">interactive map of BC</a> <span class="footnote"><span class="footnote-indirect" data-fnref="115-1"></span></span> select the different types of mining taking places across the province and answer the following questions:</p> <ul><li>What are the five different types of landscapes illustrated in the map? What is the relationship between the types of mines you see and the type of landscape?</li> <li>How many mines are currently in operation across BC?</li> <li>Where are most of the mines located?</li> <li>How many are coal mines? Where are they mainly located?</li> <li>How many are metal mines? Where are they mainly located?</li> <li>How many are industrial mineral operations? Where are they mainly located?</li> </ul> <h2>Activity 2</h2> <p>On a map of British Columbia, locate Yale, which&nbsp;is just north of Hope, on the Fraser River. (Hope is directly east of Vancouver and directly north of Ross Lake in Washington.) Follow Highway 1 north to Cache Creek and then continue north on Highway 97 to Quesnel.&nbsp;At Quesnel, go east to Bowron Lake Provincial Park,&nbsp;and&nbsp;just before coming to the Bowron Lakes you will find Barkerville. What is Barkerville like as a town today? Can you find anything on its historical significance?</p> <h2>Activity 3</h2> <p>Using the historical g<a href="https://www.google.com/maps/ms?msid=206001999525231667103.0004fb997745c1087bebd&amp;msa=0" target="_blank" data-url="https://www.google.com/maps/ms?msid=206001999525231667103.0004fb997745c1087bebd&amp;msa=0">old rush interactive map</a><span class="footnote"><span class="footnote-indirect" data-fnref="115-2"></span></span> can you find out anything on the smaller gold rushes between 1859 and 1869? What region of BC were they located in?</p> <p>The&nbsp;Big Bend gold rush was in&nbsp;an area of the upper Columbia River which was extremely remote from any form of non-First Nations civilization in that period. It was impossibly remote from the Fraser River, but some managed to reach&nbsp;the Big Bend rush overland up the Rocky Mountain Trench from what is now Montana, or&nbsp;up the Columbia River itself. Imagine you are a prospector stating from Victoria, making the journey to area. Create a map of your journey on Google maps as it would look today and write 10 tweets/Facebook posts documenting your trip.</p> <h2>Activity 4</h2> <p>Watch the two videos <a href="http://www.miningwatch.ca/miningwatch-canada-video-profile" target="_blank" data-url="http://www.miningwatch.ca/miningwatch-canada-video-profile"><em>Mining Watch Canada: A Video Profile</em></a><span class="footnote"><span class="footnote-indirect" data-fnref="115-3"></span></span> and&nbsp;<a href="http://www.miningwatch.ca/sacred-headwaters-wade-davis-and-photos-paul-colangelo" target="_blank" data-url="http://www.miningwatch.ca/sacred-headwaters-wade-davis-and-photos-paul-colangelo"><em>Sacred Headwaters</em></a>,<span class="footnote"><span class="footnote-indirect" data-fnref="115-4"></span></span> both created by the organization Mining Watch, and answer these questions:</p> <ul><li>Who is impacted most by mining?</li> <li>Why should we care about the rivers?</li> <li>What resources are we losing from mining?</li> </ul> <h2>Activity 5</h2> <p>“We must do the responsible work. It is one thing to dig the earth. It is another to care for it” (anonymous First Nations saying). What do you understand by this saying? What does it tell you about the importance of the relationship between people and the land? Can you think of an example in BC where this relationship is being threatened or is broken?</p> <h2>Activity 6</h2> <p>Skim <a href="http://www.theglobeandmail.com/news/british-columbia/why-one-first-nation-band-is-embracing-mining-despite-its-environmental-impacts/article8158085/" target="_blank" data-url="http://www.theglobeandmail.com/news/british-columbia/why-one-first-nation-band-is-embracing-mining-despite-its-environmental-impacts/article8158085/">this <em>Globe and Mail</em> newspaper article</a><span class="footnote"><span class="footnote-indirect" data-fnref="115-5"></span></span> from February 2013 and answer the questions:</p> <ul><li>What is worse than environmental costs, according to Darlene Simpson?</li> <li>Locate the&nbsp;Skii km Lax Ha Band land on Google maps. What environmental features located in the area would be affected by the mining?</li> <li>What employment has the mining brought to the people in the area?</li> <li>What is mined in the area?</li> </ul> <h2>Activity 7</h2> <p>Imagine you are organizing a kick starter or crowd-funding&nbsp;campaign dealing with an issue on rights and/or environment at the Endako Mine. Share it with your family and friends and see how much money you “raise.”</p> <h2>Activity 8</h2> <p>The photographs (Fig 4.10) show a group of miners queuing for their license to mine and then&nbsp;working in a mine during the gold rush. Can you describe the conditions you see in the photographs for the workers? Why do you think men (and some&nbsp;women) would have endured these conditions?</p> <div class="wp-caption aligncenter" id="attachment_1296" aria-describedby="caption-attachment-1296" style="width: 400px"><a href="http://opentextbc.ca/geography/wp-content/uploads/sites/34/2014/09/ActivitiesChpt4.jpg" data-url="http://opentextbc.ca/geography/wp-content/uploads/sites/34/2014/09/ActivitiesChpt4.jpg"><img src="http://opentextbc.ca/geography/wp-content/uploads/sites/34/2014/09/ActivitiesChpt4.jpg" alt="Figure 4.10: (top photo) Miners line up in Custom House Victoria for certificates to mine (bottom photo) miners in the field" class="wp-image-1296 size-full" height="597" width="400" srcset="https://opentextbc.ca/geography/wp-content/uploads/sites/34/2014/09/ActivitiesChpt4.jpg 400w, https://opentextbc.ca/geography/wp-content/uploads/sites/34/2014/09/ActivitiesChpt4-201x300.jpg 201w, https://opentextbc.ca/geography/wp-content/uploads/sites/34/2014/09/ActivitiesChpt4-65x97.jpg 65w, https://opentextbc.ca/geography/wp-content/uploads/sites/34/2014/09/ActivitiesChpt4-225x335.jpg 225w, https://opentextbc.ca/geography/wp-content/uploads/sites/34/2014/09/ActivitiesChpt4-350x522.jpg 350w" sizes="auto, (max-width: 400px) 100vw, 400px" title="" /></a><div class="wp-caption-text" id="caption-attachment-1296">Figure 4.10: (top photo) Miners line up in Custom House Victoria for certificates to mine (bottom photo) miners in the field</div></div> <p>&nbsp;</p> </div> <h2>Attributions</h2> <ul><li><strong>Figure 4.0</strong>. Miners line up in Custom House Victoria for certificates to mine during the Klondike gold rush by James Skitt&nbsp;Matthews&nbsp;(<a href="http://searcharchives.vancouver.ca/miners-line-up-in-custom-house-for-certificates-to-mine-during-klondyke-gold-rush" target="_blank" data-url="http://searcharchives.vancouver.ca/miners-line-up-in-custom-house-for-certificates-to-mine-during-klondyke-gold-rush">http://searcharchives.vancouver.ca/miners-line-up-in-custom-house-for-certificates-to-mine-during-klondyke-gold-rush</a>)&nbsp;is in the public domain and Photograph of miners during the gold rush by unknown (<a href="http://commons.wikimedia.org/wiki/File:Photograph_of_Miners_During_the_Gold_Rush_-_NARA_-_298079.jpg" target="_blank" data-url="http://commons.wikimedia.org/wiki/File:Photograph_of_Miners_During_the_Gold_Rush_-_NARA_-_298079.jpg">http://commons.wikimedia.org/wiki/File:Photograph_of_Miners_During_the_Gold_Rush_-_NARA_-_298079.jpg</a>) is in the public domain</li> </ul> 
	</div>
			
				
				<div class="footnotes"><div id='115-1'>
<p>Interactive map of BC <a href="http://www.mineralsed.ca/s/Geology.asp" target="_blank" data-url="http://www.mineralsed.ca/s/Geology.asp">http://www.mineralsed.ca/s/Geology.asp</a></p>

</div><div id='115-2'>
<p>Interactive Gold Rush map on Google Maps<a href="//www.google.com/maps/ms?msid=206001999525231667103.0004fb997745c1087bebd&amp;msa=0" target="_blank" data-url="//www.google.com/maps/ms?msid=206001999525231667103.0004fb997745c1087bebd&amp;msa=0"> https://www.google.com/maps/ms?msid=206001999525231667103.0004fb997745c1087bebd&amp;msa=0</a></p>

</div><div id='115-3'>
<p>Mining Watch Canada: A video Profile <a href="http://www.miningwatch.ca/miningwatch-canada-video-profile" target="_blank" data-url="http://www.miningwatch.ca/miningwatch-canada-video-profile">http://www.miningwatch.ca/miningwatch-canada-video-profile</a></p>

</div><div id='115-4'>
<p>Sacred Headwaters <a href="http://www.miningwatch.ca/sacred-headwaters-wade-davis-and-photos-paul-colangelo" target="_blank" data-url="http://www.miningwatch.ca/sacred-headwaters-wade-davis-and-photos-paul-colangelo">http://www.miningwatch.ca/sacred-headwaters-wade-davis-and-photos-paul-colangelo</a></p>

</div><div id='115-5'>
<p>Globe and Mail newspaper article for activity 7 <a href="http://www.theglobeandmail.com/news/british-columbia/why-one-first-nation-band-is-embracing-mining-despite-its-environmental-impacts/article8158085/" target="_blank" data-url="http://www.theglobeandmail.com/news/british-columbia/why-one-first-nation-band-is-embracing-mining-despite-its-environmental-impacts/article8158085/">http://www.theglobeandmail.com/news/british-columbia/why-one-first-nation-band-is-embracing-mining-despite-its-environmental-impacts/article8158085/</a></p>

</div></div>
	</div>
<div class="chapter standard with-subsections" id="chapter-slug-5-7-references-and-resources" title="References and Resources">
	<div class="chapter-title-wrap">
		<p class="chapter-number">34</p>
		<h1 class="chapter-title">References and Resources</h1>
								</div>
	<div class="ugc chapter-ugc">
				 <h2>References</h2> <p>BC Ministry of Energy and Mines&nbsp;<a href="http://www.empr.gov.bc.ca/Mining/Geoscience/PublicationsCatalogue/InformationCirculars/Pages/IC2014-5.aspx" data-url="http://www.empr.gov.bc.ca/Mining/Geoscience/PublicationsCatalogue/InformationCirculars/Pages/IC2014-5.aspx">http://www.empr.gov.bc.ca/Mining/Geoscience/PublicationsCatalogue/InformationCirculars/Pages/IC2014-5.aspx</a></p> <p><em class="Italic">British Columbia: From the Earliest Times to the Present Vol. II</em><span style="color: #252525;">, E.O.S. Scholefield and F.W. Howay</span></p> <p>British Columbia coal industry overview 2013 <a href="http://www.empr.gov.bc.ca/Mining/Geoscience/PublicationsCatalogue/InformationCirculars/Documents/IC2014-5.pdf" data-url="http://www.empr.gov.bc.ca/Mining/Geoscience/PublicationsCatalogue/InformationCirculars/Documents/IC2014-5.pdf">http://www.empr.gov.bc.ca/Mining/Geoscience/PublicationsCatalogue/InformationCirculars/Documents/IC2014-5.pdf</a></p> <p>Costanza, R., d’Arge, R., de Groot, R., Farber, S., Grasso, M.,&nbsp;Hannon, B., Paruelo, J., Raskin, R.G., Sutton, P. and van den Belt, M. 1997. The value of the world’s ecosystem services and natural capital.&nbsp;<em class="Italic">Nature</em>&nbsp;387: 253-60.</p> <p><span itemscope="itemscope" itemtype="http://schema.org/WebPage" itemref="about copyrightHolder copyrightYear inLanguage publisher">Gregory, D., Johnston, R., Pratt, G. Watts, M.J., and Whatmore, S. 2009&nbsp;<em class="Italic">The Dictionary of Human Geography</em>&nbsp;Malden and Oxford:&nbsp;Wiley-Blackwell</span></p> <p>History of Gold Rush&nbsp;<a target="_blank" href="http://www.bcarchives.gov.bc.ca/exhibits/timemach/galler04/frames/beginning.htm" data-url="http://www.bcarchives.gov.bc.ca/exhibits/timemach/galler04/frames/beginning.htm">http://www.bcarchives.gov.bc.ca/exhibits/timemach/galler04/frames/beginning.htm</a></p> <p>Hoekstra,&nbsp;Gordon 2014. Endako mine effluent affecting aquatic environment in north-central B.C. [WWW Document]. URL <a target="_blank" href="http://www.vancouversun.com/technology/Endako+mine+effluent+affecting+aquatic+environment+north+central/9514940/story.html" data-url="http://www.vancouversun.com/technology/Endako+mine+effluent+affecting+aquatic+environment+north+central/9514940/story.html">http://www.vancouversun.com/technology/Endako+mine+effluent+affecting+aquatic+environment+north+central/9514940/story.html</a> (accessed 7.22.14).</p> <p>Miller, G.T., and Spoolman, S. 2011.&nbsp;<em class="Italic">Living in the Environment: Principles, Connections, and Solutions&nbsp;(17th ed.)</em>. Belmont, CA: Brooks-Cole Publishing.</p> <p>Mining Association of BC (<a target="_blank" href="http://www.mining.bc.ca/mining-facts" data-url="http://www.mining.bc.ca/mining-facts">http://www.mining.bc.ca/mining-facts</a>)</p> <p>White, P., M. Michalowski and P. Cross. 2006. “The west coast boom.”&nbsp;<em class="Italic">Canadian Economic Observer</em>. Vol. 19, no. 5. May. Statistics Canada Catalogue no. 11-010-XIB. (accessed June 11, 2014).</p> <h2>Resources</h2> <ul><li><a href="http://www.sfu.ca/geog/geog351spring09/group01/index.htm" target="_blank" data-url="http://www.sfu.ca/geog/geog351spring09/group01/index.htm">Natural Resources in British Columbia </a></li> <li><a href="http://www.empr.gov.bc.ca/Mining/Sustainability/Documents/SustainableFuture.pdf" target="_blank" data-url="http://www.empr.gov.bc.ca/Mining/Sustainability/Documents/SustainableFuture.pdf">History of Mining in BC</a></li> <li><a href="http://www.empr.gov.bc.ca/Mining/Geoscience/EducationalResources/Documents/Historical_Mine_Sites.pdf" target="_blank" data-url="http://www.empr.gov.bc.ca/Mining/Geoscience/EducationalResources/Documents/Historical_Mine_Sites.pdf">History of Boundary Country and mining in BC </a></li> <li><a href="http://www.mineralsed.ca/i/pdf/MinBCmap_ME.pdf" target="_blank" data-url="http://www.mineralsed.ca/i/pdf/MinBCmap_ME.pdf">Mining in British Columbia Industrial Mineral, Metal and Coal Operations in British Columbia </a></li> <li><a href="http://www.carriersekani.ca" target="_blank" data-url="http://www.carriersekani.ca">Carrier Nation</a></li> </ul> 
	</div>


	</div>

</div>
<div class="part-wrapper" id="part-chapter-6-wrapper">
    <div class="part  " id="part-chapter-6">
	<div class="part-title-wrap">
		<p class="part-number">V</p>
		<h1 class="part-title">5. Food Systems in British Columbia</h1>
	</div>
	<div class="ugc part-ugc">
		<div class="bcc-box bcc-highlight"><h3>Learning Objectives</h3> <ul><li>Critically refine a definition of a food system.</li> <li>Explain the spatial and historical development of food systems in the context of British Columbia.</li> <li>Critically explain controversial issues surrounding the contemporary food system.</li> <li>Produce maps that display information about food system dynamics in the context of British Columbia.</li> <li>Explain sustainable agricultural strategies that respond to global, regional and local challenges.</li> <li>Analytically deploy concepts like (but not limited to) food miles, food deserts, commodity chains, food security, food sovereignty, food justice, agricultural derivatives, bioenergy, genetically modified organisms, permaculture, organic agriculture and sustainable agriculture.</li> </ul> </div> <p>&nbsp;</p>
	</div>
			
				
	</div>
<div class="chapter standard with-subsections" id="chapter-slug-6-2-introduction" title="Introduction">
	<div class="chapter-title-wrap">
		<p class="chapter-number">35</p>
		<h1 class="chapter-title">Introduction</h1>
								</div>
	<div class="ugc chapter-ugc">
				 <p>What is a food system? What type of food systems promote food security? What is the geography of&nbsp;food security? What food products are produced in British Columbia? Where do food products from British Columbia go and why?&nbsp;Why was Atlantic salmon British Columbia’s main agricultural export for 2013?</p> <p>The study of the&nbsp;geography of food systems attempts to answer these and&nbsp;many more questions.</p> <p>This chapter&nbsp;focuses on the concept of food systems.&nbsp;A <strong class="Bold">food system</strong> encompasses cultural foodways in addition to&nbsp;the production, processing, packaging, distribution, marketing, exchange, consumption and disposal or post-consumption treatment of food and food-related items.</p> <p>Food systems&nbsp;encapsulate some of the most basic ways in which humans interact with their environment,&nbsp;including&nbsp;a range of historical agricultural practices. A food systems approach&nbsp;thus&nbsp;allows us to reveal&nbsp;the socio-spatial relations that contextualize&nbsp;practices around food.</p> <p>The British Columbia (BC) food system encompasses diverse&nbsp;cultural foodways from its&nbsp;immigrant populations,&nbsp;some of the most prolific&nbsp;salmon runs in the world,&nbsp;a growing seafood sector, a large&nbsp;animal husbandry sector and a diverse agribusiness food (agrifoods) industry that is highly integrated into the global marketplace.&nbsp;The contemporary BC food system&nbsp;plays a critical role in&nbsp;both regional food security&nbsp;and&nbsp;globalized food regimes characteristic of 21st century agribusiness.</p> 
	</div>


	</div>
<div class="chapter standard with-subsections" id="chapter-slug-6-3-food-systems-in-the-physical-landscape" title="Food Systems in the Physical Landscape">
	<div class="chapter-title-wrap">
		<p class="chapter-number">36</p>
		<h1 class="chapter-title">Food Systems in the Physical Landscape</h1>
								</div>
	<div class="ugc chapter-ugc">
				 <p>British Columbia food systems reflect&nbsp;regional <strong class="Bold">biophysical </strong>factors, human behaviour and the political-economic relations in which food practices have evolved and currently exist. The main biophysical<strong class="Bold">&nbsp;</strong>constraints to human food procurement in BC include&nbsp;landscape features (e.g., slope and elevation), soil fertility, climate, and water availability (both groundwater and precipitation).</p> <p>Geologically speaking, British Columbia is a newcomer to North America, and most of the province has experienced dramatic geologic changes&nbsp;over the last 200 million years.&nbsp;The region as we know it today&nbsp;was&nbsp;created through tectonic movement (e.g., terraine deposition, earthquakes and volcanic eruptions) and climate-influenced, geomorphic processes (episodic glaciation, weathering, erosion and sediment transfer). As a result, BC has a “pointy” landscape with&nbsp;several difficult-to-traverse mountain ranges and relatively few areas of high soil fertility suitable for conventional agricultural practices.</p> <div class="wp-caption aligncenter" id="attachment_812" aria-describedby="caption-attachment-812" style="width: 400px"><a href="http://opentextbc.ca/geography/wp-content/uploads/sites/34/2014/07/Agriculture-Regions-ofBC.gif" data-url="http://opentextbc.ca/geography/wp-content/uploads/sites/34/2014/07/Agriculture-Regions-ofBC.gif"><img class="wp-image-812" alt="Figure 1. Agricultural Regions of British Columbia" src="http://opentextbc.ca/geography/wp-content/uploads/sites/34/2014/07/Agriculture-Regions-ofBC.gif" height="446" width="400" title="" /></a><div class="wp-caption-text" id="caption-attachment-812">Figure 5.1 Agricultural regions of British Columbia</div></div> <p>The highest soil fertility is&nbsp;primarily located in <strong class="Bold">sinuous</strong> <strong class="Bold">river valleys</strong> and deltas much like the Fraser River Valley. In fact, of the province’s 92,250,929-hectare land base, the Canadian Land Inventory estimates that only 5% is suitable for agriculture, 2.7% is capable of growing a reasonable range of crops and 1.1% is prime agricultural land (Smith, 2012).</p> <p>While the geography of soil fertility is severely constrained in BC and largely determinative of the major agricultural regions<span style="color: #ff0000;"></span>, agricultural capability of the land is measured&nbsp;by the <a href="http://sis.agr.gc.ca/cansis/nsdb/cli/index.html" target="_blank" data-url="http://sis.agr.gc.ca/cansis/nsdb/cli/index.html">Canadian Land Inventory</a>,<span class="footnote"><span class="footnote-indirect" data-fnref="123-1"></span></span> which includes soil fertility as just one of many considerations in ranking lands on&nbsp;a seven-class scale as shown in Table 1.</p> <p>Class 1 is prime agricultural land that has no significant limitations and is suitable for most crops while&nbsp;Class 7 is land unsuitable to agriculture. The seven-class scale&nbsp;is modified by 16&nbsp;subclasses that <span style="background-color: #ffffff;">provide&nbsp;information on the kind of management problem or use limits that might exist for agricultural land;&nbsp;for example, erosion (E),&nbsp;excess&nbsp;water (W), salinity (N)&nbsp;and stoniness (P) (see Table 5.2).&nbsp;</span></p> <p>&nbsp;</p> <table style="width: 100%; margin: auto; border-spacing: 0px;" cellpadding="3"><caption>Table 5.1 Land Capability Class for Mineral Soils</caption> <tbody><tr><td><strong class="Bold">Class 1</strong><br /> Class 1 land is capable of producing the very widest range of crops. Soil and climate conditions are optimum, resulting in easy management.</td> </tr> <tr><td><strong class="Bold">Class 2</strong><br /> Class 2 land is capable of producing a wide range of crops. Minor restrictions of soil or climate may reduce capability but pose no major difficulties in management.</td> </tr> <tr><td><strong class="Bold">Class 3</strong><br /> Class 3 land is capable of producing a fairly wide range of crops under good management practices. Soil and/or climate limitations are somewhat restrictive.</td> </tr> <tr><td><strong class="Bold">Class 4</strong><br /> Class 4 land is capable of a restricted range of crops. Soil and climate conditions require special management considerations.</td> </tr> <tr><td><strong class="Bold">Class 5</strong><br /> Class 5 land is capable of production of cultivated perennial forage crops and specially adapted crops. Soil and/or climate conditions severely limit capability.</td> </tr> <tr><td><strong class="Bold">Class 6</strong><br /> Class 6 land is important in its natural state as grazing land. These lands cannot be cultivated due to soil and/or climate limitations.</td> </tr> <tr><td><strong class="Bold">Class 7</strong><br /> Class 7 land has no capability for soil bound agriculture.</td> </tr> </tbody> </table> <p>&nbsp;</p> <table style="width: 100%; margin: auto; border-spacing: 0px;" cellpadding="3"><caption>Table 5.2 Land Capability Subclasses for Mineral Soils</caption> <tbody><tr><td><strong class="Bold">A </strong></td> <td>Soil moisture deficiency</td> <td><strong class="Bold">M</strong></td> <td>Soil moisture deficiency</td> </tr> <tr><td><strong class="Bold">B</strong></td> <td>Wood in the profile</td> <td><strong class="Bold">N</strong></td> <td>Salinity</td> </tr> <tr><td><strong class="Bold">C</strong></td> <td>Adverse climate<br /> (excluding precipitation)</td> <td><strong class="Bold">P</strong></td> <td>Stoniness</td> </tr> <tr><td><strong class="Bold">D</strong></td> <td>Undesirable soil structure</td> <td><strong class="Bold">R</strong></td> <td>Shallow soil over bedrock and/or bedrock outcroppings</td> </tr> <tr><td><strong class="Bold">E</strong></td> <td>Erosion</td> <td><strong class="Bold">T</strong></td> <td>Topography</td> </tr> <tr><td><strong class="Bold">F</strong></td> <td>Fertility</td> <td><strong class="Bold">W</strong></td> <td>Excess water<br /> (groundwater)</td> </tr> <tr><td><strong class="Bold">I</strong></td> <td>Inundation<br /> (flooding by streams, etc.)</td> <td><strong class="Bold">Z</strong></td> <td>Permafrost</td> </tr> <tr><td><strong class="Bold">L</strong></td> <td>Degree of decomposition- permeability</td> <td><strong class="Bold">H</strong></td> <td>Depth of organic soil over bedrock and/or rockiness</td> </tr> </tbody> </table> <h2>Frost-Free Days</h2> <p>The interaction of landscape with climate also leads to&nbsp;major constraints to the expansion of agriculture in BC. The number of frost-free days and growing degree days determines what kind of crops can be expected to successfully grow in different geographic regions. Frost-free days decline as elevation and latitude increase as shown in Figure 2.</p> <div class="wp-caption aligncenter" id="attachment_121" aria-describedby="caption-attachment-121" style="width: 400px"><a href="http://opentextbc.ca/geography/wp-content/uploads/sites/34/2014/06/gill_frost_free-BLUE-04-e1406226158368.png" data-url="http://opentextbc.ca/geography/wp-content/uploads/sites/34/2014/06/gill_frost_free-BLUE-04-e1406226158368.png"><img class="wp-image-121" alt="Figure 2. British Columbia Frost Free Days" src="http://opentextbc.ca/geography/wp-content/uploads/sites/34/2014/06/gill_frost_free-BLUE-04-e1406226158368.png" height="379" width="400" title="" /></a><div class="wp-caption-text" id="caption-attachment-121">Figure 5.2 British Columbia frost-free days</div></div> <h2></h2> <h2>Water Accessibility</h2> <p>Water accessibility is also a factor in the success of agriculture. In many areas of the province, such as the semi-arid Okanagan valley,&nbsp;precipitation and&nbsp;groundwater resources are combined with irrigation technology to increase the water availability of crops. As much of the agricultural lands occur in river deltas and floodplains, there is also sometimes a need to pump excess&nbsp;water out of fertile soils.</p> <div class="wp-caption aligncenter" id="attachment_120" aria-describedby="caption-attachment-120" style="width: 400px"><a href="http://opentextbc.ca/geography/wp-content/uploads/sites/34/2014/06/OsoyoosBC-e1406226353430.jpg" data-url="http://opentextbc.ca/geography/wp-content/uploads/sites/34/2014/06/OsoyoosBC-e1406226353430.jpg"><img class="wp-image-120" alt="Figure 2. Osoyoos in BC, Canada" src="http://opentextbc.ca/geography/wp-content/uploads/sites/34/2014/06/OsoyoosBC-e1406226353430.jpg" height="300" width="400" title="" /></a><div class="wp-caption-text" id="caption-attachment-120">Figure 5.3 The town of Osoyoos, British Columbia, sits at the southern end of the&nbsp; semi-arid Okanagan valley</div></div> <p>&nbsp;</p> <div class="wp-caption aligncenter" id="attachment_122" aria-describedby="caption-attachment-122" style="width: 400px"><a href="http://opentextbc.ca/geography/wp-content/uploads/sites/34/2014/06/fig2_e.jpg" data-url="http://opentextbc.ca/geography/wp-content/uploads/sites/34/2014/06/fig2_e.jpg"><img class="wp-image-122" alt="Figure 4. Annual precipitation in British Columbia." src="http://opentextbc.ca/geography/wp-content/uploads/sites/34/2014/06/fig2_e.jpg" height="327" width="400" srcset="https://opentextbc.ca/geography/wp-content/uploads/sites/34/2014/06/fig2_e.jpg 529w, https://opentextbc.ca/geography/wp-content/uploads/sites/34/2014/06/fig2_e-300x244.jpg 300w, https://opentextbc.ca/geography/wp-content/uploads/sites/34/2014/06/fig2_e-65x53.jpg 65w, https://opentextbc.ca/geography/wp-content/uploads/sites/34/2014/06/fig2_e-225x183.jpg 225w, https://opentextbc.ca/geography/wp-content/uploads/sites/34/2014/06/fig2_e-350x285.jpg 350w" sizes="auto, (max-width: 400px) 100vw, 400px" title="" /></a><div class="wp-caption-text" id="caption-attachment-122">Figure 5.4 Annual precipitation in British Columbia</div></div> <h2>Attributions</h2> <ul><li><strong>Figure 5.1</strong> Agricultural Regions of British Columbia from 2011 Census of Agriculture, BC Ministry of Agriculture, <a href="http://www.agf.gov.bc.ca/stats/Census/2011AgriCensusBCHighlights.pdf" target="_blank" data-url="http://www.agf.gov.bc.ca/stats/Census/2011AgriCensusBCHighlights.pdf">http://www.agf.gov.bc.ca/stats/Census/2011AgriCensusBCHighlights.pdf</a><strong><br /> </strong></li> <li><strong>Figure 5.2</strong> British Columbia frost-free days. Map of frost-free days by Hilda Anggraeni is an adaptation from the British Columbia Ministry of Agriculture (<a href="http://www.agf.gov.bc.ca/resmgmt/maps/frostfre.jpg" target="_blank" data-url="http://www.agf.gov.bc.ca/resmgmt/maps/frostfre.jpg">http://www.agf.gov.bc.ca/resmgmt/maps/frostfre.jpg</a>) and Natural Resources Canada (<a href="http://atlas.nrcan.gc.ca/site/english/maps/reference/index.html#outlinecanada" target="_blank" data-url="http://atlas.nrcan.gc.ca/site/english/maps/reference/index.html#outlinecanada">http://atlas.nrcan.gc.ca/site/english/maps/reference/index.html#outlinecanada</a>) licensed under CC-BY &nbsp;3.0 (<a href="https://creativecommons.org/licenses/by/3.0/" target="_blank" data-url="https://creativecommons.org/licenses/by/3.0/">https://creativecommons.org/licenses/by/3.0/</a>).</li> <li><strong>Figure 5.3</strong> The town of Osoyoos, British Columbia is in the Public Domain <a href="https://en.wikipedia.org/wiki/Osoyoos#mediaviewer/File:OsoyoosBC.JPG" target="_blank" data-url="https://en.wikipedia.org/wiki/Osoyoos#mediaviewer/File:OsoyoosBC.JPG">https://en.wikipedia.org/wiki/Osoyoos#mediaviewer/File:OsoyoosBC.JPG</a></li> <li><strong>Figure 5.4</strong> Annual precipitation in British Columbia adapted from Impacts to Adaptation: Canada in a Changing Climate, Ch. 8, Figure 2 (<a href="www.nrcan.gc.ca/environment/resources/publications/impacts-adaptation/reports/assessments/2008/10253" target="_blank" data-url="www.nrcan.gc.ca/environment/resources/publications/impacts-adaptation/reports/assessments/2008/10253">www.nrcan.gc.ca/environment/resources/publications/impacts-adaptation/reports/assessments/2008/10253</a>) by the Government of Canada Natural Resources and used under the non-commercial terms of license located at <a href="http://www.nrcan.gc.ca/terms-conditions/10847%20" target="_blank" data-url="http://www.nrcan.gc.ca/terms-conditions/10847%20">http://www.nrcan.gc.ca/terms-conditions/10847 </a>.</li> </ul> 
	</div>
			
				
				<div class="footnotes"><div id='123-1'>
<p>Canadian Land Inventory <a href="http://sis.agr.gc.ca/cansis/nsdb/cli/index.html" target="_blank" data-url="http://sis.agr.gc.ca/cansis/nsdb/cli/index.html">http://sis.agr.gc.ca/cansis/nsdb/cli/index.html</a></p>

</div></div>
	</div>
<div class="chapter standard with-subsections" id="chapter-slug-6-4-food-systems-in-british-columbia" title="Food Systems in British Columbia">
	<div class="chapter-title-wrap">
		<p class="chapter-number">37</p>
		<h1 class="chapter-title">Food Systems in British Columbia</h1>
								</div>
	<div class="ugc chapter-ugc">
				 <h2>Indigenous Foodways</h2> <p>The first human food systems in British Columbia were primarily based on hunting,&nbsp;gathering and cultivating root crops (Turner &amp;&nbsp; Turner, 2008).&nbsp;The ancestors of&nbsp;First Nations peoples often practised&nbsp;periodic migration to take advantage of seasonal resources, including the abundant salmon runs and a number&nbsp;of native seasonal fruits.</p> <div class="wp-caption aligncenter" id="attachment_124" aria-describedby="caption-attachment-124" style="width: 600px"><a href="http://opentextbc.ca/geography/wp-content/uploads/sites/34/2014/06/08_8a_map-e1406237612832.jpg" data-url="http://opentextbc.ca/geography/wp-content/uploads/sites/34/2014/06/08_8a_map-e1406237612832.jpg"><img class="wp-image-124" alt="Figure 1. Indigenous Food Gathering Map" src="http://opentextbc.ca/geography/wp-content/uploads/sites/34/2014/06/08_8a_map-e1406237612832.jpg" height="387" width="600" title="" /></a><div class="wp-caption-text" id="caption-attachment-124">Figure 5.5 Indigenous food-gathering map shows the geographic layout of villages, tribal watersheds and food-gathering locations before European contact</div></div> <p>Indigenous food systems&nbsp;also included the cultivation and gathering of root crops such as springbank clover, Pacific silverweed, northern rice root, and Nootka lupine (Turner, 1995).</p> <div class="wp-caption aligncenter" id="attachment_1301" aria-describedby="caption-attachment-1301" style="width: 400px"><a href="http://opentextbc.ca/geography/wp-content/uploads/sites/34/2014/09/FoodPlants.jpg" data-url="http://opentextbc.ca/geography/wp-content/uploads/sites/34/2014/09/FoodPlants.jpg"><img src="http://opentextbc.ca/geography/wp-content/uploads/sites/34/2014/09/FoodPlants.jpg" alt="Fig 5.6 Indigenous food systems also included the cultivation and gathering of root crops such as (top left) springbank clover (top right) pacific silverweed (bottom left) northern rice root (bottom right) nootka lupine" class="wp-image-1301" height="287" width="400" srcset="https://opentextbc.ca/geography/wp-content/uploads/sites/34/2014/09/FoodPlants.jpg 800w, https://opentextbc.ca/geography/wp-content/uploads/sites/34/2014/09/FoodPlants-300x214.jpg 300w, https://opentextbc.ca/geography/wp-content/uploads/sites/34/2014/09/FoodPlants-65x46.jpg 65w, https://opentextbc.ca/geography/wp-content/uploads/sites/34/2014/09/FoodPlants-225x161.jpg 225w, https://opentextbc.ca/geography/wp-content/uploads/sites/34/2014/09/FoodPlants-350x250.jpg 350w" sizes="auto, (max-width: 400px) 100vw, 400px" title="" /></a><div class="wp-caption-text" id="caption-attachment-1301">Fig 5.6 Indigenous food systems also included the cultivation and gathering of root crops such as (top left) springbank clover (top right) pacific silverweed (bottom left) northern rice root (bottom right) nootka lupine</div></div> <p>This food system relied on populations moving to find&nbsp;food sources around&nbsp;coastal areas or&nbsp;interior locations usually within a constrained geographic region.</p> <h2>Introduction of European Agricultural Practices and Foodways</h2> <p>The settlement of European communities in BC led to the displacement of indigenous food systems through the destruction of indigenous food resources (e.g., <strong class="Bold">tubers</strong> and native crabapples), constraints to the movement of indigenous peoples, and the introduction of new crops and agricultural methods&nbsp;(Turner &amp;&nbsp;Turner, 2008).</p> <p>The expansion of European agriculture was largely a function of the&nbsp; settlement following the gold rush in the 19th century. As the gold rush expanded through the Interior, entrepreneurs saw an opportunity to begin&nbsp;cattle ranching in locations like Coldstream, which were ideally placed in grasslands&nbsp;relatively close to gold mining communities. Land developers soon followed in the Interior, creating&nbsp;small parcels of land in pre-planned communities with names like Summerland and Peachland — parcels that would be advertised as a “British Garden of Eden” to new settlers and potential investors from Europe.</p> <p>In addition,&nbsp;many other immigrant communities often took&nbsp;up agricultural production in their first generation. For example, Doukhobors near Grand Forks and&nbsp;Sikh communities throughout the Lower Mainland represent&nbsp;historical immigrant enclaves that continue to practise agriculture as their primary source of income. Much of the growth of agriculture was oriented toward internal markets until the expanded use of canning and the requirements for food exports during the two world wars.</p> <p>Contemporary agriculture in&nbsp;BC plays several roles:&nbsp;it is a major economic sector that employs over 300,000 people (in agriculture, fishing, manufacturing and food services), it has a multiplier effect on regional economies, it provides&nbsp;ecosystem services and it defines cultural landscapes in several areas where regional identity has become tied to agricultural livelihood.</p> <p>The increases in export-oriented,&nbsp;agricultural production has increased pressures on&nbsp;BC’s natural resources such as&nbsp;fresh water, fertile soils and wild animal populations.</p> <h2>The Contemporary Food System</h2> <p>The globally integrated agrifoods industry&nbsp;includes primary production in agriculture, aquaculture and commercial&nbsp;fisheries, and processing of food and beverages. Over 200 primary agriculture products and over 100 species of fish, shellfish and marine plants are produced in BC. The food and beverage processing industry is the largest manufacturing industry in the province with almost&nbsp;1,400 small- and medium-sized firms.</p> <p>The 2011 Canadian Agricultural Census shows that&nbsp;the province’s 19,759 farms (9.6% of all farms in Canada) produced $2.9 billion&nbsp;(5.8% of all Canadian&nbsp;gross farm receipts) on 2,611,382 hectares (4% of the Canadian agricultural lands).</p> <p>In 2012, the agrifoods industry had sales of $11.7 billion with primary production agriculture at $2.8 billion, aquaculture and commercial fisheries at $0.7 billion and food and beverage manufacturers at $8.2 billion.</p> <p>In 2013, the entire agrifood industry&nbsp;and&nbsp;BC producers exported over $2.7 billion of agrifoods&nbsp;products to more than 140 markets. The top exports were&nbsp;farmed Atlantic salmon&nbsp;at $267 million and “food preparations for manufacturing”&nbsp;at $190 million. Over $1.8 billion (68%)&nbsp;of all agrifoods exports in 2013 went to the United States, though the most rapid agrifood export growth from 2012 to 2013&nbsp;was oriented across the Pacific to&nbsp;the Philippines ($21 million, increasing by 42%), China ($234 million, increasing by 38%), and Japan&nbsp;($174 million, increasing by 13%). In 2013,&nbsp;BC&nbsp;led&nbsp;Canada in sales&nbsp;of agricultural products like blueberries, sweet cherries, raspberries, pears, apricots, brussel sprouts and rhubarb. In&nbsp;addition, it was&nbsp;the secon- highest producer for 17 other agricultural commodities.</p> <div class="wp-caption aligncenter" id="attachment_129" aria-describedby="caption-attachment-129" style="width: 500px"><a href="http://opentextbc.ca/geography/wp-content/uploads/sites/34/2014/06/topExport-01-e1406238578872.png" data-url="http://opentextbc.ca/geography/wp-content/uploads/sites/34/2014/06/topExport-01-e1406238578872.png"><img class="wp-image-129" alt="Figure 6. Top BC Agrifoods Exports in 2013" src="http://opentextbc.ca/geography/wp-content/uploads/sites/34/2014/06/topExport-01-e1406238578872.png" height="531" width="500" title="" /></a><div class="wp-caption-text" id="caption-attachment-129">Figure 5.7 Top BC agrifoods exports in 2013</div></div> <p>&nbsp;</p> <div class="wp-caption aligncenter" id="attachment_130" aria-describedby="caption-attachment-130" style="width: 500px"><a href="http://opentextbc.ca/geography/wp-content/uploads/sites/34/2014/06/top6BCfoodExport-e1406238642178.png" data-url="http://opentextbc.ca/geography/wp-content/uploads/sites/34/2014/06/top6BCfoodExport-e1406238642178.png"><img class="wp-image-130" alt="Figure 7. Top 6 BC Agrifoods Exports in 2013" src="http://opentextbc.ca/geography/wp-content/uploads/sites/34/2014/06/top6BCfoodExport-e1406238642178.png" height="253" width="500" title="" /></a><div class="wp-caption-text" id="caption-attachment-130">Figure 5.8 Top six BC agrifoods exports in 2013</div></div> <h2>Growth in Viticulture</h2> <p>Among the major growth industries within the&nbsp;BC food system&nbsp;is a rapidly expanding wine industry. Between 2006 and 2011, Statistics Canada estimates that the number of grape growers increased 42% from 686&nbsp;to 965, and that&nbsp;9,169 hectares were dedicated to grape growing. Another 2011&nbsp;survey supported by the BC&nbsp;Wine Institute and&nbsp;BC&nbsp;Grape Growers&nbsp;estimated that there were 210 licensed wineries, 705 grape growers and 864 vineyards that covered 9,867 hectares. According to this second&nbsp;study, the wine growing land&nbsp;was distributed&nbsp;in the Okanagan Valley (81.7%), Similkameen (7%), coastal areas (8.3%), and other areas (3%).</p> <h2>Food Distribution and Cost</h2> <p>Despite increasing production in staple foods and growth in the commodities like wine, many BC families have increasing difficulty managing a budget that allows them to access foods that&nbsp;meet the requirements of&nbsp;a healthy diet.&nbsp;In 2011, the average monthly cost for&nbsp;the&nbsp;nutritious food basket (for a&nbsp;family of four) in BC was estimated by the Dietitians of Canada to be&nbsp;$868.43. BC’s 91 food banks assisted 90,193 individuals in&nbsp;2010-2011. Of this amount 31.8% were children and youth and&nbsp;45.1% were women. As well,&nbsp;16.4% of households receiving food had income from current or recent employment, 14.7% of food bank users identified as Aboriginal,&nbsp;and 76.1% lived in non-subsidized housing.</p> <p>Food distribution in BC is linked to the large supermarket chain stores (e.g.,&nbsp;Save-On Foods,&nbsp;Real Canadian Superstore) that sell primarily imported food, though local retail chains like Askew’s (in Salmon Arm), farm gate sales, and farmers’ markets are firmly established as alternative distribution mechanisms throughout the province.</p> <h2>Attributions</h2> <ul><li><strong>Figure 5.5</strong>. Indigenous food-gathering Map Carlson, K.T., Duffield, C., McHalsie, A.J., Perrier, J., Rhodes,L.,Schaepe, D.M., Smith, D.A. &amp; Sto:lo Heritage Trust 2001, A Stó:l?-Coast Salish historical atlas, Douglas &amp; McIntyre, Chilliwack, B.C. Page 24-25 is licensed under&nbsp;CC BY-NC-ND 4.0 (<a href="http://creativecommons.org/licenses/by-nc-nd/4.0/" target="_blank" data-url="http://creativecommons.org/licenses/by-nc-nd/4.0/">http://creativecommons.org/licenses/by-nc-nd/4.0/</a>).</li> <li><strong>Figure 5.6</strong> Indigenous food systems is comprised of the following images: <ul><li>Aspringbank clover Clover hiding a yellow flower (<a href="https://www.flickr.com/photos/12567713@N00/1351673683/" target="_blank" data-url="https://www.flickr.com/photos/12567713@N00/1351673683/">https://www.flickr.com/photos/12567713@N00/1351673683/</a>) by Tom Brandt (<a href="https://www.flickr.com/photos/12567713@N00/" target="_blank" data-url="https://www.flickr.com/photos/12567713@N00/">https://www.flickr.com/photos/12567713@N00/</a>) is licensed under CC BY 3.0 (<a href="https://creativecommons.org/licenses/by/3.0/" target="_blank" data-url="https://creativecommons.org/licenses/by/3.0/">https://creativecommons.org/licenses/by/3.0/</a>).</li> <li>Pacific Silverweed Rosaceae – Potentilla anserina ssp. pacifica – PACIFIC SILVERWEED/cinquefoil DS (<a href="https://www.flickr.com/photos/tcorelli/14061345418/in/photolist-fCwc7a-bjxGNi-a3RmMC-nGRtqC-nqy56Y" target="_blank" data-url="https://www.flickr.com/photos/tcorelli/14061345418/in/photolist-fCwc7a-bjxGNi-a3RmMC-nGRtqC-nqy56Y">https://www.flickr.com/photos/tcorelli/14061345418/in/photolist-fCwc7a-bjxGNi-a3RmMC-nGRtqC-nqy56Y</a>) by Toni Corelli (<a href="https://www.flickr.com/photos/tcorelli/" target="_blank" data-url="https://www.flickr.com/photos/tcorelli/">https://www.flickr.com/photos/tcorelli/</a>) is licensed under CC BY-NC 2.0 (<a href="https://creativecommons.org/licenses/by-nc/2.0/" target="_blank" data-url="https://creativecommons.org/licenses/by-nc/2.0/">https://creativecommons.org/licenses/by-nc/2.0/</a>)</li> <li>Northern rice root Black Lily at Trail Bay, BC (<a href="https://www.flickr.com/photos/adavey/3053916172/)%20by Alan (https://www.flickr.com/photos/adavey/" target="_blank" data-url="https://www.flickr.com/photos/adavey/3053916172/)%20by Alan (https://www.flickr.com/photos/adavey/">https://www.flickr.com/photos/adavey/3053916172/) by Alan (https://www.flickr.com/photos/adavey/</a>) is licensed under CC BY 2.0 (<a href="https://creativecommons.org/licenses/by/2.0/" target="_blank" data-url="https://creativecommons.org/licenses/by/2.0/">https://creativecommons.org/licenses/by/2.0/</a>).</li> <li>Nootka lupine <a href="//www.flickr.com/photos/14601516@N00/" target="_blank" data-url="//www.flickr.com/photos/14601516@N00/">(https://www.flickr.com/photos/14601516@N00/3758658488/) by JPC Raleigh (https://www.flickr.com/photos/14601516@N00/</a>) is licensed under CC BY NC <a href="//creativecommons.org/licenses/by-nc/2.0/" target="_blank" data-url="//creativecommons.org/licenses/by-nc/2.0/">(https://creativecommons.org/licenses/by-nc/2.0/</a>).</li> </ul> </li> <li><strong>Figure 5.7</strong> Top BC Agrifoods Exports in 2013 derived from <a style="color: #880088;" href="http://www.agf.gov.bc.ca/stats/Export/2013BCAgrigoodsExportHighlights.pdf" target="_blank" data-url="http://www.agf.gov.bc.ca/stats/Export/2013BCAgrigoodsExportHighlights.pdf">2013 BC Agrifoods Export Highlights</a>&nbsp;(<a href="http://www.agf.gov.bc.ca/stats/Export/2013BCAgrigoodsExportHighlights.pdf" target="_blank" data-url="http://www.agf.gov.bc.ca/stats/Export/2013BCAgrigoodsExportHighlights.pdf">http://www.agf.gov.bc.ca/stats/Export/2013BCAgrigoodsExportHighlights.pdf</a>)</li> <li><strong>Figure 5.8</strong> Top six BC agrifoods exports in 2013 by Hilda Anggraeni derived from <a style="color: #880088;" href="http://www.agf.gov.bc.ca/stats/Export/2013BCAgrigoodsExportHighlights.pdf" target="_blank" data-url="http://www.agf.gov.bc.ca/stats/Export/2013BCAgrigoodsExportHighlights.pdf">2013 BC Agrifoods Export Highlights</a>&nbsp;(<a href="http://www.agf.gov.bc.ca/stats/Export/2013BCAgrigoodsExportHighlights.pdf" target="_blank" data-url="http://www.agf.gov.bc.ca/stats/Export/2013BCAgrigoodsExportHighlights.pdf">http://www.agf.gov.bc.ca/stats/Export/2013BCAgrigoodsExportHighlights.pdf</a>)</li> </ul> 
	</div>


	</div>
<div class="chapter standard with-subsections" id="chapter-slug-6-5-confronting-the-frontiers" title="Confronting the Frontiers">
	<div class="chapter-title-wrap">
		<p class="chapter-number">38</p>
		<h1 class="chapter-title">Confronting the Frontiers</h1>
								</div>
	<div class="ugc chapter-ugc">
				 <p>The contemporary food system has pushed the edge of agriculture in many ways. The expansion of agriculture in tandem with rapid population growth and urbanization has led to many agriculture-urban conflicts. The case study on the Agricultural Land Reserve details policy responses to these agricultural-urban conflicts.</p> <p>In addition, recent concern over the geographic expansion of genetically engineered agricultural products (or genetically modified organisms; GMOs) such as alfalfa and the <strong class="Bold">Arctic apple</strong> have led to protests for labelling foods and for applying the <a target="_blank" href="http://ec.europa.eu/food/food/foodlaw/precautionary/index_en.htm" data-url="http://ec.europa.eu/food/food/foodlaw/precautionary/index_en.htm">Precautionary Principle</a> (a principle that should be applied to the use of genetically modified (GM) food crops concerning human health) to further adoption in order to limit impacts on organic farms.</p> <p>The increased attention to food system issues in BC has led to a number of political and social trends aimed at changing our understanding of food systems:</p> <ul><li>The <a href="https://en.wikipedia.org/wiki/The_100-Mile_Diet" data-url="https://en.wikipedia.org/wiki/The_100-Mile_Diet"><strong class="Bold">100-mile diet</strong></a>,<span class="footnote"><span class="footnote-indirect" data-fnref="132-1"></span></span> which originated in the Lower Mainland, challenges adopters to eat locally (within 100 miles of their home).</li> <li>There is&nbsp;increasing attention on providing better access to seed sources and a variety of seeds through local seed companies.</li> <li>The number of organic&nbsp;producers has increased over the last 20 years.</li> <li>Province-wide food organizations such as the <strong class="Bold"><a href="http://bcfsn.org/" target="_blank" data-url="http://bcfsn.org/">BC Food Systems Network</a> (BCFSN)</strong><span class="footnote"><span class="footnote-indirect" data-fnref="132-2"></span></span> and more local food policy councils challenge municipal governments to adopt strategies and plans to support local food security – often through support for urban agriculture.</li> <li>The movement toward urban agriculture has led to some innovative work in social justice by organizations such as <strong class="Bold">Sole Foods&nbsp;</strong>&nbsp;<span class="footnote"><span class="footnote-indirect" data-fnref="132-3"></span></span> and small entrepreneurs engaged in alternative production methods such as <strong class="Bold">SPIN-farming (s-mall p-lot in-tensive)</strong>.</li> <li>Groups such&nbsp;the <a href="http://youngagrarians.org/" target="_blank" data-url="http://youngagrarians.org/"><strong class="Bold">Young Agrarians</strong></a><span class="footnote"><span class="footnote-indirect" data-fnref="132-4"></span></span> seek alternative ways for young people to access farmland in those&nbsp;regions where access is difficult because of&nbsp;the high cost of entry (due to&nbsp;both limited amounts of land and speculative dynamics of land markets).</li> </ul> 
	</div>
			
				
				<div class="footnotes"><div id='132-1'>
<p>100 Mile Diet <a href="https://en.wikipedia.org/wiki/The_100-Mile_Diet" target="_blank" data-url="https://en.wikipedia.org/wiki/The_100-Mile_Diet">https://en.wikipedia.org/wiki/The_100-Mile_Diet</a></p>

</div><div id='132-2'>
<p>BC Food Systems Network <a href="http://bcfsn.org" target="_blank" data-url="http://bcfsn.org">http://bcfsn.org </a></p>

</div><div id='132-3'>
<p>Sole Foods website <a href="http://solefoodfarms.com" target="_blank" data-url="http://solefoodfarms.com">http://solefoodfarms.com</a></p>

</div><div id='132-4'>
<p>Young Agrarians website <a href="http://youngagrarians.org" target="_blank" data-url="http://youngagrarians.org">http://youngagrarians.org</a></p>

</div></div>
	</div>
<div class="chapter standard with-subsections" id="chapter-slug-6-6-case-studies" title="Case Study 1: The Agricultural Land Reserve (ALR)">
	<div class="chapter-title-wrap">
		<p class="chapter-number">39</p>
		<h1 class="chapter-title">Case Study 1: The Agricultural Land Reserve (ALR)</h1>
								</div>
	<div class="ugc chapter-ugc">
				 <p>The&nbsp;<strong class="Bold">Agricultural Land Reserve (ALR)</strong>&nbsp;is a provincial land-use zone that recognizes&nbsp;agriculture as the priority use for approximately 4.6% of the land base of British Columbia (ALC, 2013). Established under&nbsp;the provincial Land Commission Act of 1973, the ALR is one of the earliest examples in North America using&nbsp;regional zoning laws to permanently preserve farmland and promote local food production.</p> <p>The ALR is administered by the <a href="http://www.landcommission.gov.bc.ca/" target="_blank" data-url="http://www.landcommission.gov.bc.ca/">Agricultural Land Commission</a> (ALC),<span class="footnote"><span class="footnote-indirect" data-fnref="136-1"></span></span>&nbsp;an independent administrative tribunal that currently consists of no less than seven appointed members including a chair and members representing six regional panels. The purpose of the ALC is to preserve agricultural land; to encourage farming on agricultural land in collaboration with other communities of interest; and to encourage local governments, First Nations, the government and its agents to enable and accommodate farm use of agricultural land and uses compatible with agriculture in their plans, bylaws and policies. The ALC reviews all applications for exclusion, inclusion, subdivision and non-farm use applications under the Agricultural Land Commission Act of 2002 and ALR regulations.</p> <p>ALR regulations outright permit many farming activities such as raising livestock, creating greenhouses and producing poultry, dairy, horticultural plants, vegetables, grains and tree fruits. ALR regulations allow local governments to restrict but not prohibit other uses such as farm retail sales, storing, packing and processing, agroforestry, timber production, equestrian facilities and compost production. ALR regulations also outline permitted non-farm uses that can be prohibited by local governments such as&nbsp;<strong class="Bold">agritourism</strong>&nbsp;accommodation, temporary saw mills, pet kennels and breeding facilities, education and research, and road construction with right-of-way.</p> <h2>Geography of the ALR</h2> <p>When first delineated, the ALR was estimated to include 4,716,516 hectares. As of April 2013, the ALR includes approximately 4,621,700 hectares&nbsp;consisting of both private and Crown (federal and provincial) lands. The ALR is distributed over six administrative regions:</p> <ol><li>North (2,210,783 hectares, 49%)</li> <li>Interior (1,528,968 hectares, 33%)</li> <li>Kootenay (392,557 hectares, 8%)</li> <li>Okanagan (224,977 hectares, 5%)</li> <li>South Coast (148,207 hectares, 3%)</li> <li>Island (116,207 hectares, 2%) (ALC 2013)</li> </ol> <div class="wp-caption aligncenter" id="attachment_133" aria-describedby="caption-attachment-133" style="width: 400px"><a href="http://opentextbc.ca/geography/wp-content/uploads/sites/34/2014/06/britta_ALR-05-e1406239824929.png" data-url="http://opentextbc.ca/geography/wp-content/uploads/sites/34/2014/06/britta_ALR-05-e1406239824929.png"><img class="wp-image-133" alt="Figure 1. British Columbia Agricultural Land Reserve" src="http://opentextbc.ca/geography/wp-content/uploads/sites/34/2014/06/britta_ALR-05-e1406239824929.png" height="286" width="400" title="" /></a><div class="wp-caption-text" id="caption-attachment-133">Figure 5.9 British Columbia Agricultural Land Reserve</div></div> <h2>Establishing the ALR</h2> <p>Urban sprawl poses many challenges to agricultural land preservation and local food production, particularly in environments that have limited land suitable for agriculture. In BC, only 5% of the land base is considered suitable for agriculture and 2.7% capable of growing a reasonable range of crops (lands ranked as Class 1 through 4 by the Canadian Land Inventory) (Smith, 2012). Prime agricultural lands (1.1% of provincial land base) are often located in narrow valleys near densely populated urban areas and subject to heavy competition with other development uses.</p> <p>It is estimated that in the early 1970s, up to 6,000 hectares of farmland was annually lost to urban sprawl (Smith, 2012). Increasing public awareness of the threat of urban sprawl to scarce farmland led directly to the creation of the ALR. In 1973, Minister of Resources Robert Williams championed a plan to pursue regional land use zoning as economically less costly than the purchase of development rights or agricultural lands outright (Petter, 1985).</p> <p>By 1976, delineation was completed by the commission and 28 regional districts. ALR boundary delineation focused on including&nbsp;agricultural lands ranked as CLI Classes 1 to 4. In 1978, an audit found that approximately 53% of the lands in the ALR fell into these classes:</p> <ul><li>Class 1 (1.1%)</li> <li>Class 2 (6.3%)</li> <li>Class 3 (15%)</li> <li>Class 4 (30.6%)</li> <li>Class 5 (31.9%)</li> <li>Class 6 (9.4%)</li> <li>Class 7 (3.6%)</li> <li>Water (1.9%)</li> </ul> <p>The fact that there was more water (88,890 hectares) than Class 1 land (52,920 hectares) indicates the scarcity of prime agricultural lands in BC. Marginal lands were included in the ALR for several technical reasons. Some marginal lands were active agricultural lands (e.g., rangelands and land used for the production of cranberries or blueberries), and other marginal lands could not be spatially disaggregated without impacting higher class lands. The Canadian Land Inventory provided a rough estimate of field conditions (original map scales were at 1:50,000), and aligning existing legal boundaries for private properties with the distribution of high-quality lands was not feasible given the commission’s timeframe, mandate and resources.</p> <p>In 1983, the creation of the&nbsp;<strong class="Bold">Land Capability Classification System for Agriculture in British Columbia</strong>&nbsp;(which uses a similar classification scheme to the CLI) allowed the ALC to have more detailed estimates of agricultural potential of BC lands, though the CLI continues to be used in areas not covered by this more detailed analysis. Despite the emphasis on Class 1 to 4 lands in the creation of the ALR, these rankings are only one aspect of defining agricultural lands. When judging proposed changes to the ALR, the ALC examines the agricultural potential of the parcel and surrounding lands by looking at agriculture capability ratings in addition to factors related to productivity, yield and suitability.</p> <h2>Governance of the ALR</h2> <p>Since 1973, several legislative changes have impacted the administration of the ALR, though the central mission to permanently preserve agricultural lands has remained intact. In 1977, the ALC was relieved of the responsibility for land banks, greenbelts and parklands in order to focus attention on agricultural land preservation. In addition, public hearings were required for exclusion applications from regional districts and municipalities, and appeals to ALC decisions were to be made to Cabinet. In 1988, regulatory changes resulted in golf courses being classified as a permitted use of agricultural land, which&nbsp;resulted&nbsp;in 181 applications (120 of which moved forward). In the 1990s, changes included:</p> <ul><li>A&nbsp;moratorium on golf course development</li> <li>Changes to the ALC decision appeal processes (requiring that Cabinet refer appeals to a board or commissioner)</li> <li>Implementation of a vague “provincial interest” clause that allowed Cabinet significant interpretative leeway and became a serious controversy in the 1999&nbsp;<strong class="Bold">Six Mile Ranch judgment</strong></li> <li>The merging of the ALC with the Forest Land Commission</li> </ul> <p>In 2002, the Agricultural Land Commission Act (ALCA)&nbsp;removed&nbsp;forestry land management duties from the ALC and reorganized the commission into a 19-person committee with a chair and six regional panels of three people each. In the ALC strategic plan for 2003, the ALC introduced the idea that exclusion of land from the ALR could be approved based on “community need” and “net benefit” to agriculture. Pro-ALR citizens and organizations like the&nbsp;<strong class="Bold">Suzuki Foundation</strong>&nbsp;highlighted these new terms as a concern and challenged them as contravening the ALCA (Campbell, 2006).</p> <h2>Future of the ALR</h2> <p>In 2010, the BC Auditor General and ALC Chair Richard Bullock released complimentary reports that analyzed the ALC and ALR. These reports noted that despite funding challenges and legislative changes, the ALR had been largely successful in preserving agricultural lands. As well, they noted that the ALC required transformation and increased funding in order to meet its mandate and to continue to effectively administer the ALR.</p> <p>In 2011, the provincial government made a one-time increase to the annual ALC budget and committed to $4 million in additional funding until 2015. In addition, the ALC began to undertake a ALR boundary review that would ensure:</p> <ul><li>The ALR has defensible and accurate boundaries</li> <li>Updating of the technology required to undertake its legislated duties, including accurate GIS, electronic records that are publicly accessible and an online application portal</li> <li>A proactive long-term planning organization that works with local communities and places priority considerations on&nbsp;bona fide&nbsp;farmers and&nbsp; ranchers to identify and cooperatively address emerging issues, and to develop capacity to respond to and enforces against improper use of ALR</li> </ul> <p>The success of this new emphasis to adequately resource and to move the ALC into a proactive tribunal engaged with planning will determine the future of the ALR and the ability of BC to maintain its agricultural lands for future generations.</p> <h2>Attributions</h2> <p><strong>Figure 5.9</strong> British Columbia Agricultural Land Reserve by Hilda Anggraeni. Map data from&nbsp;<a href="http://www.alc.gov.bc.ca/Mapping/gis_data.htm" target="_blank" data-url="http://www.alc.gov.bc.ca/Mapping/gis_data.htm">http://www.alc.gov.bc.ca/Mapping/gis_data.htm</a></p> 
	</div>
			
				
				<div class="footnotes"><div id='136-1'>
<p>Agriculture Land Commission <a href="http://www.landcommission.gov.bc.ca" target="_blank" data-url="http://www.landcommission.gov.bc.ca">http://www.landcommission.gov.bc.ca</a></p>

</div></div>
	</div>
<div class="chapter standard with-subsections" id="chapter-case-study-2-4" title="Case Study 2: Managing the BC Salmon Fishery">
	<div class="chapter-title-wrap">
		<p class="chapter-number">40</p>
		<h1 class="chapter-title">Case Study 2: Managing the BC Salmon Fishery</h1>
								</div>
	<div class="ugc chapter-ugc">
				 <p>A&nbsp;<strong class="Bold">fishery</strong>&nbsp;is a marine environment concerned&nbsp;with breeding and or or harvesting populations of fish and other forms of marine life, such as bivalve molluscs (e.g., mussels, clams).&nbsp;&nbsp;“Fishery”&nbsp;often refers to the area, the type of fish, the method and tools&nbsp;of fishing (including the vessels if any, used in fishing) and the people responsible for stewardship, harvesting and other forms of managing the fishery.&nbsp;BC fisheries are a key natural resource to both the physical and material wealth of the province, yet they are complex environmental systems.&nbsp;While fish are a renewable resource, they are difficult to manage. Estimating populations, as we shall see below, is increasingly difficult due to their mobility, the changing nature of global and localized environmental processes and considerations for other human activity in the region.</p> <p>Ten thousand&nbsp;years before European settlers arrived in BC, Aboriginal people were sustained&nbsp;by the abundant marine life available along the Pacific Coast and up through the many lakes and rivers. For example, the oolichan harvest was, and remains, an important first spring harvest of fish, coming before the spring salmon runs. Oolichan, rich in nutritionalvalue, was sought after not only as a food but also for the oil that was rendered from it. Oolichan oil&nbsp;was transported along “grease trails,” or trade routes that extended south and east beyond the borders of what is present-day BC, and into southern California, Alberta and Saskatchewan. These same trade routes supported other trade and migration in the area. When European settlers and fur traders travelled west, they did so using Aboriginal guides taking them along the established trade infrastructures that were made for transporting the bounty of Pacific coast fisheries.</p> <p>The same fisheries that sustained people in the region for the past 10,000 years were also seen as an abundant renewable natural resource by European settlers. With colonization came<strong class="Bold">&nbsp;</strong>commercial fishing&nbsp;in a form similar to what we know today. <strong class="Bold">Commercial fishing</strong>&nbsp;is the harvesting of wild fish for sale on in the marketplace. It stands in relation to&nbsp;<strong class="Bold">aquaculture</strong>, which is the farming of marine life under controlled conditions.</p> <p>In BC today, there are both commercial fishing and aquaculture industries. Over 80 ocean and freshwater species &nbsp;of fish are traded from BC. This includes several types of salmon, with&nbsp;five&nbsp;species dominating trade: coho, sockeye, pink, chum and chinook. As of 2012, salmon has a declining overall share of the overall seafood harvest.</p> <p>&nbsp;</p> <table class="wet-boew-tables table-condensed align-left" style="color: #000000; width: 100%; border-spacing: 0px;" cellpadding="3"><caption>Table 5.3 Wild Pacific salmon overview from Agriculture Canada</caption> <tbody><tr><th style="color: #222222;" scope="col">Scientific Name</th> <th style="color: #222222;" scope="col">Common Name</th> <th style="color: #222222;" scope="col">Market Name</th> </tr> <tr><td><span xml:lang="la">Oncorhynchus tshawytscha</span></td> <td>Chinook salmon<br /> <img alt="" src="http://www5.agr.gc.ca/resources/prod/Internet-Internet/MISB-DGSIM/IMB-BMI/images/4804001.jpg" height="44" width="145" title="" /></td> <td>Chinook, spring, king</td> </tr> <tr><td><span xml:lang="la">Oncorhynchus keta</span></td> <td>Chum salmon<br /> <img alt="" src="http://www5.agr.gc.ca/resources/prod/Internet-Internet/MISB-DGSIM/IMB-BMI/images/4804002.jpg" height="39" width="145" title="" /></td> <td>Silver-bright, semi-bright, dark; dog; summer; keta</td> </tr> <tr><td><span xml:lang="la">Oncorhynchus kisutch</span></td> <td>Coho salmon<br /> <img alt="" src="http://www5.agr.gc.ca/resources/prod/Internet-Internet/MISB-DGSIM/IMB-BMI/images/4804003.jpg" height="41" width="145" title="" /></td> <td>Coho, silver</td> </tr> <tr><td><span xml:lang="la">Oncorhynchus nerka</span></td> <td>Sockeye salmon<br /> <img alt="" src="http://www5.agr.gc.ca/resources/prod/Internet-Internet/MISB-DGSIM/IMB-BMI/images/4804004.jpg" height="38" width="145" title="" /></td> <td>Sockeye, reds, red salmon</td> </tr> <tr><td><span xml:lang="la">Oncorhynchus gorbuscha</span></td> <td>Pink salmon<br /> <img alt="" src="http://www5.agr.gc.ca/resources/prod/Internet-Internet/MISB-DGSIM/IMB-BMI/images/4804005.jpg" height="38" width="145" title="" /></td> <td>Pink, humpbacks</td> </tr> </tbody> </table> <p>Salmon fisheries in BC, much like other resources, have been subject to technological change and to boom-and-bust cycles related to the global marketplace and food safety. Most salmon are caught in the ocean, which is under federal management. Salmon are&nbsp;&nbsp;<strong class="Bold">anadromous</strong>&nbsp;(i.e.,&nbsp;they live&nbsp;in the ocean and breed in fresh water), and while the Fisheries Act mandates that the federal government is responsible for both fresh and saltwater salmon habitat,&nbsp;freshwater marine areas&nbsp;are also under provincial management during a key point in the&nbsp;life cycle of the salmon, during their early life and when they return to fresh water to spawn after four years.</p> <p>Technology has&nbsp;changed the way salmon are fished and prepared,&nbsp;from drying, salting and smoking in the early 19th century and before, to canning,&nbsp;which gained popularity during the 1850s gold rush because of its compact and protected&nbsp;format. In the subsequent 1898 gold rush,&nbsp;authorities required all miners going into the north have 1,100 pounds&nbsp;of provisions.</p> <p>By the early 1900s, BC was producing&nbsp;837, 489 cans of salmon a year.&nbsp;This was made possible&nbsp;by the introduction of the Smith Butchery Machine in 1903.&nbsp;&nbsp;A good butcher could remove fins, head, tail and innards from about 2,000 fish&nbsp;per 10-hour day.&nbsp;But&nbsp;the machine could clean 22,000 fish in nine hours, or about 40 fish per minute, drastically increasing production capacity. Changes in marine vessels, on-board refrigeration and the use of radar and sonar all contributed to increased fishing in BC and globally.</p> <h2>Challenges for Management</h2> <p>Salmon&nbsp;return to the same rivers in which they were born to spawn, so each river has its own salmon run. The Fraser River sockeye run is one of the largest in BC. Managing the salmon can be difficult due to mixed demands by industry, First Nations, sport fishers and the need to maintain a sustainable population. Overfishing during the “fish wars” between the United States and Canada has affected the salmon populations, as have competing land use claims.</p> <p>Look at the chart in Figure 1, which shows&nbsp;a drastic drop from recorded salmon runs, which had numbered&nbsp;in the range of 25 to 41 million in the early 1900s to less than 5 million in the years around&nbsp;1917. &nbsp;Why do you think that is?</p> <div class="wp-caption aligncenter" id="attachment_135" aria-describedby="caption-attachment-135" style="width: 400px"><a href="http://opentextbc.ca/geography/wp-content/uploads/sites/34/2014/06/Cristine_salmon-04-e1406240134589.png" data-url="http://opentextbc.ca/geography/wp-content/uploads/sites/34/2014/06/Cristine_salmon-04-e1406240134589.png"><img class="wp-image-135" alt="Figure 1 Fraser River Sockeye Salmon" src="http://opentextbc.ca/geography/wp-content/uploads/sites/34/2014/06/Cristine_salmon-04-e1406240134589.png" height="270" width="400" title="" /></a><div class="wp-caption-text" id="caption-attachment-135">Figure 5.13 Fraser River sockeye salmon</div></div> <p>The answer doesn’t lie in the mismanagement of fisheries, as you might suspect. Instead, the culprit is the Hell’s Gate slide. In 1912 and 1913, the Canadian National Railway was being built along the steep narrow bank of the Fraser River at Hell’s Gate. Railroad construction necessitated blasting into the rock, which fell into the Fraser River in the canyon below, which contributed to an already steep and difficult passage for the salmon. In 1913, a rock slide occurred in the same place in the season just before the salmon returned to their spawning grounds. As you can see in Figure 1, salmon levels remained staggeringly low&nbsp;until 2010. Despite the significant jump in 2010,&nbsp;the Fraser River run is still recovering from the the 1913 slide, over 100 years ago.</p> <p>More contemporary threats to the BC salmon fishery include oceans, climate change, fish farming and hatcheries. Oceans house natural predators of salmon, such as seals and sea lions. Mackerel is moving north as waters warm, competing for food sources with the salmon. In the oceans salmon also face over-harvesting in international waters, which is exhibited by the many disputes over salmon harvesting rights. Climate change affects salmon due to warming waters, which are not favoured by salmon, who tend to thrive in colder temperatures.</p> <h2>Salmon Farms</h2> <p>Salmon farms have seen exponential growth since the 1980s.&nbsp;Salmon farming entails raising salmon in net pens, which are stationary in bays or inlets, rather than existing in the open ocean.&nbsp;Fish farming contrasts with&nbsp;<em class="Italic">hatcheries,&nbsp;</em>which use and maintain freshwater hatching beds to artificially increase salmon production.</p> <p>In 1984 there were only 10 salmon farms in BC, and five years on, there were 135 farms run by 50 companies.&nbsp;In 2004 there were 129 farms in operation by 11 companies.&nbsp;The spike in farms lead to overproduction, driving the world price of salmon down and increasing environmental and biological risk. From 1994 to 2002, BC put a moratorium on new fish farms, which helps to explain the drop in their number from 1989 to 2004.</p> <p>Disease transfer is the largest concern of fish farms.&nbsp;Some salmon, such as coho, cannot be farmed because they experience high stress levels due to containment and therefore do not reach maturity.&nbsp;Higher levels of disease among farmed salmon pose a risk to wild salmon populations if the farmed salmon escape and mix with wild salmon populations.&nbsp;Salmon farms use nets to hold Atlantic salmon populations of 700,000 to 1.3 million fish close to the rivers where pink and chum salmon are at their smallest and most vulnerable, and therefore most susceptible to disease transfer. The major solution to the risks of salmon farming is to produce the fish on land in tanks; this, however is a significantly more expensive option.</p> <p>One of the major biological risks to the salmon population come from sea lice, which are increased by salmon farming.&nbsp;Larvae hatching from sea lice on wild adult salmon migrating into rivers infect the farm salmon in the fall.&nbsp;The close quarters of the fish in the net pens allows the sea lice to spread. Researchers in Norway have found a young salmon or sea trout can bear approximately one louse for every gram of the fish’s weight. Research suggests that at 0.3 to 0.4 grams pink and chum fry are much too small to survive even a single louse.</p> <p>There are two species of sea lice commonly found on farmed and wild salmon in BC: Gravid&nbsp;<em class="Italic">Lepeophtheirus salmonis,</em>&nbsp;which are only known to live on salmon and appear to damage juvenile salmon.&nbsp;The Gravid&nbsp;<em class="Italic">Caligus clemensi&nbsp;</em>can live on many fish species and appears not to damage fish. Sea lice exist in large numbers near fish farms and are virtually absent elsewhere in the ocean.</p> <h2>Summary</h2> <p>As we have seen from this case study, there are many threats to a key resource in our food system. Additionally, it is a complex system to manage between economic and environmental sustainability pressures.&nbsp;Some of the challenges, as in the case of the Hell’s Gate slide, happened over a century ago, and we are still dealing with the consequences.</p> <p>T<span style="background-color: #ffffff;">he Pacific salmon was added to the list of B</span><span style="background-color: #ffffff;">C’</span><span style="background-color: #ffffff;">s official symbols in February 2013 (as the fish emblem) in recognition of&nbsp;its huge impact on the environment, culture and the economy.&nbsp;</span>What sort of solutions do you see to help manage the BC salmon fishery?</p> <h2>Attributions</h2> <ul><li><strong>Figure 5.10</strong> Fraser River Sockeye salmon by Hilda Anggraeni&nbsp;derived from Pacific Salmon Commission (<a href="http://www.psc.org/" target="_blank" data-url="http://www.psc.org/">http://www.psc.org/</a>)</li> </ul> 
	</div>


	</div>
<div class="chapter standard with-subsections" id="chapter-slug-6-7-summary" title="Summary">
	<div class="chapter-title-wrap">
		<p class="chapter-number">41</p>
		<h1 class="chapter-title">Summary</h1>
								</div>
	<div class="ugc chapter-ugc">
				 <p>A food system encompasses cultural foodways in addition to&nbsp;the production, processing, packaging, distribution, marketing, exchange, consumption and disposal or post-consumption treatment of food and food-related items. This chapter focused on the food systems and the way in which humans interact with their environment,&nbsp;including&nbsp;a range of historical agricultural practices.</p> <p>To understand the origin of food systems in British Columbia it is important to review the geographical landscape of the province, which&nbsp;includes a number of mountain ranges with relatively few areas of high soil fertility suitable for conventional agricultural practices.&nbsp;The highest soil fertility is&nbsp;primarily located in river valleys and deltas. Of the province’s 92,250,929-hectare land base, the Canadian Land Inventory estimates that only 5% is suitable for agriculture.</p> <p>Climate affects the expansion of agriculture. The number of frost-free days and growing degree days determines what kind of crops can be expected to successfully grow in different geographic regions. As elevation and latitude increases, the number of frost-free days decline. Water accessibility is also a factor in determining the success of agriculture. Although considered a high precipitation geographical zone, there are arid regions within the Okanagan valley that make water availability for crops difficult.</p> <p>Today’s food system encompasses agriculture, aquaculture and commercial&nbsp;fisheries, and processing of food and beverages. Ironically, in 2013 BC’s main export was farmed Atlantic salmon&nbsp; at $267 million. The contemporary food system, within BC, has direct linkages to socio-economic issues despite increasing production in staple foods and growth in commodities like wine. Many BC families have increasing difficulty managing a budget that allows them to access foods that&nbsp;meet the requirements of&nbsp;healthy diets.</p> <p>BC’s contemporary food system has also been affected by the rapid growth of urbanization. The case study on the Agricultural Land Reserve detailed policy reactions to agricultural-urban conflicts. Attention to food system issues in BC has led to a number of political and social trends aimed at changing understanding of our food systems. These include the 100-mile diet, better access to seed sources, growth of organic producers, the establishment of the BC Food Systems Network (BCFSN) and Sole Foods and Young Agrarians, and&nbsp;the introduction of SPIN-farming. Managing food systems is also a complex process that entails coordination between competing local economies, environmental processes and global markets, which we&nbsp;have seen&nbsp;in the case study of the BC salmon fishery.</p> 
	</div>


	</div>
<div class="chapter standard with-subsections" id="chapter-slug-6-10-key-terms" title="Key Terms">
	<div class="chapter-title-wrap">
		<p class="chapter-number">42</p>
		<h1 class="chapter-title">Key Terms</h1>
								</div>
	<div class="ugc chapter-ugc">
				 <div class="bcc-box bcc-success"><h3>Key Terms</h3> <p><strong class="Bold">100-mile diet</strong>: A diet that challenges adopters to eat locally (within 100 miles of their home).</p> <p><strong class="Bold">Agricultural Land Reserve (ALR): </strong>A provincial land use zone that recognizes&nbsp;agriculture as the priority use for approximately 4.6% of the land base of British Columbia (ALC 2013). Established via the provincial Land Commission Act of 1973, the ALR is one of the earliest examples in North America of the use of regional zoning laws to permanently preserve farmland and promote local food production.</p> <p><strong class="Bold">Agritourism</strong>: Any agriculturally based operation or activity that brings visitors to a farm or ranch.</p> <p><strong class="Bold">BC Food Systems Network (BCFSN)</strong>: Formed in 1999 and incorporated in 2004, a&nbsp;300-plus member network that&nbsp;includes farmers, health practitioners, educators and consumers across the province to&nbsp;link and facilitate food security activities between over 20 community-based food security organizations and food policy councils.</p> <p><strong class="Bold">Biophysical</strong>: In relation to the&nbsp;environment,&nbsp;the biotic and abiotic surrounding of an organism or population, including the factors that have an influence in their survival, development and evolution.</p> <p><strong class="Bold">Food system</strong>: Cultural foodways; the production, processing, packaging, distribution, marketing, exchange, consumption and disposal or post-consumption treatment of food and food-related items.</p> <p><strong class="Bold">Land capability classification system for agriculture in British Columbia</strong>: Guidelines used by pedologists and others for assessing agricultural capability of land at a detailed or on-site level of investigation.</p> <p><strong class="Bold">Sinuous</strong> <strong class="Bold">river valleys</strong>: The winding patterns of rivers.</p> <p><strong class="Bold">Six Mile Ranch</strong>: A ranch west of Kamloops; the site of a development controversy. In 1997, a developer sought permission for a residential and resort development involving 136 hectares of agricultural land at the Six Mile Ranch.&nbsp;The Commission rejected the complex proposal, which included compensatory benefits for agriculture, because of the high quality of the land slated for removal. However, it stated it would consider a smaller proposal that provided improved benefits to agriculture. For more information on the controversy see page 15 of http://www.davidsuzuki.org/publications/downloads/2006/DSF-ALR-final3.pdf.</p> <p><strong class="Bold">Sole Food</strong>: An organization that&nbsp;transforms vacant urban land into street farms that grow artisan quality fruits and vegetables, available at farmers’ markets, local restaurants and retail outlets. (http://solefoodfarms.com/)</p> <p><strong class="Bold">SPIN-farming </strong><strong>(S-mall P-lot IN-tensive): </strong>The concept of taking a small lot (e.g., backyard, front lawn)&nbsp;to new levels of productivity and profitability that go far beyond traditional home gardening practices. SPIN-farming’s key characteristics include being production based, smaller than one acre, low capital intensive, entrepreneurially driven, environmentally friendly and close to markets.</p> <p><strong class="Bold">Suzuki Foundation: </strong>A science-based environmental organization that&nbsp;collaborates with Canadians from all walks of life, including government and business, to conserve the&nbsp;environment and work toward&nbsp;sustainability. (http://www.davidsuzuki.org)</p> <p><strong class="Bold">Tubers</strong><strong>:</strong> Various types of modified plant structures that are enlarged to store nutrients. They are used by plants to survive the winter or dry months, to provide energy and nutrients for regrowth during the next growing season and as a means of asexual reproduction.</p> <p><strong class="Bold">Young agrarian</strong><strong>:</strong> A new entrant into agriculture.&nbsp;Someone from the country to the city who values food, farming, nature and community.</p> </div> <p>&nbsp;</p> <p>&nbsp;</p> 
	</div>


	</div>
<div class="chapter standard with-subsections" id="chapter-slug-6-8-activities" title="Suggested Activities">
	<div class="chapter-title-wrap">
		<p class="chapter-number">43</p>
		<h1 class="chapter-title">Suggested Activities</h1>
								</div>
	<div class="ugc chapter-ugc">
				 <div class="bcc-box bcc-info"><h3>Suggested Activities</h3> <h2>Activity 1</h2> <p>Volunteer for a local group that is doing a food system activity (anything related to the food system;&nbsp;for example,&nbsp;political protests, food banks, farming, agricultural research, or food policy councils). Write a critical reflection describing the educational value of your experience and stating&nbsp;how the activity impacts and originates from food system dynamics.</p> <h2>Activity 2</h2> <p>Act as a participant observer at a food policy council meeting.</p> <h2>Activity 3</h2> <p>Map your BC&nbsp;farmers’ markets. Create an online map (using Google Maps Engine, ArcOnlin, or another provider)&nbsp;and add a point to the map where your local farmers’ markets occur. Include&nbsp;dates and times for the market.</p> <h2>Activity 4</h2> <p>Create a map of gleaning locations. You can add your locations to an online site like Falling Fruit (http://fallingfruit.org/).</p> <h2>Activity 5</h2> <p>Review content from popular media relevant to&nbsp;local regional food systems. The content&nbsp;can be from a&nbsp;article (from websites, newspapers or magazines), film/documentary, lecture, website or audiovisual presentation. Describe and synthesize the media&nbsp;and explain why this is interesting in relation to course themes.</p> <h2>Activity 6</h2> <p>Present one of the indigenous plants used in your local region.&nbsp;Tell the class why this is an important plant for a local or regional culture, how it is used, the geographic distribution and any other interesting details from&nbsp;your&nbsp;own research. For example, how does it fit into the contemporary&nbsp;food system? Are there any samples of the plant in locally available products?</p> <h2>Activity 7</h2> <p>Add a Wikipedia article on SPIN-farming strategies. Consider interviewing the founders of the SPIN-farming organization for the content of your article.</p> <h2>Activity 8</h2> <p>Create a presentation or report&nbsp;about foodways on one of the following topics:</p> <ul><li style="list-style-type: none;"><ul><li>One or more regional cuisines</li> <li>A BC regional dish that is found as a regional cuisine elsewhere</li> <li>“Ethnic cuisine,” describing what it is and where pockets of different foodways may be located</li> <li>A critical analysis of grocery stores offerings.&nbsp;What is on the shelves and why? Who are they targeting? Where is the store located?</li> </ul> </li> </ul> <h2>Activity 9</h2> <p>Explore the multi-functionality of urban agriculture on university campuses by completing a case study on the rooftop garden at the University of British Columbia: <a href="http://ubcfarm.ubc.ca/case-studies/urban-ag/" data-url="http://ubcfarm.ubc.ca/case-studies/urban-ag/">Case Study – Urban Agriculture</a>.</p> </div> <p>&nbsp;</p> 
	</div>


	</div>
<div class="chapter standard with-subsections" id="chapter-slug-6-9-references-and-resources" title="References and Resources">
	<div class="chapter-title-wrap">
		<p class="chapter-number">44</p>
		<h1 class="chapter-title">References and Resources</h1>
								</div>
	<div class="ugc chapter-ugc">
				 <h2>References</h2> <p>Agricultural Land Commission [WWW Document], n.d. URL http://www.alc.gov.bc.ca/ (accessed 8.28.14).</p> <p>Androkovich, R. 2013. British Columbia’s agricultural land reserve: Economic, legal and political issues. <em class="Italic">Land Use Policy</em> 30 (1):365–372. http://linkinghub.elsevier.com/retrieve/pii/S0264837712000609 (last accessed 9 December 2013).</p> <p>Bullock, R. 2010. <em class="Italic">Review of the Agricultural Land Commission. Moving Forward: A Strategic Vision of the Agricultural Land Commission for Future Generations</em>. Burnaby, British Columbia.</p> <p>Canada, A. and F.T.C.S.A. and N.M.B. and I.S.B. and A.-F.C. of, 2002. Wild Pacific Salmon Overview [WWW Document]. URL http://www.agr.gc.ca/eng/industry-markets-and-trade/statistics-and-market-information/by-product-sector/fish-and-seafood/fish-and-seafood-canadian-industry/fact-sheets/wild-pacific-salmon-overview/?id=1383328060931 (accessed 8.28.14).</p> <p>Campbell, C. 2006. <em class="Italic">Forever Farmland-Reshaping the Agricultural Land Reserve for the 21st Century</em>. http://dspace.cigilibrary.org/jspui/handle/123456789/23557 (last accessed 9 December 2013).</p> <p>Garrish, C. 2002. Unscrambling the omelette: Understanding British Columbia’s agricultural land reserve. <em class="Italic">BC Studies: The British Columbian Quarterly</em> 136:25–55. http://prophet.library.ubc.ca/ojs/index.php/bcstudies/article/viewFile/1649/1694 (last accessed 7 December 2013).</p> <p>Hanna, K. 1997. Regulation and land-use conservation: A case study of the British Columbia Agricultural Land Reserve. <em class="Italic">Journal of soil and water conservation</em> 52 (3):166–170. http://www.jswconline.org/content/52/3/166.short (last accessed 9 December 2013).</p> <p>Ipsos Reid. 2008. <em class="Italic">Poll of Public Opinions Toward Agriculture , Food and Agri-Food Production in BC. Report for Investment Agriculture Foundation of BC</em>. Vancouver.</p> <p>Jones, Nicolla. (2010). Sparks fly over theory that volcano caused salmon boom.&nbsp;<span style="background-color: #ffffff; color: #363636;">Nature Published online&nbsp;</span>29 October 2010 || doi:10.1038/news.2010.572.</p> <p>PALC (Provincial Agricultural Land Commission). 2013. <em class="Italic">Provincial Agricultural Land Commission Annual Report 2012/2013</em>. Burnaby, British Columbia.</p> <p>Petter, A. 1985. Sausage making in British Columbia’s NDP government: the creation of the Land Commission Act, August 1972-April 1973. <em class="Italic">BC Studies: The British Columbian Quarterly</em> 65:3–33. http://prophet.library.ubc.ca/ojs/index.php/bcstudies/article/download/1202/1246 (last accessed 9 December 2013).</p> <p>Pinkerton, E. W. (1994). Local fisheries co-management: a review of international experiences and their implications for salmon management in British Columbia.<em class="Italic">Canadian journal of fisheries and aquatic sciences, 51</em> (10), 2363-2378.</p> <p>Runka, G. G. 2006. BC’s Agricultural Land Reserve – It’s Historical Roots. In <em class="Italic">Post World Planners Congress Seminar Planning for Food – June 21, 2006 Vancouver, B.C.</em>, 1–7. Vancouver: Provincial Agricultural Land Commission.</p> <p>Smith, B. E. 2012. <em class="Italic">A Work in Progress – The British Columbia Farmland Preservation Program</em>. Burnaby, British Columbia.</p> <p>———. 1974. The British Columbia Land Commission Act-1973. :295.</p> <p>Slaney, T. L., Hyatt, K. D., Northcote, T. G., &amp; Fielden, R. J. (1996). Status of anadromous salmon and trout in British Columbia and Yukon.<em class="Italic">Fisheries</em>,&nbsp;<em class="Italic">21</em>(10), 20-35.</p> <p>Turner, N.J., 1995. Food Plants of Coastal First Peoples. UBC Press.</p> <p>Turner, N. J., &amp; Turner, K. L. (2008). “Where our women used to get the food”: cumulative effects and loss of ethnobotanical knowledge and practice; case study from coastal British Columbia. Botany, 86(2), 103–115. doi:10.1139/B07-020</p> <p>&nbsp;</p> 
	</div>


	</div>

</div>
<div class="part-wrapper" id="part-chapter-7-wrapper">
    <div class="part  " id="part-chapter-7">
	<div class="part-title-wrap">
		<p class="part-number">VI</p>
		<h1 class="part-title">6. Forestry in British Columbia</h1>
	</div>
	<div class="ugc part-ugc">
		<div class="bcc-box bcc-highlight"><h3>Learning Objectives</h3> <ul><li>Identify common native British Columbia tree species.</li> <li>Evaluate the significance of forests to British Columbia’s economic growth&nbsp;and regional identity.</li> <li>Explain threats to British Columbia forests.</li> </ul> </div> <p>&nbsp;</p>
	</div>
			
				
	</div>
<div class="chapter standard with-subsections" id="chapter-slug-7-2-introduction" title="Introduction">
	<div class="chapter-title-wrap">
		<p class="chapter-number">45</p>
		<h1 class="chapter-title">Introduction</h1>
								</div>
	<div class="ugc chapter-ugc">
				 <p>British Columbia’s forests are legendary. BC forests have been the economic, cultural and political lifeblood of the province – from the&nbsp;intimate relationships of First Nations with the life-sustaining cedar&nbsp;and sacred trees like the Golden Spruce,&nbsp;to the harrowing tales of lumberjacks among&nbsp;the&nbsp;towering evergreens of the coast, to the role of BC forests in feeding the military during war,&nbsp;and to the now-familiar boom-and-bust cycles of lumber towns like Chemainus.</p> <p>Despite the heavy use of this resource, only 60%&nbsp;of the province is&nbsp;forested, which represents approximately 55 million of the province’s 95 million hectares. Three percent of areas that were formerly forests have been permanently converted to other land uses, such as towns, urban areas or agriculture. The forest is a public resource as about 95% percent&nbsp;of the forested area is provincially owned.</p> <p>Forestry is a vital part of the province’s economy.&nbsp;Currently, one&nbsp;in five&nbsp;jobs in BC is related to forestry.&nbsp;Employment in the industry is growing with direct and indirect employment sitting just below 170,000 in 2012. Although the forest sector has experienced some declines, with an average annual growth rate of 1.7% it&nbsp;is forecast&nbsp;to be one of three sectors to experience the fastest growth from 2007 to 2017.</p> <p>In 2004,&nbsp;lumber production peaked at 85 million cubic metres of lumber produced at sawmills, but&nbsp;by 2009 there was a decline to about 45 million&nbsp;cubic metre.&nbsp;The socioeconomic implication of this downfall was harmful to large parts of&nbsp;the economy and to several communities that were devastated by the closing of sawmills.&nbsp;Since then, the industry has slightly recovered and future prediction estimates a continued slow recovery. Despite the 2009 slowdown of the lumber industry, BC’s global exports in wood products totalled $7,745,000, and pulp and paper exports were at $3,909,000, constituting 33% constituting 33 percent&nbsp;of BC’s overall commodity&nbsp;exports (BC Stats, 2014).</p> <p>The province has adopted&nbsp;the&nbsp;w<span style="background-color: #ffffff;color: #333333">estern red cedar&nbsp;as its official tree, reflecting its&nbsp;importance to the indigenous communities and to the economic growth of the province.&nbsp;However,&nbsp;t</span>o best understand the background of forestry in BC it is important to&nbsp;overview&nbsp;some of the many important&nbsp;native&nbsp;tree species. The <a href="http://www.for.gov.bc.ca/hfd/library/documents/treebook/" target="_blank" data-url="http://www.for.gov.bc.ca/hfd/library/documents/treebook/">BC <em>Tree Book</em></a>&nbsp;<span class="footnote"><span class="footnote-indirect" data-fnref="150-1"></span></span> outlines 40 different native tree species that can be&nbsp;divided into two broad categories: deciduous trees and coniferous trees.</p> <h2>Deciduous Trees (Hardwood)</h2> <p><strong>Deciduous</strong> means&nbsp;“falling off at maturity” and entails the natural process of dropping&nbsp;a plant part that is no longer needed. It is used to describe&nbsp;trees and&nbsp;shrubs that lose their leaves seasonally (commonly during autumn)&nbsp;and to&nbsp;plants that lose their petals after flowering or fruit when ripe.&nbsp;Deciduous trees in British Columbia usually are rapid growers that come immediately after the destruction of the forest by natural causes such as fire, infestation or natural decay. The most common species of deciduous trees in British Columbia are elder, maple and birch.</p> <div class="wp-caption aligncenter" id="attachment_1307" aria-describedby="caption-attachment-1307" style="width: 250px"><a href="http://opentextbc.ca/geography/wp-content/uploads/sites/34/2014/09/softwood.jpg" data-url="http://opentextbc.ca/geography/wp-content/uploads/sites/34/2014/09/softwood.jpg"><img src="http://opentextbc.ca/geography/wp-content/uploads/sites/34/2014/09/softwood.jpg" alt="Fig 6.1 Softwood trees in BC (top) Elder (center) Maple (bottom) Birch" class="wp-image-1307" height="500" width="250" srcset="https://opentextbc.ca/geography/wp-content/uploads/sites/34/2014/09/softwood.jpg 400w, https://opentextbc.ca/geography/wp-content/uploads/sites/34/2014/09/softwood-150x300.jpg 150w, https://opentextbc.ca/geography/wp-content/uploads/sites/34/2014/09/softwood-65x130.jpg 65w, https://opentextbc.ca/geography/wp-content/uploads/sites/34/2014/09/softwood-225x450.jpg 225w, https://opentextbc.ca/geography/wp-content/uploads/sites/34/2014/09/softwood-350x700.jpg 350w" sizes="auto, (max-width: 250px) 100vw, 250px" title="" /></a><div class="wp-caption-text" id="caption-attachment-1307">Fig 6.1 Hardwood trees in BC (top) Elder (center) Maple (bottom) Birch</div></div> <h2>Coniferous trees (Softwood)</h2> <p><strong>Coniferous</strong> trees make up the majority of broad tree species in British Columbia and are the most commonly harvested for the lumber and pulp industry. The coniferous trees that cover most of the province’s landscape are&nbsp;pine, spruce, fir, cedar and hemlock.&nbsp;These trees tend to grow slowly between the fast-growing deciduous trees. Eventually they grow to take the majority of the sunlight and cause the death of the previously predominant deciduous trees.&nbsp;This process&nbsp;results in what is known as an <strong class="Bold">old-growth forest</strong>. An old-growth forest is characterized by limited light penetration reaching the ground surface and low height shrubs around the tree trunk base.</p> <p>The Douglas fir, western red cedar and several other species have played important roles in industry production. Different tree species have different end uses and benefit&nbsp;various markets.&nbsp;The cedar, for example,&nbsp;is straight grain, light and water resistant, making it good for roofing and siding.</p> <div class="wp-caption aligncenter" id="attachment_1306" aria-describedby="caption-attachment-1306" style="width: 400px"><a href="http://opentextbc.ca/geography/wp-content/uploads/sites/34/2014/09/hardwood.jpg" data-url="http://opentextbc.ca/geography/wp-content/uploads/sites/34/2014/09/hardwood.jpg"><img src="http://opentextbc.ca/geography/wp-content/uploads/sites/34/2014/09/hardwood.jpg" alt="Fig 6.2 Hardwood trees in BC (top left) Pinus Contorta (top centre) Spruce (top right) Fir (bottom left) Cedar (bottom right) Western Hemlock" class="wp-image-1306" height="340" width="400" srcset="https://opentextbc.ca/geography/wp-content/uploads/sites/34/2014/09/hardwood.jpg 800w, https://opentextbc.ca/geography/wp-content/uploads/sites/34/2014/09/hardwood-300x254.jpg 300w, https://opentextbc.ca/geography/wp-content/uploads/sites/34/2014/09/hardwood-65x55.jpg 65w, https://opentextbc.ca/geography/wp-content/uploads/sites/34/2014/09/hardwood-225x190.jpg 225w, https://opentextbc.ca/geography/wp-content/uploads/sites/34/2014/09/hardwood-350x297.jpg 350w" sizes="auto, (max-width: 400px) 100vw, 400px" title="" /></a><div class="wp-caption-text" id="caption-attachment-1306">Fig 6.2 Softwood trees in BC (top left)&nbsp; Pinus Contorta (top centre) Spruce (top right) Fir (bottom left) Cedar (bottom right) Western Hemlock</div></div> <h2>Reforestation in BC</h2> <p>Lumber is a renewable yet slow-growing resource. Reforestation is a thus a key aspect of sustainable forest management.&nbsp;In British Columbia, <strong class="Bold">reforestation</strong> is strictly regulated so that new forests mirror the diversity of natural forests and support the sustainable harvest of commercially valuable timber. About 20%&nbsp;of harvested areas are reforested naturally; the balance is reforested by planting. Seeds used in reforestation programs come from two sources: seed orchards and wild stands. Seed orchards&nbsp;produce “select” seeds from trees with proven growth, timber and pest-resistance qualities.&nbsp;The province’s chief forester has established standards to regulate the registration, storage, selection and transfer of tree seed. These standards are aimed at maintaining and enhancing the health and productivity of BC’s future forests. Reforestation is helping to maintain a mix of tree species in the province, which in turn helps maintain ecosystem processes and diverse habitats. BC uses a mix of over 20 different native tree species in its reforestation programs.&nbsp;On average, more than 200 million tree seedlings are planted each year on public forest land in BC, and since reforestation programs began in the 1930s, more than six billion trees have been planted.</p> <p>The province has programs in place to conserve the genetic resources of BC’s native tree species. These include conserving natural tree populations in parks, protected areas,&nbsp;provincial forests and gene archives. Programs such as Forests for Tomorrow reforest the areas hardest hit by catastrophic wildfires and the mountain pine beetle epidemic. The goal of these programs and the reforestation requirements is to ensure that BC forests contain genetic diversity, an important element in maintaining ecosystem resilience. Forests for Tomorrow projects&nbsp;that by 2013 approximately 60 million trees will be planted.</p> <h2>Annual Allowable Cuts in BC</h2> <p>The current <strong>a</strong><strong class="Bold">nnual allowable cut (AAC)</strong> is 75 million cubic metres, including the temporary increases totalling about 5.5 million cubic metres that are in place for salvaging timber attacked by mountain pine beetle in the interior of the province. Projections indicate that if current management approaches were to continue&nbsp;and there were no changes in the land base or information used in the analyses, this AAC level could be maintained for 30 years. Timber supply would&nbsp;then be expected to decline over a decade to 60 to 65 million cubic metres, staying at this level for roughly 50 years before returning to approximately the current AAC. Such a decline would heavily impact the BC economy and is politically contested by environmental activists.</p> <p>Both timber and non-timber values are considered in calculating AACs. For example, the following factors are considered:</p> <ul><li>&nbsp; No-cut buffer zones</li> <li>&nbsp; Insect/fire/disease losses</li> <li>&nbsp; Logging losses</li> <li>&nbsp; Operational constraints</li> <li>&nbsp; Environment and wildlife</li> </ul> <h2>Attributions</h2> <ul><li><strong>Figure 6.1</strong>. Hardwood trees in BC is comprised of: <ul><li>Elder trees; child&nbsp;among elders (<a href="https://flic.kr/p/6KbWWX" target="_blank" data-url="https://flic.kr/p/6KbWWX">https://flic.kr/p/6KbWWX</a>) by McD22 (https://www.flickr.com/photos/smcdevitt/) is under CC BY 2.0 (<a href="https://creativecommons.org/licenses/by/2.0/" target="_blank" data-url="https://creativecommons.org/licenses/by/2.0/">https://creativecommons.org/licenses/by/2.0/</a>)</li> <li>Maple tree. Bursting Orange Maple (<a href="https://flic.kr/p/aN9cHc" target="_blank" data-url="https://flic.kr/p/aN9cHc">https://flic.kr/p/aN9cHc</a>) by MookieLuv (https://www.flickr.com/photos/mookieluv/) is under CC BY NC SA (<a href="https://creativecommons.org/licenses/by-nc-sa/2.0/" target="_blank" data-url="https://creativecommons.org/licenses/by-nc-sa/2.0/">https://creativecommons.org/licenses/by-nc-sa/2.0/</a>)</li> <li>Birch trees. Birch Trees up in the mountains (<a href="https://flic.kr/p/34HGZ" target="_blank" data-url="https://flic.kr/p/34HGZ">https://flic.kr/p/34HGZ</a>) by Ryan McLean (<a href="https://www.flickr.com/photos/saaby/" target="_blank" data-url="https://www.flickr.com/photos/saaby/">https://www.flickr.com/photos/saaby/</a>) is under CC BY SA 2.0 (<a href="https://creativecommons.org/licenses/by-sa/2.0/" target="_blank" data-url="https://creativecommons.org/licenses/by-sa/2.0/">https://creativecommons.org/licenses/by-sa/2.0/</a>)</li> </ul> </li> <li><strong>Figure 6.2</strong>&nbsp;Softwood tress of BC is comprised of: <ul><li>Pinus contorta 28263 from <a href="http://en.wikipedia.org/wiki/Pinus_contorta#mediaviewer/File:Pinus_contorta_28263.JPG" target="_blank" data-url="http://en.wikipedia.org/wiki/Pinus_contorta#mediaviewer/File:Pinus_contorta_28263.JPG">http://en.wikipedia.org/wiki/Pinus_contorta#mediaviewer/File:Pinus_contorta_28263.JPG</a> under CC BY&nbsp;2.0&nbsp;(<a href="https://creativecommons.org/licenses/by/2.0/" target="_blank" data-url="https://creativecommons.org/licenses/by/2.0/">https://creativecommons.org/licenses/by/2.0/</a>)</li> <li>Spruce tree. Sakhalin spruce (<a href="https://flic.kr/p/ebg4YE" target="_blank" data-url="https://flic.kr/p/ebg4YE">https://flic.kr/p/ebg4YE</a>) by Tatters (https://www.flickr.com/photos/tgerus/) is under CC BY NC SA 2.0 (<a href="https://creativecommons.org/licenses/by-nc-sa/2.0/" target="_blank" data-url="https://creativecommons.org/licenses/by-nc-sa/2.0/">https://creativecommons.org/licenses/by-nc-sa/2.0/</a>)</li> <li>Fir tree. Fir tree at Milton Morenish (<a href="http://www.geograph.org.uk/photo/1358994" target="_blank" data-url="http://www.geograph.org.uk/photo/1358994">http://www.geograph.org.uk/photo/1358994</a>) by Simon Johnston (http://www.geograph.org.uk/profile/1743) is used under CC BY SA 2.0 (<a href="http://creativecommons.org/licenses/by-sa/2.0/" target="_blank" data-url="http://creativecommons.org/licenses/by-sa/2.0/">http://creativecommons.org/licenses/by-sa/2.0/</a>)</li> <li>Cedar tree. Field with cedar tree, other trees beyond (<a href="http://www.geograph.org.uk/photo/2924351" target="_blank" data-url="http://www.geograph.org.uk/photo/2924351">http://www.geograph.org.uk/photo/2924351</a>) by Trevor Littlewood (<a href="http://www.geograph.org.uk/profile/39198)%20is used under CC BY SA 2.0 (http://creativecommons.org/licenses/by-sa/2.0/" target="_blank" data-url="http://www.geograph.org.uk/profile/39198)%20is used under CC BY SA 2.0 (http://creativecommons.org/licenses/by-sa/2.0/">http://www.geograph.org.uk/profile/39198) is used under CC BY SA 2.0 (http://creativecommons.org/licenses/by-sa/2.0/</a>)</li> <li>Western hemlock by Jean-Pol Grandmont (<a href="https://commons.wikimedia.org/wiki/File:Tsuga_heterophylla_%27Pendula%27_JPG.jpg" target="_blank" data-url="https://commons.wikimedia.org/wiki/File:Tsuga_heterophylla_%27Pendula%27_JPG.jpg">https://commons.wikimedia.org/wiki/File:Tsuga_heterophylla_%27Pendula%27_JPG.jpg</a>) used under CC-BY 3.0(<a href="https://creativecommons.org/licenses/by/3.0/" target="_blank" data-url="https://creativecommons.org/licenses/by/3.0/">https://creativecommons.org/licenses/by/3.0/</a>)</li> </ul> </li> </ul> 
	</div>
			
				
				<div class="footnotes"><div id='150-1'>
<p>The BC <em>Tree Book</em> (free download) <a href="http://www.for.gov.bc.ca/hfd/library/documents/treebook" target="_blank" data-url="http://www.for.gov.bc.ca/hfd/library/documents/treebook">http://www.for.gov.bc.ca/hfd/library/documents/treebook</a>/</p>

</div></div>
	</div>
<div class="chapter standard with-subsections" id="chapter-slug-7-3-history-of-commercial-logging" title="History of Commercial Logging">
	<div class="chapter-title-wrap">
		<p class="chapter-number">46</p>
		<h1 class="chapter-title">History of Commercial Logging</h1>
								</div>
	<div class="ugc chapter-ugc">
				 <p>Commercial logging in British Columbia dates back to the 1820s when timber was predominantly used for masts on ships. By the 1860s, export production increased with the establishment of many saw mills on the southern end of Vancouver Island and the Burrard Inlet. The coastal forests of the region offered enormous trees, high wood per hectare as a result and proximity to the ocean for transportation.</p> <p>The gold rush in the Cariboo region began to open the area up with the building of roads. As the population increased in this area it also created the demand for timber, heating, cooking, housing and commercial establishments. Just as rapidly as the gold rush boomed it busted, and many of the settlements were abandoned and demand for resources decreased rapidly. However, new discoveries of silver, coal and other minerals to mine renewed demand for timber in the Interior.</p> <p>It was around this time (1886) that the Canadian Pacific Railway was completed which led to a stable export market to the Prairies and central Canada for the Interior timber mills, specifically those in Lytton,&nbsp;Kamloops and Revelstoke. The Kettle Valley railway line,&nbsp;Grand Trunk Pacific and the Pacific Great Eastern&nbsp;continued to open up BC and increased further the demand for Interior mills. Communities were no longer solely relying on the rivers and lakes for transportation. Prior to the expansion of the railways, transportation had been one of the major barriers to the interior timber harvest.</p> <p>The introduction of the combustion engine ended the linear pattern of logging. Bulldozers and trucks could get to almost any logging site, and&nbsp; by the1940s trucks became the main source of transportation, which&nbsp;continues to be the case today. Further advances in technology included the double-bladed axe and the Swede saw, which later became the chainsaw.</p> <div class="wp-caption aligncenter" id="attachment_151" aria-describedby="caption-attachment-151" style="width: 400px"><a href="http://opentextbc.ca/geography/wp-content/uploads/sites/34/2014/06/Sawing-e1406662293601.jpg" data-url="http://opentextbc.ca/geography/wp-content/uploads/sites/34/2014/06/Sawing-e1406662293601.jpg"><img class="wp-image-151" alt="Figure 1. Men felling a tree with a motorized saw 1942" src="http://opentextbc.ca/geography/wp-content/uploads/sites/34/2014/06/Sawing-e1406662293601.jpg" height="268" width="400" title="" /></a><div class="wp-caption-text" id="caption-attachment-151">Figure 6.3 Men felling a tree with a motorized saw, 1942</div></div> <p>The spar tree and steam donkey, or <strong class="Bold">donkey engine</strong> (the common nickname for a steam-powered winch, or <strong class="Bold">logging engine</strong>), became a mechanical spar pole that could be brought to any site. The mechanical spar pole used hydraulics to raise the pole and a&nbsp;combustion engine to run&nbsp;the <strong class="Bold">winch</strong>. The technology was further enhanced with the <strong class="Bold">feller&nbsp;buncher</strong>, a machine with metal tracks that cuts limbs and stacks logs all at once.</p> <div class="wp-caption aligncenter" id="attachment_152" aria-describedby="caption-attachment-152" style="width: 400px"><a href="http://opentextbc.ca/geography/wp-content/uploads/sites/34/2014/06/Buncher.jpg" data-url="http://opentextbc.ca/geography/wp-content/uploads/sites/34/2014/06/Buncher.jpg"><img class="wp-image-152" alt="Figure 2. Feller buncher" src="http://opentextbc.ca/geography/wp-content/uploads/sites/34/2014/06/Buncher.jpg" height="267" width="400" srcset="https://opentextbc.ca/geography/wp-content/uploads/sites/34/2014/06/Buncher.jpg 792w, https://opentextbc.ca/geography/wp-content/uploads/sites/34/2014/06/Buncher-300x200.jpg 300w, https://opentextbc.ca/geography/wp-content/uploads/sites/34/2014/06/Buncher-65x43.jpg 65w, https://opentextbc.ca/geography/wp-content/uploads/sites/34/2014/06/Buncher-225x150.jpg 225w, https://opentextbc.ca/geography/wp-content/uploads/sites/34/2014/06/Buncher-350x233.jpg 350w" sizes="auto, (max-width: 400px) 100vw, 400px" title="" /></a><div class="wp-caption-text" id="caption-attachment-152">Figure 6.4 Feller buncher</div></div> <p>The depletion of the accessible forests led loggers further into the forests and&nbsp;up the slopes of the mountains. New methods for log booms were necessary as old rafts were not suitable for the rougher seas. The <strong class="Bold">Davis raft</strong> was useful for preventing breakup but was replaced by a much better barge system (self-loading and self-dumping), which&nbsp;proved to be faster and decreased log loss. In remote areas, helicopter and balloon logging began, although this&nbsp;was very expensive. Mills switched from labour-intensive to capital-intensive entities, and all aspects of milling began to be automated: debarking logs, saw milling, grading and green chain (an assembly line of fresh-cut timber). By the 1980s hydraulic barkers and new band saws with laser directional beams were introduced as well as an automated green chain.</p> <h2>Attributions</h2> <ul><li><strong>Figure 6.3</strong> Men felling a tree with a motorized saw (<a href="http://searcharchives.vancouver.ca/industrial-engineering-ltd-men-felling-tree-with-motorized-saw" target="_blank" data-url="http://searcharchives.vancouver.ca/industrial-engineering-ltd-men-felling-tree-with-motorized-saw">http://searcharchives.vancouver.ca/industrial-engineering-ltd-men-felling-tree-with-motorized-saw</a>) by Matthews, James Skitt, Major (Public Domain)</li> <li><strong>Figure 6.4</strong> Feller&nbsp;buncher&nbsp;<a href="Buncher12.jpg" target="_blank" data-url="Buncher12.jpg">(http://commons.wikimedia.org/wiki/File:Buncher12.jpg</a>) (Public Domain)</li> </ul> 
	</div>


	</div>
<div class="chapter standard with-subsections" id="chapter-slug-7-4-pulp-and-paper-mills" title="Pulp and Paper Mills">
	<div class="chapter-title-wrap">
		<p class="chapter-number">47</p>
		<h1 class="chapter-title">Pulp and Paper Mills</h1>
								</div>
	<div class="ugc chapter-ugc">
				 <p>While lumber was and is a vital part of the forestry industry, pulp and paper mills increased in importance in the 20th century due to global demand. By the 1930s both Powell River and Ocean Falls were important producers of pulp. By 1951, Prince Rupert, Duncan Bay, Port Alberni, Marmac and Victoria added pulp and paper mills and the demand increased throughout the 1960s.</p> <p><strong class="Bold">Multinational corporations</strong>&nbsp;were encouraged to invest in the forestry industry, and in the 1960s Weyerhaeuser (an American company) developed a state-of-the-art pulp mill in Kamloops, which produced more than just pulp. Weyerhaeuser&nbsp; owned sawmills that allowed them to have the rights to the raw materials and much more control over the end uses. Having both sawmills and pulp mills made economic&nbsp;sense because the&nbsp;by-products of the sawmills could be used.</p> <p>In&nbsp;the 1960s and 1970s, major investments were being made in production in BC’s Interior, as both&nbsp;the road and railway systems had increased to give more access to forest resources. The 1970s saw production increase but consolidation and integration meant fewer mills. New mills were&nbsp;more efficient, so older mills on&nbsp;the coast were pressured to compete more effectively with Interior&nbsp;investments. By the 1990s and&nbsp;early 2000s,&nbsp;increased economic pressure from a globalized market resulted in&nbsp;Prince Rupert, Powell River, Port Alice and Port Alberni mills being&nbsp;restructured, and the Gold River Mill closed.</p> 
	</div>


	</div>
<div class="chapter standard with-subsections" id="chapter-slug-7-5-forest-tree-tenures" title="Forest Tree Tenures">
	<div class="chapter-title-wrap">
		<p class="chapter-number">48</p>
		<h1 class="chapter-title">Forest Tree Tenures</h1>
								</div>
	<div class="ugc chapter-ugc">
				 <p>The provincial government manages the forestry industry and controls about 95% of the timber harvesting lands. Therefore, determining tenures and tax rates is important.&nbsp;Types of tenure, tree species, location, transportation and end use are all part of the basis for BC provincial taxes levied on the forestry industry.</p> <p>The term “timber tenure system” refers to the collection of legislation, regulations, contractual agreements, permits and government policies that define and constrain a person’s right to harvest the province’s timber. “Timber tenure” is commonly used to describe the agreement between a company and the government that grants rights to harvest a specified volume of timber. Tenure is the way in which rights are held;&nbsp;tenure is not a right itself. A wide variety of timber tenures are in place, reflecting the diverse objectives for forest use that have been pursued since the early 1900s.</p> <p>Forest tenure is complicated in BC due to environmental concerns (sustainable harvesting) and Aboriginal claims. In 1945, the Sloan Commission established new forms of tenure which resulted in amendments to Forest Act in 1947 and included changes to two forms of tenure.</p> <ol><li>Tree farm licenses, which are&nbsp;area-based tenure that grants private forest companies long-term renewable licenses, changed from 21 years to&nbsp;25 years.</li> <li>Public sustainable yield units (PSYUs) became volume based, changing the way that stumpage rates are charged.</li> </ol> <p><strong class="Bold">Tree farm licenses&nbsp;</strong>give a company the right and responsibility for building roads, planning and reforesting in an&nbsp;area. They allow a large amount of private control over the land. By 2001 there were 34 tree farm licenses in BC.</p> <p>In the past, Crown grants also allowed provincial forests to be controlled by private groups. Such grants gave&nbsp;cutting rights to private railway companies, which created an incentive to increase construction. Esquimalt and Nanaimo Railway Charter grants resulted in one-quarter of the Vancouver Island forests becoming private property.&nbsp;The actual amount of land in leased lands, timber leases or Crown grants make up 4% of the land total of BC. The grants accounted for most of the wood harvested until 1940s and still make up a substantial amount&nbsp;of today’s production. These private lands are some of the most productive in BC.</p> <p><strong class="Bold">Public sustained yield units (PSYUs)</strong> are a volume-based tenure. The Ministry of Forests, Lands and Natural Resource Operations determines the volume of wood to be harvested by private companies using harvest contracts and licenses. The ministry is also responsible for building roads and for reforesting. In the 1950s and 1960s, this tenure was mostly found in the Interior as fewer larger companies were in business in that region.</p> <p>The Forest Act of 1947 introduced several changes to:</p> <ul><li>Ensure industrial access to guaranteed long-term timber supplies</li> <li>Stimulate capital investment in processing plants and therefore assure economic stability and development</li> <li>Bring forests under “sustained yield management”&nbsp; (Edgell as cited by McGillvray, 2011)</li> </ul> <p>This act demonstrated a major shift in thinking:&nbsp;forests were not inexhaustible, they needed to be replanted and better managed. The two forms of tenure led to a debate over who was the better manager: the ministry with the PSYUs or the companies with the tree farm licenses.</p> <p>The Forest Act was amended again in 1978. The changes included the following:</p> <ul><li>All lands under old timber licenses (all forms of tenure except the Crown grants) would revert back to the Crown once they were harvested.</li> <li>Provincial forests were divided up into 36 management regions called timber supply areas (TSAs).</li> <li>Licenses and harvest contracts under the PSYUs were replaced with other licenses.</li> </ul> <p><strong class="Bold">Forest licenses&nbsp;</strong>became&nbsp;the most common form of tenure. With a forest license, the holder has the right to harvest a stated volume per year. The forest license has the same volume-based system of the PSYUs but with 15-year renewable terms. Timber license sales also replaced PSYUs, small business forest enterprise programs, wood lot licenses and several pulpwood agreements. Tree forest licenses and farm licenses&nbsp; accounted for 90% of annual allowable harvest in 1993.&nbsp;(The “annual allowable cut” is the rate of harvest, or volume of wood, allowed for each tenure type in each timber supply area.)</p> <p>The timber production increase&nbsp;from the 1960s (largely from the Interior) provoked new concerns about&nbsp;tenure privatization. Between 1981 and 1986, the recession brought on big changes to the industry and led to a decision to reduce the bureaucracy. In 1982, the Ministry of Forests proposed a policy change that would allow forest licenses and timber sale licenses of short duration (but&nbsp;under the government’s control) to be converted to tree farm licenses.&nbsp; By 1988, legislation was put in place to allow this to become possible. The public viewed this as a move to privatization because of the allowance for&nbsp;25-year&nbsp;renewable terms, and regarded the change as&nbsp;a lack of management of the forest.&nbsp; In response, the government scrapped the policy before it was implemented.</p> <p>Tenure proposals were put in place to increase the number of tree farm licenses. Round table discussions were held in the 1990s but they did not change much in the tenure system. There was a major increase in the number and size of public parks and protected areas, which meant that less land was available to be logged. By the 1990s, protected areas on the coasts doubled.</p> <p>Different types of tenure have led to questions such as the following:<br /> •&nbsp;&nbsp; &nbsp;What about the dominance of large corporations?<br /> •&nbsp;&nbsp; &nbsp;How can&nbsp;higher-value-added materials be obtained?<br /> •&nbsp;&nbsp; &nbsp;What about privatization?<br /> •&nbsp;&nbsp; &nbsp;Should trees be viewed as fibre only?<br /> •&nbsp;&nbsp; &nbsp;What else do trees provide?</p> <p>The provincial government benefits from the revenues derived from the forest industry.&nbsp;Most of the revenue comes from&nbsp;taxes, both direct and indirect.&nbsp;The main direct tax is stumpage fees on&nbsp;logs, which&nbsp;vary according to&nbsp;tree species, size, quality and end use. <strong class="Bold">Stumpage</strong> is the price charged by a land owner to companies or operators for the right to harvest timber on that land. It used to be calculated on a “per stump” basis (hence the name) but is now usually charged by tons, board feet or by cubic metres. Stumpage fees account for market value of wood, physical conditions of environment difficulty in obtaining the timber and volume per hectare,&nbsp;as well as types of tenure.</p> <p>There are also costs to the province associated with the forestry industry. For example:<br /> •&nbsp;&nbsp; &nbsp;Road building and engineering<br /> •&nbsp;&nbsp; &nbsp;Forest fire management: research, programs to minimize risk and fighting fires<br /> •&nbsp;&nbsp; &nbsp;Pest and disease management: research, programs to minimize risk and programs to fight pests and disease<br /> •&nbsp;&nbsp; &nbsp;Reforestation</p> 
	</div>


	</div>
<div class="chapter standard with-subsections" id="chapter-slug-7-6-case-study" title="Case Study 1: Mountain Pine Beetle">
	<div class="chapter-title-wrap">
		<p class="chapter-number">49</p>
		<h1 class="chapter-title">Case Study 1: Mountain Pine Beetle</h1>
								</div>
	<div class="ugc chapter-ugc">
				 <p>The <strong class="Bold">mountain pine beetle</strong>&nbsp;(<em class="Italic">Dendroctonus ponderosae</em>) is a species of bark beetle native to the forests of western North America. It has a hard black exoskeleton and measures approximately five millimetres in length,&nbsp;about the size of a grain of rice.</p> <div class="wp-caption aligncenter" style="width: 300px"><a href="http://opentextbc.ca/geography/wp-content/uploads/sites/34/2014/06/Dendroctonus_ponderosae.jpg" data-url="http://opentextbc.ca/geography/wp-content/uploads/sites/34/2014/06/Dendroctonus_ponderosae.jpg"><img src="http://opentextbc.ca/geography/wp-content/uploads/sites/34/2014/06/Dendroctonus_ponderosae.jpg" height="300" width="300" alt="" title="" /></a><div class="wp-caption-text">Figure 6.5 The Mountain Pine Beetle.</div></div> <p>The current outbreak of mountain pine beetle in British Columbia began in the early 1990s and&nbsp;is considered to be the largest ever recorded, affecting over 18.1 million hectares, or an area five times the size of Vancouver Island.</p> <p>The mountain pine beetle infestation has had a devastating effect on the forest of British Columbia and has killed about 50% of the total volume of commercial lodge pole pine in the province.</p> <div class="wp-caption aligncenter" id="attachment_157" aria-describedby="caption-attachment-157" style="width: 400px"><a href="http://opentextbc.ca/geography/wp-content/uploads/sites/34/2014/06/8621706469_3ba11bd46d_o-e1406241709639.jpg" data-url="http://opentextbc.ca/geography/wp-content/uploads/sites/34/2014/06/8621706469_3ba11bd46d_o-e1406241709639.jpg"><img class="wp-image-157" alt="Figure 2. Interior British Columbia lodgepole pine forest affected by mountain pine beetle." src="http://opentextbc.ca/geography/wp-content/uploads/sites/34/2014/06/8621706469_3ba11bd46d_o-e1406241709639.jpg" height="300" width="400" title="" /></a><div class="wp-caption-text" id="caption-attachment-157">Figure 6.6 Interior British Columbia lodgepole pine forest affected by the mountain pine beetle</div></div> <p>In British Columbia, the infestation peaked in 2005 and has been decreasing each year as the amount of available mature pines decreases. In 2012 about 3 million hectares of BC forest was designated as <strong class="Bold">red-attack</strong>, which is where the needles of infected trees turn red as a result of the beetle killing the tree. This is down from 2011 when the amount of red-attack forest was 4.6 million hectares.</p> <div class="wp-caption aligncenter" id="attachment_158" aria-describedby="caption-attachment-158" style="width: 400px"><a href="http://opentextbc.ca/geography/wp-content/uploads/sites/34/2014/06/Cumulative_Pine_Killed_-_1999_to_2020.gif" data-url="http://opentextbc.ca/geography/wp-content/uploads/sites/34/2014/06/Cumulative_Pine_Killed_-_1999_to_2020.gif"><img class="wp-image-158" alt="Figure 3 Cumulative percentage of pine killed and projected to die 2020. If you are reading this in the print or PDF version of this book, you can view this animation by going to the following weblink: http://www.for.gov.bc.ca/hfp/mountain_pine_beetle/maps.htm" src="http://opentextbc.ca/geography/wp-content/uploads/sites/34/2014/06/Cumulative_Pine_Killed_-_1999_to_2020.gif" height="300" width="400" title="" /></a><div class="wp-caption-text" id="caption-attachment-158">Figure 6.7 Cumulative percentage of pine killed and projected to die 2020. If you are reading this in the print or PDF version of this book, you can view this animation by going to the following weblink: http://www.for.gov.bc.ca/hfp/mountain_pine_beetle/maps.htm</div></div> <h2>Causes of the Infestation</h2> <p>Scientists believe that warmer summers and milder winters play an important contributing role to the beetle infestation. Cold Canadian winters with temperatures below -40°C normally kill the beetle as well as pine beetle eggs and larvae. But milder winters and warmer summers have meant more beetles survive the winter.&nbsp;Until recently, it was believed that the mountain pine beetle could successfully attack only mature pine trees, but in recent years it has&nbsp;started to attack younger trees.</p> <h2>Increased Fire Hazard</h2> <p>It is believed that large areas of dead pine stands represent a potential fire hazard. The BC government is addressing this concern by directing fuel management activities in beetle areas as recommended in the 2003 Firestorm Provincial Review. Harvesting the affected stands of trees aids fire management by removing the presumed hazard and breaking the continuity of the fuels. These fuel management treatments are specifically designed to reduce <strong class="Bold">interface </strong>fire threats to communities located in the infestation zone. (The interface is the area where urban development and wilderness meet.)</p> <h2>Life Cycle and Pine Tree Infestation</h2> <p>Beetles develop through four stages: egg, larva, pupa and adult. &nbsp;Except for a few days during the summer when adults emerge from brood trees and fly to attack new host trees, all life stages are spent beneath the bark.</p> <p>In low elevation stands and in warm years, mountain pine beetles require one year to complete a generation. At high elevations, where summers are typically cooler, life cycles may vary from one to two years.</p> <p>It is the female beetle who initiates an attack. As they chew into the inner bark and phloem (the living tissue that carries organic nutrients), pheromones are released, attracting male and female beetles to the same tree. The attacking beetles produce more pheromones, resulting in a mass attack that overcomes the tree’s defences, resulting in attacks on adjacent trees.</p> <p>When the tree is first attacked, it remains green. Usually within a year of attack, the needles will have turned red. This means the tree is dying or dead, and the beetles have moved to another tree. In three to four years after the attack, very little foliage is left, so the trees appear grey.</p> <p>Natural predators of the mountain pine beetle include certain birds, particularly woodpeckers, and various insects.</p> <div class="wp-caption aligncenter" id="attachment_159" aria-describedby="caption-attachment-159" style="width: 400px"><a href="http://opentextbc.ca/geography/wp-content/uploads/sites/34/2014/06/MPB_Infested_tree-e1406243865804.jpg" data-url="http://opentextbc.ca/geography/wp-content/uploads/sites/34/2014/06/MPB_Infested_tree-e1406243865804.jpg"><img class="wp-image-159" alt="Figure 4. Pine tree infested by MPB, the pitch tube that the tree is creating to force the beetle out are clearly visible." src="http://opentextbc.ca/geography/wp-content/uploads/sites/34/2014/06/MPB_Infested_tree-e1406243865804.jpg" height="255" width="400" srcset="https://opentextbc.ca/geography/wp-content/uploads/sites/34/2014/06/MPB_Infested_tree-e1406243865804.jpg 639w, https://opentextbc.ca/geography/wp-content/uploads/sites/34/2014/06/MPB_Infested_tree-e1406243865804-300x191.jpg 300w, https://opentextbc.ca/geography/wp-content/uploads/sites/34/2014/06/MPB_Infested_tree-e1406243865804-65x41.jpg 65w, https://opentextbc.ca/geography/wp-content/uploads/sites/34/2014/06/MPB_Infested_tree-e1406243865804-225x143.jpg 225w, https://opentextbc.ca/geography/wp-content/uploads/sites/34/2014/06/MPB_Infested_tree-e1406243865804-350x222.jpg 350w" sizes="auto, (max-width: 400px) 100vw, 400px" title="" /></a><div class="wp-caption-text" id="caption-attachment-159">Figure 6.8 Pine tree infested by mountain pine beetle;&nbsp;the pitch tube that the tree is creating to force the beetle out is clearly visible</div></div> <h2>Infestation Detection and Monitoring through Remote Sensing</h2> <p>Digital or film aerial photography is a popular method for monitoring and precisely mapping vast areas.&nbsp;Recently the digital era reached aerial photography and since&nbsp;2010 almost all images acquired worldwide are done by direct digital cameras. Satellite imagery is another method of&nbsp;acquiring images from space.</p> <p>Both methods have advantages and disadvantages that relate to the nature of the acquisition and image quality. Remote sensing and aerial photography are used extensively to monitor diverse forest environments, map cities or countries and identify geological structures.&nbsp; Precise mapping is an example of a remote sensing process that has reached technical maturity and is used in practical applications worldwide.&nbsp; Image classification is generally accomplished by several procedures that involve human vision and/or computer algorithms.&nbsp; Visual image segmentation is conducted by interpretation of targets from within an image on a computer monitor, while aerial photographic segmentation is performed a large-format photograph hardcopy prints (23-cm²) and can be assisted with an overlapping image acquired at a different angle that enables three-dimensional vision.&nbsp; Statistical computerized image analysis is undertaken with algorithms that segment the image into several predetermined classes within a digital image.</p> <p>Forest areas are frequently surveyed by various remote sensing devices for both practical and experimental purposes.&nbsp; The application of classification methods for forest mapping and classification reaches relatively acceptable levels of classification accuracy (65% to 90%), depending on data quality and implemented procedures.&nbsp; Mountain pine beetle&nbsp;infestation can be detected and monitored&nbsp;by remote sensing methods.&nbsp; This can be done visually on computer monitor or directly by flying above an infested area.&nbsp; The main characteristic of infested trees is the reddish colour on the tree crowns.</p> <div class="wp-caption aligncenter" id="attachment_160" aria-describedby="caption-attachment-160" style="width: 400px"><a href="http://opentextbc.ca/geography/wp-content/uploads/sites/34/2014/06/Healthy_pine_trees_and_trees_infested_by_MPB.jpg" data-url="http://opentextbc.ca/geography/wp-content/uploads/sites/34/2014/06/Healthy_pine_trees_and_trees_infested_by_MPB.jpg"><img class="wp-image-160" alt="Figure 5. Healthy pine trees (green) and trees infested by MPB (red). The delineating polygons used for computerized classification procedures." src="http://opentextbc.ca/geography/wp-content/uploads/sites/34/2014/06/Healthy_pine_trees_and_trees_infested_by_MPB.jpg" height="275" width="400" srcset="https://opentextbc.ca/geography/wp-content/uploads/sites/34/2014/06/Healthy_pine_trees_and_trees_infested_by_MPB.jpg 681w, https://opentextbc.ca/geography/wp-content/uploads/sites/34/2014/06/Healthy_pine_trees_and_trees_infested_by_MPB-300x206.jpg 300w, https://opentextbc.ca/geography/wp-content/uploads/sites/34/2014/06/Healthy_pine_trees_and_trees_infested_by_MPB-65x44.jpg 65w, https://opentextbc.ca/geography/wp-content/uploads/sites/34/2014/06/Healthy_pine_trees_and_trees_infested_by_MPB-225x154.jpg 225w, https://opentextbc.ca/geography/wp-content/uploads/sites/34/2014/06/Healthy_pine_trees_and_trees_infested_by_MPB-350x241.jpg 350w" sizes="auto, (max-width: 400px) 100vw, 400px" title="" /></a><div class="wp-caption-text" id="caption-attachment-160">Figure 6.9. Healthy pine trees (green) and trees infested by mountain pine beetle&nbsp;(red); the delineating polygons used for computerized classification procedures</div></div> <h3>Attributions</h3> <ul><li><strong>Figure 6.5</strong> Measurement of the mountain pine beetle. Mountain Pine Beetle (http://en.wikipedia.org/wiki/Mountain_pine_beetle) by US Forest Service (http://en.wikipedia.org/wiki/United_States_Forest_Service) (Public Domain)</li> <li><strong>Figure 6.6</strong> Interior British Columbia&nbsp;lodgepole&nbsp;pine forest&nbsp;affected by mountain pine beetle. Pine beetle infested forest (https://flic.kr/p/e8SuXx) by Simon Fraser University (https://www.flickr.com/photos/sfupamr/) under CC BY (https://creativecommons.org/licenses/by/2.0/)</li> <li><strong>Figure 6.7 </strong>Cumulative percentage of pine killed and projected to die 2020 from A History of the Battle Against the Mountain Pine Beetle 2000-2012 B.C. Ministry of&nbsp; Forestry (http://www.for.gov.bc.ca/hfp/mountain_pine_beetle/maps.htm).</li> <li><strong>Figure 6.8</strong>. Pine tree infested by mountain pine beetle; the pitch tube that the tree is creating to force the beetle out are clearly visible. Infested Tree (http://en.wikipedia.org/wiki/Mountain_pine_beetle#mediaviewer/File:Infested_tree.jpg) by Padraic (http://commons.wikimedia.org/wiki/User:Padraic) under CC BY SA 2.5 (http://creativecommons.org/licenses/by-sa/2.5/ca/deed.en).</li> <li><strong>Figure 6.9.</strong> Healthy pine trees (green) and trees infested by mountain pine beetle (red);&nbsp;the delineating polygons used for computerized classification procedures. Image from&nbsp;Ettya A. 2009. Integrated Multitemporal and Multiangular High Spatial Resolution Image Classification.&nbsp;Burnaby. SFU. &nbsp;PHD Dissertation.</li> </ul> 
	</div>


	</div>
<div class="chapter standard with-subsections" id="chapter-slug-7-7-summary" title="Summary">
	<div class="chapter-title-wrap">
		<p class="chapter-number">50</p>
		<h1 class="chapter-title">Summary</h1>
								</div>
	<div class="ugc chapter-ugc">
				 <p>Forests&nbsp;are&nbsp;a vital part of the province’s history and sustainable forestry&nbsp;management is a essential part of a its&nbsp;future. The forest industry relies primarily on coniferous trees to for domestic and export markets. Harvest occurs both in natural stands and industrially planted stands.&nbsp;Within the province, reforestation is strictly regulated so that new forests mirror the diversity of natural forests&nbsp;and support the sustainable harvest of commercially valuable timber. The goal of these&nbsp;regulations&nbsp;is to ensure that BC forests contain genetic diversity, an important element in maintaining ecosystem resilience. British Columbia uses a mix of over 20 different native tree species in its reforestation programs.</p> <p>The current annual allowable cut (AAC) is 75 million cubic metres. Both timber and non-timber values are considered in calculating AACs. For example, the following factors are considered:</p> <ul><li>&nbsp; No-cut buffer zones</li> <li>&nbsp; Insect/fire/disease losses</li> <li>&nbsp; Logging losses</li> <li>&nbsp; Operational constraints</li> <li>&nbsp; Environmental and wildlife considerations</li> </ul> <p>Technological advances in the logging industry have greatly affected the lumber production. Technology allowed mills to&nbsp;switch from labour-intensive to capital-intensive entities, and all aspects of milling are now&nbsp;automated for&nbsp;debarking logs, saw milling, grading, and green chain (an assembly line of fresh cut timber).&nbsp;Technological advances include:</p> <ul><li>Transportation (railways, rafts, trucks, bulldozers)</li> <li>The donkey engine</li> <li>The mechanical spar pole</li> <li>The feller&nbsp;buncher</li> <li>Hydraulic barkers and new band saws</li> </ul> <p>Global demand in the 20th century introduced a greater need for pulp and paper mills. Mills rose throughout the region of BC in places such as Prince Rupert, Duncan Bay, Port Alberni, Marmac and Victoria.</p> <p>BC owns approximately over 90% of the forested land, which means that determining tenures and tax rates is important. Tenure is the way in which rights are held; tenure is not a right itself. Tenures in the region include:</p> <ul><li>Tree farm licenses</li> <li>Public sustained yield units</li> <li>Forest licenses</li> </ul> 
	</div>


	</div>
<div class="chapter standard with-subsections" id="chapter-slug-7-10-key-terms" title="Key Terms">
	<div class="chapter-title-wrap">
		<p class="chapter-number">51</p>
		<h1 class="chapter-title">Key Terms</h1>
								</div>
	<div class="ugc chapter-ugc">
				 <div class="bcc-box bcc-success"><h3>Key Terms</h3> <p><strong><strong class="Bold">Annual allowable cut (AAC):</strong> </strong>The amount of forest in BC allowed to be harvested. Currently the AAC is 75 million cubic metres, including the temporary increases totalling about 5.5 million cubic metres that are in place for salvaging timber attacked by mountain pine beetle in the Interior.</p> <p><strong>Coniferous:&nbsp;</strong>&nbsp;Refers to trees that are cone-bearing and evergreen. Coniferous trees make up the majority of broad tree species in British Columbia&nbsp;(pine, spruce, fir, cedar and hemlock) and are the most commonly harvested for the lumber and pulp industry. These trees tend to grow slowly between the fast-growing deciduous trees. Eventually they grow to take the majority of the sunlight and cause the death of the previously predominant deciduous trees.<br /> <strong><br /> <strong class="Bold">Davis raft:</strong> </strong>A&nbsp;raft used to&nbsp;prevent breakup of logs, which was later&nbsp;replaced by much better barge system (self-loading and self-dumping).</p> <p><strong>Deciduous:</strong> A term used to describe&nbsp;trees and&nbsp;shrubs that lose their leaves seasonally (commonly during autumn)&nbsp;and to&nbsp;plants that lose their petals after flowering or fruit when ripe.</p> <p><strong><strong class="Bold">Donkey engine:</strong></strong> The nickname for a steam-powered winch, or logging engine, widely used in past logging operations, though not limited to logging.</p> <p><strong class="Bold">Feller&nbsp;buncher: </strong>A machine with metal tracks that cuts limbs and stacks logs all at once.</p> <p><strong class="Bold">Forest license: </strong>The most common type of tenure in which the holder has right to harvest a stated volume per year.&nbsp;The forest license has same volume-based system of the PSYUs but with 15-year renewable terms.</p> <p><strong>Interface:</strong> The area where urban development and wilderness meet.</p> <p><strong class="Bold">Mountain pine beetle</strong><strong>:</strong>&nbsp; A species of bark beetle native to the forests of western North America. It has a hard black exoskeleton, and measures approximately five millimetres, about the size of a grain of rice.</p> <p><strong class="Bold">Multinational corporations:</strong> Organizations that own or control production or services facilities in one or more countries other than the home country.</p> <p><strong class="Bold">Public sustained yield units (PSYUs):</strong> A volume-based tenure. The Ministry of Forests, Lands and Natural Resource Operations determines the volume of wood to be harvested by private companies using harvest contracts and licenses.</p> <p><strong class="Bold"><strong class="Bold">Red-attack:</strong></strong>&nbsp;A term used to describe the level of mountain pine beetle infestation&nbsp;where the needles of infected trees turn red as a result of the beetle killing the tree.</p> <p><strong>Reforestation:</strong>&nbsp; The natural or intentional restocking of existing forests and woodlands that have been depleted, usually through deforestation.<sup id="cite_ref-1" class="reference">[1]</sup> Reforestation can be used to improve the quality of human life by soaking up pollution and dust from the air, rebuild natural habitats and ecosystems, mitigate global warming since forests facilitate biosequestration of atmospheric carbon dioxide, and harvest for resources, particularly timber.</p> <p><strong class="Bold">Stumpage:</strong>&nbsp; The price charged by the province to a land owner to companies or operators for the right to harvest timber on that land.</p> <p><strong class="Bold">Tree farm license:&nbsp;</strong> A license given to&nbsp;a company for the right and responsibility for building roads, planning, and reforesting in an&nbsp;area. It allows a large amount of private control over the land.</p> <p><strong class="Bold">Winch:</strong>&nbsp; A mechanical device that is used to pull in (wind up) or let out (wind out) or otherwise adjust the tension of a rope or wire rope (also called “cable” or “wire cable”).</p> </div> <p>&nbsp;</p> 
	</div>


	</div>
<div class="chapter standard with-subsections" id="chapter-slug-7-8-activities" title="Suggested Activities">
	<div class="chapter-title-wrap">
		<p class="chapter-number">52</p>
		<h1 class="chapter-title">Suggested Activities</h1>
								</div>
	<div class="ugc chapter-ugc">
				 <div class="bcc-box bcc-info"><h3>Suggested Activities</h3> <h2>Activity 1</h2> <p>Walk around your neighbourhood and nearby parks.&nbsp;Take pictures of coniferous and deciduous trees that are native to the BC landscape.&nbsp;(You can use a cell phone camera or a digital camera.)&nbsp;Take pictures of the leaves, bark, flowers, fruits&nbsp;and either a profile or full stand of the tree including the tree crown. Identify the trees. Create an image&nbsp;presentation that describes the species you saw and what ecosystem you explored. (Why were these plants located here?)&nbsp;If you wish, contribute these photos to the BC eFlora and eFauna website&nbsp;<a href="http://www.geog.ubc.ca/biodiversity/eflora/" target="_blank" data-url="http://www.geog.ubc.ca/biodiversity/eflora/">http://www.geog.ubc.ca/biodiversity/eflora/</a></p> <h2>Activity 2</h2> <p>Build a 3D model of a tree using <a href="http://www.sketchup.com/products/sketchup-pro" target="_blank" data-url="http://www.sketchup.com/products/sketchup-pro">Google Sketch Up</a>, Geo-reference the tree in Google Earth where you may find the tree in British Columbia.</p> </div> <p>&nbsp;</p> 
	</div>


	</div>
<div class="chapter standard with-subsections" id="chapter-slug-7-9-references-and-resources" title="References and Resources">
	<div class="chapter-title-wrap">
		<p class="chapter-number">53</p>
		<h1 class="chapter-title">References and Resources</h1>
								</div>
	<div class="ugc chapter-ugc">
				 <h2>References</h2> <p>BC Stats, 2014. Annual BC Origin Exports. <a target="_blank" href="http://www.bcstats.gov.bc.ca/StatisticsBySubject/ExportsImports/Data.aspx" data-url="http://www.bcstats.gov.bc.ca/StatisticsBySubject/ExportsImports/Data.aspx">http://www.bcstats.gov.bc.ca/StatisticsBySubject/ExportsImports/Data.aspx</a> (accessed 06.13.2014)</p> <p>British Columbia, Ministry of Forests, Parish, R., Thomson, S.M., Canada-British Columbia Partnership Agreement on Forest Resource Development: FRDA II, 1994. Tree book learning to recognize trees of British Columbia.</p> <p>British Columbia, Ministry of Forests, Mines and Lands. 2010. The State of British Columbia’s Forests, 3rd ed. Forest Practices and Investment Branch, Victoria, B.C. <a target="_blank" href="http://www.for.gov.bc.ca/hfp/sof/index.htm#2010_report" data-url="http://www.for.gov.bc.ca/hfp/sof/index.htm#2010_report">www.for.gov.bc.ca/hfp/sof/index.htm#2010_report</a>, pg. 8.</p> <p>CBC, 2013. Mountain pine beetle poised to ravage Eastern Canada – Technology &amp; Science – CBC News [WWW Document]. URL <a target="_blank" href="http://www.cbc.ca/news/technology/mountain-pine-beetle-poised-to-ravage-eastern-canada-1.1339467" data-url="http://www.cbc.ca/news/technology/mountain-pine-beetle-poised-to-ravage-eastern-canada-1.1339467">http://www.cbc.ca/news/technology/mountain-pine-beetle-poised-to-ravage-eastern-canada-1.1339467</a> (accessed 8.29.14).</p> <p>Employment and Social Development Canada, 2013. Labour Market Bulletin. <a target="_blank" href="http://www.esdc.gc.ca/eng/jobs/lmi/publications/bulletins/bc/bc-lmb-201307.pdf%20" data-url="http://www.esdc.gc.ca/eng/jobs/lmi/publications/bulletins/bc/bc-lmb-201307.pdf%20">http://www.esdc.gc.ca/eng/jobs/lmi/publications/bulletins/bc/bc-lmb-201307.pdf </a>(accessed 06.14.2014)</p> <p>Ettya A. 2009. Integrated Multitemporal and Multiangular High Spatial Resolution Image Classification.&nbsp;Burnaby. SFU. &nbsp;PHD Dissertation.</p> <p>Government of British Columbia, 2013. Facts About B.C.’s Mountain Pine Beetle. Government of British Columbia. <a target="_blank" href="http://www.for.gov.bc.ca/hfp/mountain_pine_beetle/Updated-Beetle-Facts_April2013.pdf" data-url="http://www.for.gov.bc.ca/hfp/mountain_pine_beetle/Updated-Beetle-Facts_April2013.pdf">http://www.for.gov.bc.ca/hfp/mountain_pine_beetle/Updated-Beetle-Facts_April2013.pdf</a> (accessed 6.12.2014)</p> <p>Government of Canada, S.C., 2013. The Daily — Manufacturing at a glance: The Canadian lumber industry, 2003 to 2012 [WWW Document]. URL <a target="_blank" href="http://www.statcan.gc.ca/daily-quotidien/131112/dq131112a-eng.htm" data-url="http://www.statcan.gc.ca/daily-quotidien/131112/dq131112a-eng.htm">http://www.statcan.gc.ca/daily-quotidien/131112/dq131112a-eng.htm</a> (accessed 8.29.14).</p> <p>Government of Canada, 2014. Mountain pine beetle | Natural Resources Canada [WWW Document]. URL http://www.nrcan.gc.ca/forests/insects-diseases/13381 (accessed 8.29.14).</p> <p>Mountain pine beetle, 2014. . Wikipedia, the free encyclopedia. http://en.wikipedia.org/wiki/Mountain_pine_beetle (accessed 6.13.2014)</p> <p>McGillivray, B., 2011. Geography of British Columbia: people and landscapes in transition, 3rd ed. ed. UBC Press, Vancouver.</p> 
	</div>


	</div>

</div>
<div class="part-wrapper" id="part-chapter-8-wrapper">
    <div class="part  " id="part-chapter-8">
	<div class="part-title-wrap">
		<p class="part-number">VII</p>
		<h1 class="part-title">7. Health Geography in British Columbia</h1>
	</div>
	<div class="ugc part-ugc">
		<div class="bcc-box bcc-highlight"><h3>Learning Objectives</h3> <ul><li>Develop an understanding of the great diversity of perspectives within the sub-discipline of health geography.</li> <li>Develop an understanding of&nbsp;how health is related to the spatial distribution of people and resources.</li> <li>Think critically&nbsp;about interrelationships of health and place.</li> <li>Define “The Golden Hour” and describe the implications of it.</li> <li>Describe different types of health geographies.</li> </ul> </div> <p>&nbsp;</p>
	</div>
			
				
	</div>
<div class="chapter standard with-subsections" id="chapter-slug-8-2-introduction" title="Introduction">
	<div class="chapter-title-wrap">
		<p class="chapter-number">54</p>
		<h1 class="chapter-title">Introduction</h1>
								</div>
	<div class="ugc chapter-ugc">
				 <p>Health geography emerged as a separate sub-discipline of Geography in the mid-1990s out of a desire to return to a study of place and landscape on experiences of health and ill health. It is focused on the&nbsp;experience of health and the role of place including, but not limited&nbsp;to, the study of disease ecology and mapping, health service provisions, therapeutic landscapes, public health policy, health in the workplace, patient experience,&nbsp;experience of disease, experience of disability, geographies of care and responsibility and embodiments of mental (ill) health&nbsp;(Brown,&nbsp;McLafferty, &amp; Moon,&nbsp;2004). On&nbsp;a multi-scalar perspective,&nbsp;<strong class="Bold">social determinants of health</strong> influence the levels of health experienced by populations.&nbsp;These determinants include:</p> <ul><li>Income levels and social status</li> <li>Social support networks</li> <li>Education</li> <li>Employment/working conditions</li> <li>Social environments</li> <li>Physical environments</li> <li>Personal health practices and coping skills</li> <li>Healthy child development</li> <li>Gender</li> <li>Culture</li> </ul> <p>As we have learned in other sections of this book, British Columbians come from a variety of backgrounds and enjoy living in urban, suburban and rural settings. The spatial distribution of people, or where citizens live, will greatly affect their health and access to health care. For example,&nbsp;a person living&nbsp;in an urban area is likely to walk more often than someone living&nbsp;in a rural setting. The air quality will vary from urban to rural settings as well. A person’s health also influences his or her&nbsp;experience of a place. The study of health geography investigates all of these issues.</p> 
	</div>


	</div>
<div class="chapter standard with-subsections" id="chapter-types-of-health-geographies" title="Types of Health Geographies">
	<div class="chapter-title-wrap">
		<p class="chapter-number">55</p>
		<h1 class="chapter-title">Types of Health Geographies</h1>
								</div>
	<div class="ugc chapter-ugc">
				 <p>Health is understood as the physical, mental and in some cases the&nbsp;spiritual state of a person or population. It is more that just the absence of sickness or disease;&nbsp;the notion encompasses individual and community perception of “good” or “bad” heath. The&nbsp;<strong>r</strong><strong class="Bold">ight to health</strong>, which Health Canada and all provincial health services ascribe to, was set out in the United Nations <a href="http://www.un.org/en/documents/udhr/index.shtml#a25" target="_blank" data-url="http://www.un.org/en/documents/udhr/index.shtml#a25">Universal Declaration&nbsp;of Human Rights</a>,&nbsp;<span class="footnote"><span class="footnote-indirect" data-fnref="462-1"></span></span> incorporated in 1948.</p> <blockquote><p>Everyone has the right to a standard of living adequate for the health and well-being of himself and of his family, including food, clothing, housing and medical care and necessary social services, and the right to security in the event of unemployment, sickness, disability, widowhood, old age or other lack of livelihood in circumstances beyond his control. –Universal Declaration of Human Rights 25(1). 1948</p></blockquote> <p>Health affects entire populations and is a key determinate to our well-being, the overall individual and social state of wellness, and quality of life. Thus, it is monitored by provincial and local health authorities in Canada. To better monitor health conditions and access to health care, <strong>public health surveillance</strong> systems need to be in place. <strong class="Bold">Public health surveillance </strong>is the collection, analysis, interpretation and dissemination of data on public health issues and its social and environmental determinants. These data are collected in order to better understand <strong>spatial e</strong><strong class="Bold">pidemiology, </strong>which&nbsp;is the study of patterns, causes and effects of health and diseases among certain populations.</p> <p>A <strong class="Bold">geographic information systems (GIS)</strong>&nbsp;can be used to monitor and track health information for the study of epidemiology and for health surveillance purposes. GIS is not just a technological “fix” for health and mobility problems but rather a device that has the capability of informing decision-makers and the public about where needs exist. For example, GIS has been used to offer decision support for health catchment areas for planning health resources in dispersed populations in rural BC (Schuurman, Randall, &amp; Berube, 2011).</p> <p><strong class="Bold">Telehealth</strong> applications allow physicians to provide care at a distance and provide&nbsp;a promising and unique means to provide health care and health education to dispersed populations. Northern portions of British Columbia may benefit from communication with a physician or nurse through the use of communication technologies. These technologies make it possible to communicate despite great distances that separate doctors and their patients. (Read more about the uptake of telehealth in British Columbia in <a href="http://www.theglobeandmail.com/report-on-business/small-business/starting-out/virtual-checkup-vancouver-startup-connects-doctors-patients-through-video-chat/article12445957/" target="_blank" data-url="http://www.theglobeandmail.com/report-on-business/small-business/starting-out/virtual-checkup-vancouver-startup-connects-doctors-patients-through-video-chat/article12445957/">this <em>Globe and Mail</em> article</a><span class="footnote"><span class="footnote-indirect" data-fnref="462-2"></span></span> about Medeo, a telehealth provider in BC).</p> <p><strong class="Bold">Mobile health (mHealth)&nbsp;</strong>is an emerging field; it<strong class="Bold">&nbsp;</strong>is&nbsp;the practice of medicine and public health supported by mobile devices. mHealth can be used for data collection for monitoring patients, informing diagnosis, organizing electronic medical records and for data dissemination by presenting health care resources, recommendation and education from doctors to patients using the mobile devices.</p> <p>Other health geographies in BC include investigating geographies of care in rural and northern communities, health inequities, Aboriginal health, child and family care, palliative and other types of care giving, medical tourism, and&nbsp;geographies of mental health and addictions, and the intersection of geographies of health and aging. These health geographies are often concerned with access, equity, experience and outcomes. For example, <span style="background-color: #ffffff;">First Nations people in Canada have&nbsp;higher rates of morbidity, trauma, illness, suicide, addiction, mental health issues and&nbsp;unwanted teenage pregnancy. Understanding how to address those issues from a comprehensive health promotion perspective&nbsp;is being explored on various fronts. Political health geographies of HIV/AIDS in BC have also been an active area of inquiry. &nbsp;</span></p> <p><span style="background-color: #ffffff;">More recently in health geography, the comprehensive understandings of health and place that are promoted has lead to a focus on&nbsp;<strong class="Bold">intersectionality</strong>, which is an approach that prioritizes&nbsp;the</span>&nbsp;interrelationships of gender, class, race and ethnicity and other social divisions and seeks to understand how power relations structure these relationships. As it is applied to health geography, intersectionality&nbsp; also considers&nbsp;these interrelationships with spatiality, or the way that place also factors into this complex system that contributes to a state of health.</p> 
	</div>
			
				
				<div class="footnotes"><div id='462-1'>
<p>United Nations Universal Declaration of Human Rights <a href="http://www.un.org/en/documents/udhr/index.shtml#a25" target="_blank" data-url="http://www.un.org/en/documents/udhr/index.shtml#a25">http://www.un.org/en/documents/udhr/index.shtml#a25</a></p>

</div><div id='462-2'>
<p>Connecting doctors with patients with Medeo article from the <em>Globe and Mail</em> <a href="http://www.theglobeandmail.com/report-on-business/small-business/starting-out/virtual-checkup-vancouver-startup-connects-doctors-patients-through-video-chat/article12445957" target="_blank" data-url="http://www.theglobeandmail.com/report-on-business/small-business/starting-out/virtual-checkup-vancouver-startup-connects-doctors-patients-through-video-chat/article12445957">http://www.theglobeandmail.com/report-on-business/small-business/starting-out/virtual-checkup-vancouver-startup-connects-doctors-patients-through-video-chat/article12445957</a>/</p>

</div></div>
	</div>
<div class="chapter standard with-subsections" id="chapter-slug-8-3-case-studies" title="Case Study 1: The &quot;Golden Hour&quot; and Access to Health Care">
	<div class="chapter-title-wrap">
		<p class="chapter-number">56</p>
		<h1 class="chapter-title">Case Study 1: The &quot;Golden Hour&quot; and Access to Health Care</h1>
								</div>
	<div class="ugc chapter-ugc">
				 <p>A significant, but often overlooked, public health concern that could benefit from public health surveillance is that of injury.</p> <blockquote><p>Although injury does transcend socio-economic status, age, sex and other dimensions of difference, noticeable variations do exist. Analysis of injury data has revealed that particular age groups, social classes, and geographic locations are disproportionately suffering injuries. Through injury surveillance it is possible to identify causes of injury and appropriate evidence-based injury prevention efforts to be implemented that may target the affected population group or location (Cinnamon, 2013).</p></blockquote> <p>Professor <a href="http://www.sfu.ca/gis/schuurman/" target="_blank" data-url="http://www.sfu.ca/gis/schuurman/">Nadine Schuurman</a>&nbsp;<span class="footnote"><span class="footnote-indirect" data-fnref="171-1"></span></span> and her research group have made great strides in injury surveillance research. Schuurman and her colleagues (2006) created a model to show hospital catchment areas in rural BC. Their model implemented spatial road network analysis combined with population data to represent access to hospital-based care services and travel time for the population. The model shows the spatial distribution of the&nbsp;“golden hour.”&nbsp;In acute trauma, receiving medical treatment within one&nbsp;“golden hour” will greatly increase an individual’s chance of survival.&nbsp;&nbsp;This model takes into account the&nbsp;unique&nbsp;geographic features in BC such as mountains and large water bodies that influence the time it takes to get to a hospital in rural areas of BC.</p> <div class="wp-caption aligncenter" id="attachment_169" aria-describedby="caption-attachment-169" style="width: 400px"><a href="http://opentextbc.ca/geography/wp-content/uploads/sites/34/2014/06/1HourService1-e1406241904833.jpg" data-url="http://opentextbc.ca/geography/wp-content/uploads/sites/34/2014/06/1HourService1-e1406241904833.jpg"><img class="wp-image-169" alt="Figure. 1 hour service areas for all hospitals in Rural British Columbia" src="http://opentextbc.ca/geography/wp-content/uploads/sites/34/2014/06/1HourService1-e1406241904833.jpg" height="235" width="400" title="" /></a><div class="wp-caption-text" id="caption-attachment-169">Figure 7.1 One-hour service areas for all hospitals in rural British Columbia.</div></div> <p>&nbsp;</p> <h2>Attributions</h2> <ul><li><strong>Figure 7.1</strong>. One-hour service areas for all hospitals in rural British Columbia&nbsp;by Schuurman, Fiedler, Grzybowski and Gund (<a href="http://www.biomedcentral.com/content/pdf/1476-072x-5-43.pdf" target="_blank" data-url="http://www.biomedcentral.com/content/pdf/1476-072x-5-43.pdf">http://www.biomedcentral.com/content/pdf/1476-072x-5-43.pdf</a>) used under CC-BY 2.0 license (<a href="http://creativecommons.org/licenses/by/2.0/" target="_blank" data-url="http://creativecommons.org/licenses/by/2.0/">http://creativecommons.org/licenses/by/2.0/</a>)</li> </ul> 
	</div>
			
				
				<div class="footnotes"><div id='171-1'>
<p>Professor Nadine Schuurman <a href="http://www.sfu.ca/gis/schuurman/" target="_blank" data-url="http://www.sfu.ca/gis/schuurman/">http://www.sfu.ca/gis/schuurman/</a></p>

</div></div>
	</div>
<div class="chapter standard with-subsections" id="chapter-case-study-2-5" title="Case Study 2: Urban Heat Islands, Health and Spatial Technologies">
	<div class="chapter-title-wrap">
		<p class="chapter-number">57</p>
		<h1 class="chapter-title">Case Study 2: Urban Heat Islands, Health and Spatial Technologies</h1>
								</div>
	<div class="ugc chapter-ugc">
				 <p>Air temperature is greatly influenced by microclimates,&nbsp;and&nbsp;urban areas have disproportionately higher temperatures due&nbsp;to the thermal properties of humanmade materials, lower vegetation cover and less evapotranspiration, as well as complex surface morphology that traps outgoing longwave radiation. Being able to&nbsp;map the intensity and extent of&nbsp;urban heat islands with existing data enables mitigation of&nbsp;the negative ramifications for health-related heat risk (Tomlinson, Chapman, Thornes, &amp; Baker, 2011).</p> <p>Hung Chak Ho and Dr. Anders Knudby, researchers from Simon Fraser University, are combining weather data collected by volunteers,&nbsp;government&nbsp;weather stations and remotely sensed data to understand and predict&nbsp;temperature variability in&nbsp;Vancouver, BC. These researchers are&nbsp;most&nbsp;interested in summer months because of the changes in climate because&nbsp;significantly higher temperatures in the summer increase&nbsp;health risks,&nbsp;especially for&nbsp;certain populations such as the elderly and others with social and emotional vulnerability (Kovats &amp;&nbsp;Hajat,&nbsp;2008).</p> <div class="wp-caption aligncenter" id="attachment_170" aria-describedby="caption-attachment-170" style="width: 400px"><a href="http://opentextbc.ca/geography/wp-content/uploads/sites/34/2014/06/britta_DMAT-04-e1406241893922.png" data-url="http://opentextbc.ca/geography/wp-content/uploads/sites/34/2014/06/britta_DMAT-04-e1406241893922.png"><img class="wp-image-170" alt="Figure 1: Daily Maximum Air Temperature relative to Vancouver" src="http://opentextbc.ca/geography/wp-content/uploads/sites/34/2014/06/britta_DMAT-04-e1406241893922.png" height="259" width="400" title="" /></a><div class="wp-caption-text" id="caption-attachment-170">Figure 7.2: Daily maximum air temperature relative to Vancouver</div></div> <p>Their analysis found large (~10 °C) temperature variability across the urban landscape, with hotspots located in areas with low vegetation cover, few water bodies and dense urban development far from the coast.&nbsp;The unique methodology incorporating remote sensing, citizens and weather stations&nbsp;helps identify not only such hotspots but also sheds light on the factors that influence local temperature variability. Combined with information on the location of vulnerable populations, this information can help health authorities guide emergency response during extreme heat events, and can inform prioritization of urban greening and cooling initiatives.</p> <h2>Attributions</h2> <ul><li><strong>Figure 7.2</strong> Daily maximum air temperature Hung Chak Ho &amp; Dr. Anders Knudby</li> </ul> <p>&nbsp;</p> 
	</div>


	</div>
<div class="chapter standard with-subsections" id="chapter-slug-8-4-summary" title="Summary">
	<div class="chapter-title-wrap">
		<p class="chapter-number">58</p>
		<h1 class="chapter-title">Summary</h1>
								</div>
	<div class="ugc chapter-ugc">
				
 <h1 id="chapter-172-section-1" class="section-header">Summary</h1> <p>In this chapter we learned to develop an understanding of the diversity of perspectives within the sub-discipline of health geography. Health geography is the study of health and ill health in relationship to place. It is concerned with&nbsp;the study of disease ecology and mapping, health service provisions, therapeutic landscapes, public health policy, health in the workplace, patient experience,&nbsp;experience of disease, experience of disability, geographies of care and responsibility and embodiments of mental (ill) health.</p> <p>To better understand&nbsp;the diversity of health geographies, it is important to think about how health is related to the spatial distribution of people and resources. This is done by bringing attention to the social determinants of health, epidemiology including&nbsp;mapping incidence of disease and a focus on access to health services. There are great opportunities to improve health surveillance intuitiveness through the use of&nbsp;GIS technologies.</p> <p>BC’s health system is based on ethical obligations of providing all people access to health services and ensuring that all BC citizens can realize their right to health. New approaches to providing this kind of access include mobile and telehealth options for people in rural communities. As we can see from the case study on the “golden hour,” the significant rural settlements in BC provide diverse challenges to accessing healthcare, especially in the case of acute trauma. Recently health geographers have been drawing on an intersectionality approach to understanding the complex interrelationships of health and place.</p> 

	</div>


	</div>
<div class="chapter standard with-subsections" id="chapter-slug-8-7-key-terms" title="Key Terms">
	<div class="chapter-title-wrap">
		<p class="chapter-number">59</p>
		<h1 class="chapter-title">Key Terms</h1>
								</div>
	<div class="ugc chapter-ugc">
				 <div class="bcc-box bcc-success"><h3>Key Terms</h3> <p><strong class="Bold">Geographic information system (GIS):&nbsp;</strong> A computer system designed to capture, store, manipulate, analyze, manage and present all types of geographical data. The acronym GIS is sometimes used for geographical information science or geospatial information studies to refer to the academic discipline or career of working with geographic information systems and is a large domain within the broader academic discipline of geoinformatics.</p> <p><strong class="Bold"><strong class="Bold">Intersectionality:</strong></strong>&nbsp;An approach that prioritizes&nbsp;the&nbsp;interrelationships of gender, class, race and ethnicity and other social divisions and seeks to understand how power relations structure these relationships.</p> <p><strong class="Bold">Mobile health (mHealth):&nbsp;</strong> The&nbsp;emerging field of&nbsp;the practice of medicine and public health supported by mobile devices. mHealth can be used for data collection for monitoring patients, informing diagnosis, organizing electronic medical records and for data dissemination by presenting health care resources, recommendations and education from doctors to patients using mobile devices.</p> <p><strong class="Bold">Public health surveillance:&nbsp;</strong>The collection, analysis, interpretation and dissemination of data on public health issues and its social and environmental determinants.</p> <p><strong class="Bold">Right to health:</strong> A concept, which Health Canada and all provincial health services ascribe to, that was set out in the United Nations Universal Declaration&nbsp;of Human Rights, incorporated in 1948.</p> <p><em class="Italic">&nbsp;</em><strong class="Bold">Social determinants of health:</strong> Those things that influence the levels of health experienced by populations.&nbsp; These determinants include income levels and social status, social support networks, education, employment/working conditions, social environments, physical environments, personal health practices and coping skills, healthy child development, gender and culture.</p> <p><strong>Spatial e</strong><strong class="Bold">pidemiology:&nbsp;</strong>The study of patterns, causes and effects of health and diseases among certain populations.</p> <p><strong class="Bold">Telehealth:</strong> Technical applications that allow physicians to provide care at a distance;&nbsp;a promising and unique means to provide health care and health education to dispersed populations.</p> </div> <p>&nbsp;</p> 
	</div>


	</div>
<div class="chapter standard with-subsections" id="chapter-slug-8-5-activities" title="Suggested Activities">
	<div class="chapter-title-wrap">
		<p class="chapter-number">60</p>
		<h1 class="chapter-title">Suggested Activities</h1>
								</div>
	<div class="ugc chapter-ugc">
				 <div class="bcc-box bcc-info"><h3>Suggested Activities</h3> <h2>Activity 1</h2> <p>Choose a current newspaper article that deals with a health issue in your home town or region.&nbsp;Write a three-page reflection on how this issue affects you and the&nbsp;community of which you&nbsp;are a part. Using a&nbsp;geographic perspective, highlight&nbsp;the role of place&nbsp;in this health issue.&nbsp;Share your reflection with a member of your community, and have a discussion about shared and divergent experiences with this issue.</p> <h2>Activity 2</h2> <p>Look at the map of BC in Case Study 1.&nbsp;Calculate how far you live&nbsp;from a trauma centre.&nbsp;Consider&nbsp;what other health care options are close to you for the provision of primary and traumatic care. With current resource levels of your community in mind, consider&nbsp;some possible steps that could be taken to increase your community’s access to care.&nbsp;Discuss with your family, a community group, or a local health care professional about the possibilities you have come up with.</p> <h2>Activity 3</h2> <p>Mental health is essential to people’s overall well-being. Everyone has mental health, and experiences it at different levels. Research and practise three ways of maintaining or improving your own mental health over a period of one week each. Keep a journal during this time reflecting on how you think each method of mental health maintenance is working. Which one works best for you? Consider the spatial implications of this. Questions could include, for example. Do you prefer to do 15 minutes of yoga or stretching in your home, or do you prefer to meet a close friend at a cafe? Is this an embodied or social form of mental health maintenance? Does where you practise each method of maintenance matter to the technique’s effectiveness?</p> </div> <p>&nbsp;</p> 
	</div>


	</div>
<div class="chapter standard with-subsections" id="chapter-slug-8-6-references-and-resources" title="References and Resources">
	<div class="chapter-title-wrap">
		<p class="chapter-number">61</p>
		<h1 class="chapter-title">References and Resources</h1>
								</div>
	<div class="ugc chapter-ugc">
				 <h2>References</h2> <p>Brown, T., McLafferty, S. &amp; Moon, G. 2010, “Introduction to Health and Medical Geography” in <em class="Italic">A Campanion to Health and Medical Geography</em>, eds. T. Brown, S. McLafferty &amp; G. Moon, Blackwell Publishing, West Sussex, pp. 1-12.</p> <p>Brown, T., McLafferty, S. &amp; Moon, G. 2004, <em class="Italic">A Companion to Health and Medical Geography, </em>Blackwell Publishing, West Sussex.</p> <p>Cinnamon, J. 2013, <em class="Italic">Geographic Injury Surveillance in Low-Resource Settings&nbsp; </em>, PhD edn, Simon Fraser University, Burnaby, BC.</p> <p>Kovats, R.S. &amp; Hajat, S. 2008, “Heat Stress and Public Health: A Critical Review”,&nbsp;<em class="Italic">Annual Review of Public Health,&nbsp;</em>vol. 29, pp. 41-55.</p> <p>RHS National Team. 2007.<em class="Italic">First Nations Regional Longitudinal Health Survey (RHS) 2002/2003: Results for adults, youth, and children living in First Nations communities</em>, Ottawa, ON, , Canada: Assembly of First Nations/First Nations Information Governance Committee.</p> <p>Schuurman, N., Fiedler, R.S., Grzybowski, S.C., Grund, D., 2006. Defining rational hospital catchments for non-urban areas based on travel-time. International Journal of Health Geographics 5, 43. doi:10.1186/1476-072X-5-43</p> <p>Schuurman, N., Randall, E. &amp; Berube, M. 2011, “A spatial decision support tool for estimating population catchments to aid rural and remote health service allocation planning”, <em class="Italic">Health Informatics Journal, </em>vol. 17, no. 4, pp. 277-293.</p> <p>Tomlinson, C., Chapman, L., Thornes, J. &amp; Baker, C. 2011, “Including the urban heat island in spatial heat health risk assessment strategies: a case study for Birmingham, UK”,&nbsp;<em class="Italic">International Journal of Health Geographics,&nbsp;</em>vol. 10, no. 1, pp. 42.</p> <h2>Resources</h2> <ul><li><a href="//www.bcstats.gov.bc.ca/Home.aspx" target="_blank" data-url="//www.bcstats.gov.bc.ca/Home.aspx">BC Statistics</a></li> <li><a href="http://www.healthlinkbc.ca/app/" target="_blank" data-url="http://www.healthlinkbc.ca/app/">BC Health Services Locator App </a></li> <li><a href="http://www.bcstats.gov.bc.ca/statisticsbysubject/geography/referencemaps/Health.aspx" target="_blank" data-url="http://www.bcstats.gov.bc.ca/statisticsbysubject/geography/referencemaps/Health.aspx">Interactive map displaying British Columbia’s health authority regions. </a></li> <li><a href="http://www.sfu.ca/iirp/" target="_blank" data-url="http://www.sfu.ca/iirp/">Institute for Internsectionality Research and Policy </a></li> <li><a href="http://www.vcn.bc.ca/rmdcmha/mhm.html" target="_blank" data-url="http://www.vcn.bc.ca/rmdcmha/mhm.html">Canadian Mental Health Association Ways of Maintaining Mental Health </a></li> <li><a href="//cbpp-pcpe.phac-aspc.gc.ca/public-health-topics/social-determinants-of-health/" target="_blank" data-url="//cbpp-pcpe.phac-aspc.gc.ca/public-health-topics/social-determinants-of-health/">Social Determinates of Health</a></li> </ul> <p>&nbsp;</p> 
	</div>


	</div>

</div>
<div class="part-wrapper" id="part-chapter-9-wrapper">
    <div class="part  " id="part-chapter-9">
	<div class="part-title-wrap">
		<p class="part-number">VIII</p>
		<h1 class="part-title">8. Physical Geography of British Columbia</h1>
	</div>
	<div class="ugc part-ugc">
		<div class="bcc-box bcc-highlight"><h3>Learning Objectives</h3> <ul><li>Explain the different sub-fields within physical geography.</li> <li>Explain the process that create different geologic&nbsp;and geomorphologic formations.</li> <li>Explain why specific ecosystems are found across the province.</li> <li>Explain basic climatological processes.</li> <li>Identify ways in which physical processes and human activities interact to create disasters.</li> </ul> </div> <p>&nbsp;</p>
	</div>
			
				
	</div>
<div class="chapter standard with-subsections" id="chapter-slug-9-2-introduction" title="Introduction">
	<div class="chapter-title-wrap">
		<p class="chapter-number">62</p>
		<h1 class="chapter-title">Introduction</h1>
								</div>
	<div class="ugc chapter-ugc">
				 <p>“Beautiful British Columbia”</p> <p>“The Best Place on Earth”</p> <p>“Super, Natural British Columbia”</p> <p>These official slogans for British Columbia (BC) have all been inspired by the rugged physical geography that characterizes&nbsp;the province. Physical geography is the study of processes and patterns of the natural environment that creates these characteristic&nbsp;landscapes. Physical geography includes a diverse range of natural phenomena, studying, for example, the atmosphere, hydrosphere, biosphere and geosphere.&nbsp;In this chapter we will introduce several physical geography&nbsp;sub-disciplines as they relate to BC’s&nbsp;different regions.</p> <h2>Overview of Regions in British Columbia</h2> <p>BC has an array of physical characteristics that&nbsp;make up its&nbsp;unique and diverse landscape. Because of the variety of&nbsp;physical and cultural regions, the province is sometimes called “a region of regions” (McGillivray, 2005).&nbsp;British Columbia is customarily divided into three main regions, the&nbsp;Interior, the&nbsp;Coast&nbsp;and the&nbsp;Lower Mainland. These are broken up by a loose and often overlapping system of cultural-geographic regions, often based on river basins but sometimes spanning them. Examples of the former are&nbsp;the&nbsp;Kootenays, the&nbsp;Okanagan, and the&nbsp;Chilcotin; examples of&nbsp;latter are&nbsp;the&nbsp;Lillooet country&nbsp;and&nbsp;the Cariboo. Important subareas of these include the&nbsp;Fraser Valley, part of the Lower Mainland, the&nbsp;Fraser Canyon&nbsp;(which overlaps with various regions) and the&nbsp;Robson Valley, which is the uppermost basin of the Fraser River southeast of Prince George. Vancouver Island is considered&nbsp;its own region, as are Haida Gwaii&nbsp;(Queen Charlotte Islands) and the&nbsp;Gulf Islands.</p> <div class="wp-caption aligncenter" id="attachment_178" aria-describedby="caption-attachment-178" style="width: 400px"><a href="http://opentextbc.ca/geography/wp-content/uploads/sites/34/2014/06/Aviv_mountainRange-03-e1406135622694.png" data-url="http://opentextbc.ca/geography/wp-content/uploads/sites/34/2014/06/Aviv_mountainRange-03-e1406135622694.png"><img class="wp-image-178" alt="Figure 1. Physiographic region of British Columbia" src="http://opentextbc.ca/geography/wp-content/uploads/sites/34/2014/06/Aviv_mountainRange-03-e1406135622694.png" height="397" width="400" title="" /></a><div class="wp-caption-text" id="caption-attachment-178">Figure 8.1 Physiographic region of British Columbia</div></div> <p>The spatial layout of major features of BC’s physical geography are illustrated in the map in Figure 8.1, which displays some of the major mountain ranges: the Coast Mountains, Columbia Mountains, and Rocky Mountains and plateaus such as the Thomson and Chilcotin Plateaus.</p> <p>BC’s&nbsp;complex landscape includes varied topography and&nbsp;physiography, many microclimates, and both&nbsp;terrestrial&nbsp;and&nbsp;marine&nbsp;ecosystems.&nbsp;Important characteristics of marine ecosystems include&nbsp;temperature, salinity, seabed configuration and water depth, whereas terrestrial ecosystems are heavily influenced by&nbsp;climatic zones that occur where specific soils, plant and animal communities, and aquatic systems interact with the geologic and geomorphic processes.&nbsp;Marine and terrestrial ecosystems interact to create a unique and vibrant coastal zone.</p> <p>There are several different <a href="http://cfcg.forestry.ubc.ca/resources/cataloguing-in-situ-genetic-resources/about-bec-and-bgc-units/" target="_blank" data-url="http://cfcg.forestry.ubc.ca/resources/cataloguing-in-situ-genetic-resources/about-bec-and-bgc-units/"><strong>biogeoclimatic&nbsp;zones</strong></a><span class="footnote"><span class="footnote-indirect" data-fnref="181-1"></span></span> that include diverse&nbsp;vegetation reflecting climatic and physiographic differences. These zones include:</p> <ul><li>Alpine tundra</li> <li>Spruce—Willow—Birch</li> <li>Boreal white and black spruce</li> <li>Sub-boreal pine—spruce</li> <li>Sub-boreal spruce</li> <li>Mountain hemlock</li> <li>Engelmann spruce—Subalpine fir</li> <li>Montane spruce</li> <li>Bunchgrass</li> <li>Ponderosa pine</li> <li>Interior Douglas-fir</li> <li>Coastal Douglas-fir</li> <li>Interior cedar—hemlock</li> <li>Coastal western hemlock</li> </ul> <p>These biogeoclimatic zones are heavily influenced by the mountains landscape of BC, which has&nbsp;some of the highest mountains in North America. These ranges create orthographic effects, rain shadows and&nbsp; dramatic temperature changes over short horizontal differences.</p> <p>&nbsp;</p> <table><caption style="font-weight: bold;"><b>Table 8.1 British Columbia’s principal mountains (by range &amp; height)<br /> </b></caption> <tbody><tr><th>Mountain (Range)</th> <th>Height (m)</th> </tr> <tr><td colspan="2"><strong>Saint Elias Mountains</strong></td> </tr> <tr><td>Fairweather Mountain&nbsp;(highest point on Alaska–BC boundary)</td> <td>4,663</td> </tr> <tr><td>Mount Quincy Adams&nbsp;(on Alaska–BC boundary)</td> <td>4,133</td> </tr> <tr><td>Mount Root&nbsp;(on Alaska–BC boundary)</td> <td>3,901</td> </tr> <tr><td colspan="2"><strong>Coast Mountains</strong></td> </tr> <tr><td>Mount Waddington</td> <td>4,016</td> </tr> <tr><td>Mount Tiedemann</td> <td>3,848</td> </tr> <tr><td>Combatant Mountain</td> <td>3,756</td> </tr> <tr><td colspan="2"><a title="Asperity Mountain" style="color: #0b0080;" href="http://en.wikipedia.org/wiki/Asperity_Mountain" data-url="http://en.wikipedia.org/wiki/Asperity_Mountain"></a><strong>Rocky Mountains</strong></td> </tr> <tr><td><a title="Serra Peaks (page does not exist)" class="new" style="color: #a55858;" href="http://en.wikipedia.org/w/index.php?title=Serra_Peaks&amp;action=edit&amp;redlink=1" data-url="http://en.wikipedia.org/w/index.php?title=Serra_Peaks&amp;action=edit&amp;redlink=1"></a>Mount Robson</td> <td>3,954</td> </tr> <tr><td><a title="Monarch Mountain" style="color: #0b0080;" href="http://en.wikipedia.org/wiki/Monarch_Mountain" data-url="http://en.wikipedia.org/wiki/Monarch_Mountain"></a>Mount Columbia&nbsp;(on Alberta–BC boundary)</td> <td>3,747</td> </tr> <tr><td>Mount Clemenceau</td> <td>3,642</td> </tr> <tr><td colspan="2"><strong>Selkirk Mountains</strong></td> </tr> <tr><td><a title="Mount Robson" style="color: #0b0080;" href="http://en.wikipedia.org/wiki/Mount_Robson" data-url="http://en.wikipedia.org/wiki/Mount_Robson"></a>Mount Sir Sandford</td> <td>3,522</td> </tr> <tr><td colspan="2"><a title="Mount Columbia (Canada)" style="color: #0b0080;" href="http://en.wikipedia.org/wiki/Mount_Columbia_(Canada)" data-url="http://en.wikipedia.org/wiki/Mount_Columbia_(Canada)"></a><strong>Cariboo Mountains</strong></td> </tr> <tr><td><a title="Mount Clemenceau" style="color: #0b0080;" href="http://en.wikipedia.org/wiki/Mount_Clemenceau" data-url="http://en.wikipedia.org/wiki/Mount_Clemenceau"></a>Mount Sir Wilfrid Laurier</td> <td>3,520</td> </tr> <tr><td colspan="2"><strong>Purcell Mountains</strong></td> </tr> <tr><td>Mount Farnham</td> <td>3,481</td> </tr> <tr><td colspan="2"><strong>Monashee Mountains</strong></td> </tr> <tr><td>Mount Monashee</td> <td>3,274</td> </tr> </tbody> </table> <p>While the high mountains, especially the Rocky Mountains&nbsp;and Coast Mountains, are known for their cold temperatures, the coastal environment is warm and&nbsp;moist. This warmth and moisture is largely due to the North Pacific Current that runs west to east across the Pacific (stemming from the collision of the Oshiyo Current&nbsp;and Kuroshio Current). Warm ocean air drops most of its moisture as rain and snow as it rises over&nbsp;mountain ranges. This makes&nbsp;BC home to Canada’s wettest climates and hence its most productive forests. The richness of natural resources available in BC are a result of its complex environment and varied ecoregions.</p> <div class="wp-caption aligncenter" id="attachment_179" aria-describedby="caption-attachment-179" style="width: 400px"><a href="http://opentextbc.ca/geography/wp-content/uploads/sites/34/2014/06/siobhan_landcover-06-e1406136682970.png" data-url="http://opentextbc.ca/geography/wp-content/uploads/sites/34/2014/06/siobhan_landcover-06-e1406136682970.png"><img class="wp-image-179" alt="Figure 2. Land cover types in BC as percentage of total land area. This graphic highlights the prevalence and hence importance of forests to BC landscapes" src="http://opentextbc.ca/geography/wp-content/uploads/sites/34/2014/06/siobhan_landcover-06-e1406136682970.png" height="249" width="400" title="" /></a><div class="wp-caption-text" id="caption-attachment-179">Figure 8.2 Land cover types in BC as percentage of total land area. This graphic highlights the prevalence and hence importance of forests to BC landscapes</div></div> <p>East of the Coast&nbsp;Mountains are the interior plateaus and lower mountains.&nbsp;As the Pacific air&nbsp;flows through the&nbsp;Interior it is&nbsp;influenced by continental air masses. This results in a more continental climate&nbsp;with greater extremes of temperature and precipitation. The region in BC’s southern interior east of the Coast&nbsp;Mountains&nbsp;is the driest&nbsp;while&nbsp;the northeast of BC with its elevated rolling plains (a landscape feature unique in&nbsp;BC)&nbsp;has a cold northern continental climate.</p> <div class="wp-caption aligncenter" id="attachment_180" aria-describedby="caption-attachment-180" style="width: 400px"><a href="http://opentextbc.ca/geography/wp-content/uploads/sites/34/2014/06/britta_cloud_rain-01-e1406136750785.png" data-url="http://opentextbc.ca/geography/wp-content/uploads/sites/34/2014/06/britta_cloud_rain-01-e1406136750785.png"><img class="wp-image-180" alt="Figure 3. The Rain Shadow Effect on Vancouver. This graphic shows how the presence of Vancouver Island on the Western side and the Coast Mountains creates a rain shadow effect on the weather in the Greater Vancouver area." src="http://opentextbc.ca/geography/wp-content/uploads/sites/34/2014/06/britta_cloud_rain-01-e1406136750785.png" height="113" width="400" title="" /></a><div class="wp-caption-text" id="caption-attachment-180">Figure 8.3 The rain shadow effect on Vancouver. This graphic shows how the presence of Vancouver Island on the Western side and the Coast Mountains creates a rain shadow effect on the weather in the Greater Vancouver area.</div></div> <p>There are 47 official <a href="http://a100.gov.bc.ca/pub/eswp/res/EcosectionMap.pdf" target="_blank" data-url="http://a100.gov.bc.ca/pub/eswp/res/EcosectionMap.pdf"><strong>ecoregions</strong> </a>in BC<span class="footnote"><span class="footnote-indirect" data-fnref="181-2"></span></span> as defined by the government of BC. An <strong>ecoregion</strong> is an area with major physiographic and minor macroclimatic or oceanographic variation.What distinguishes BC from other parts of Canada and North America is the presence of&nbsp;small-scale ecological relationships given its great ecological complexity (Meidinger&nbsp;&amp;&nbsp;Pojar,&nbsp;1991). In BC, marine and oceanic environments are part of the regional classification of the province given their important climatic influence. There is another level of ecological complexity that occurs within mountainous regions, that of topo-climatic zonation, given the elevation of the landscape which includes mountains and plains.</p> <h2>Attributions</h2> <ul><li><strong>Figure 8.1</strong> Physiographic region of British Columbia by Hilda Anggraeni from Michael Church, June M. Ryder, 2010. Compendium of forest hydrology and geomorphology in British Columbia. Government of British Columbia. <a href="http://www.for.gov.bc.ca/hfd/pubs/docs/Lmh/Lmh66" data-url="http://www.for.gov.bc.ca/hfd/pubs/docs/Lmh/Lmh66">http://www.for.gov.bc.ca/hfd/pubs/docs/Lmh/Lmh66</a></li> <li><strong>Figure 8.2</strong> Land cover types in BC as percentage of total land area by Hilda Anggraeni adapted&nbsp;from <a href="http://www.biodiversitybc.org/EN/main/downloads/tnp-2.html" target="_blank" data-url="http://www.biodiversitybc.org/EN/main/downloads/tnp-2.html">http://www.biodiversitybc.org/EN/main/downloads/tnp-2.html</a></li> <li><strong>Figure 8.3</strong> The rain shadow effect on Vancouver by Hilda Anggraeni.</li> </ul> 
	</div>
			
				
				<div class="footnotes"><div id='181-1'>
<p>see&nbsp;<a href="http://cfcg.forestry.ubc.ca/resources/cataloguing-in-situ-genetic-resources/about-bec-and-bgc-units/" target="_blank" data-url="http://cfcg.forestry.ubc.ca/resources/cataloguing-in-situ-genetic-resources/about-bec-and-bgc-units/">http://cfcg.forestry.ubc.ca/resources/cataloguing-in-situ-genetic-resources/about-bec-and-bgc-units/</a> for more information on BC biogeoclimatic zones</p>

</div><div id='181-2'>
<p>See&nbsp;<a href="http://a100.gov.bc.ca/pub/eswp/res/EcosectionMap.pdf" target="_blank" data-url="http://a100.gov.bc.ca/pub/eswp/res/EcosectionMap.pdf">http://a100.gov.bc.ca/pub/eswp/res/EcosectionMap.pdf</a>&nbsp; for a detailed map of the ecoprovinces, ecoregions&nbsp;and ecosections of BC.</p>

</div></div>
	</div>
<div class="chapter standard with-subsections" id="chapter-slug-9-3-climate-and-environment-bc" title="Climate Change and Environment in BC">
	<div class="chapter-title-wrap">
		<p class="chapter-number">63</p>
		<h1 class="chapter-title">Climate Change and Environment in BC</h1>
								</div>
	<div class="ugc chapter-ugc">
				 <p><strong>Climate change</strong>&nbsp;is a significant and lasting reality in our world today. It&nbsp;refers to change in&nbsp;weather patterns&nbsp;over time, and it&nbsp;includes a variation in the average weather patterns&nbsp;and/or more extreme weather patterns such as increased precipitation or drought.&nbsp;Natural factors such as biotic&nbsp;processes, variations in&nbsp;solar radiation&nbsp;received by Earth,&nbsp;plate tectonics and&nbsp;volcanic eruptions can have an influence on climate change, but by far the most significant is the impact of human activities (Dessai&nbsp;et al., 2004).</p> <div class="wp-caption aligncenter" id="attachment_182" aria-describedby="caption-attachment-182" style="width: 400px"><a href="http://opentextbc.ca/geography/wp-content/uploads/sites/34/2014/06/800px-Diagram_showing_ten_indicators_of_global_warming.png" data-url="http://opentextbc.ca/geography/wp-content/uploads/sites/34/2014/06/800px-Diagram_showing_ten_indicators_of_global_warming.png"><img class="wp-image-182" alt="Figure 1. Ten Indicators of a Warming World" src="http://opentextbc.ca/geography/wp-content/uploads/sites/34/2014/06/800px-Diagram_showing_ten_indicators_of_global_warming.png" height="212" width="400" srcset="https://opentextbc.ca/geography/wp-content/uploads/sites/34/2014/06/800px-Diagram_showing_ten_indicators_of_global_warming.png 800w, https://opentextbc.ca/geography/wp-content/uploads/sites/34/2014/06/800px-Diagram_showing_ten_indicators_of_global_warming-300x159.png 300w, https://opentextbc.ca/geography/wp-content/uploads/sites/34/2014/06/800px-Diagram_showing_ten_indicators_of_global_warming-65x34.png 65w, https://opentextbc.ca/geography/wp-content/uploads/sites/34/2014/06/800px-Diagram_showing_ten_indicators_of_global_warming-225x119.png 225w, https://opentextbc.ca/geography/wp-content/uploads/sites/34/2014/06/800px-Diagram_showing_ten_indicators_of_global_warming-350x185.png 350w" sizes="auto, (max-width: 400px) 100vw, 400px" title="" /></a><div class="wp-caption-text" id="caption-attachment-182">Figure 8.4 Ten indicators of a warming world</div></div> <p>Think about the richness of BC’s natural resources such as&nbsp;clean water and air, timber, game, fish, scenery, flood-control natural barriers, metals, minerals and natural gas; many of these natural goods and services are impossible to replace. How does climate change impact the province?</p> <p>In many parts of BC, snowpacks are projected to continue to decrease. Less snow means that there is less snowmelt in the spring and less runoff in summer. These declining amounts of water affect&nbsp;many industries,&nbsp;such as&nbsp;hydropower, agriculture and&nbsp;fisheries.&nbsp;While precipitation trends from normal have increased (see Figure 2),&nbsp;the increase in negative variation in spring indicates risk of variation events rather than simply the risk of&nbsp;less evapotranspiration and precipitation over time.&nbsp;Where glaciers contribute to the volume of water flow, long-term loss of glacier mass will further increase water shortages.</p> <p>We&nbsp;already have examples of the effect of&nbsp;less snow with the&nbsp;seasonal droughts of 2003 and 2009, which show&nbsp;the vulnerability of community and irrigation water supplies and point to&nbsp;what we may face&nbsp;in the future. These seasonal droughts, along with high interface forests, contributed to the Okanagan&nbsp;forest fire of 2003, and&nbsp;increased temperatures have contributed&nbsp;to the epidemic of the mountain pine beetle.</p> <div class="wp-caption aligncenter" id="attachment_183" aria-describedby="caption-attachment-183" style="width: 400px"><a href="http://opentextbc.ca/geography/wp-content/uploads/sites/34/2014/06/ct019_en.gif" data-url="http://opentextbc.ca/geography/wp-content/uploads/sites/34/2014/06/ct019_en.gif"><img class="wp-image-183" alt="Figure 2. Seasonal mean precipitation percentage departure from 1961 to 1990 normal and linear trend for Canada, 1948 to 2009" src="http://opentextbc.ca/geography/wp-content/uploads/sites/34/2014/06/ct019_en.gif" height="413" width="400" title="" /></a><div class="wp-caption-text" id="caption-attachment-183">Figure 8.5. Seasonal mean precipitation percentage departure from 1961 to 1990 normal and linear trend for Canada, 1948 to 2009</div></div> <p>Each person can make a difference in a small way, but as a province some of the actions needed include:</p> <ul><li>Reducing&nbsp;emissions by using cars less,&nbsp;buying food locally, using&nbsp;eco-friendly products where possible, buying energy-efficient appliances, getting energy from renewable sources, and finally turning down heat sources in winter by just two degrees.</li> <li>Ensuring that communities and businesses are more resilient and able to deal with extreme weather events through preparedness. An example in BC is the creation of &nbsp;FireSmart communities, which require&nbsp;planners and architects to&nbsp;design new buildings and infrastructure with the changing climate in mind.</li> </ul> <h2>Attributions</h2> <ul><li><strong>Figure 8.4</strong> Ten indicators of a warming world. By&nbsp;US National Oceanic and Atmospheric Administration: National Climatic Data Center (<a href="http://commons.wikimedia.org/wiki/File:Diagram_showing_ten_indicators_of_global_warming.png" target="_blank" data-url="http://commons.wikimedia.org/wiki/File:Diagram_showing_ten_indicators_of_global_warming.png">http://commons.wikimedia.org/wiki/File:Diagram_showing_ten_indicators_of_global_warming.png</a>) is in the public domain</li> <li><strong>Figure 8.5</strong> Seasonal mean precipitation percentage departure from&nbsp;1961&nbsp;to&nbsp;1990&nbsp;normal and linear trend for Canada,&nbsp;1948&nbsp;to&nbsp;2009. By&nbsp;Environment Canada,&nbsp;2010,&nbsp;<em class="Italic">Climate Trends and Variations Bulletin (CTVB)&nbsp;</em><a href="http://www.ec.gc.ca/adsc-cmda/default.asp?lang=En&amp;n=F3D25729-1" target="_blank" data-url="http://www.ec.gc.ca/adsc-cmda/default.asp?lang=En&amp;n=F3D25729-1">www.ec.gc.ca/adsc-cmda/default.asp?lang=En&amp;n=F3D25729-1</a></li> </ul> 
	</div>


	</div>
<div class="chapter standard with-subsections" id="chapter-slug-9-4-geology" title="Geology">
	<div class="chapter-title-wrap">
		<p class="chapter-number">64</p>
		<h1 class="chapter-title">Geology</h1>
								</div>
	<div class="ugc chapter-ugc">
				 <p>The term <strong>geology</strong> comes from the Greek words “ge” (“earth”) and “logia,” meaning the study of and&nbsp;discourse involving the&nbsp;solid Earth, including the rocks of which it is composed, and the processes by which those rocks&nbsp;change. Geology can also refer generally to the study of the solid features of any celestial body (such as the Moon or Mars).&nbsp;Geology gives insight into the history of the Earth by providing the primary evidence for plate tectonics, the evolutionary history of <a href="#bob" data-url="https://opentextbc.ca/geography/chapter/9-4-geology/#bob">life and past climates</a>.</p> <p><a id="bob" data-url=""></a>In British Columbia, geology is&nbsp;important for economic development associated with mineral and hydrocarbon (oil and natural gas) exploration and&nbsp;harvest. Geology is valuable to the public for predicting and understanding natural hazards, the remediation of environmental problems, and for providing insights into past climate change. Geology also plays a role in geotechnical engineering and is a major academic discipline.</p> <p>Formation of the&nbsp;mountains is a dramatic evolving process associated with geology and&nbsp;<strong class="Bold">geomorphology</strong>. Geomorphology is the study of the process that creates and transforms the surface of the Earth.&nbsp;Geomorphology seeks to understand landform history and dynamics, and predicts changes through a combination of field observation, physical experiment and numerical modelling (geomorphometry).</p> <p>The Earth is stratified, meaning that it has several layers. In the very centre lies the solid core, which&nbsp;is surrounded by a liquid core. Next is the mantle, asthenosphere, the lithosphere and finally the crust at the top.</p> <div class="wp-caption aligncenter" id="attachment_822" aria-describedby="caption-attachment-822" style="width: 400px"><a href="http://opentextbc.ca/geography/wp-content/uploads/sites/34/2014/07/crust-e1406316183408.png" data-url="http://opentextbc.ca/geography/wp-content/uploads/sites/34/2014/07/crust-e1406316183408.png"><img class="wp-image-822" alt="Firgure 1. Earth cutaway from core to crust, the lithosphere comprising the crust and lithospheric mantle (detail not to scale)" src="http://opentextbc.ca/geography/wp-content/uploads/sites/34/2014/07/crust-e1406316183408.png" height="282" width="400" title="" /></a><div class="wp-caption-text" id="caption-attachment-822">Figure 8.6 Earth cutaway from core to crust, the lithosphere comprising the crust and lithospheric mantle (detail not to scale)</div></div> <p>Each of these layers is made up of different mineral composition.</p> <p>Several types of rocks are found throughout the crust. Plate tectonics theory suggests that the Earth’s lithosphere is made up of seven large plates and several small ones. Rising convection plumes from the asthenosphere can force the plates to move. The plate edges are&nbsp;where most volcanic and earthquake activity take place. These activities move minerals and materials. Below is a map of the geologic era rock found in British Columbia.</p> <div class="wp-caption aligncenter" id="attachment_186" aria-describedby="caption-attachment-186" style="width: 400px"><a href="http://opentextbc.ca/geography/wp-content/uploads/sites/34/2014/06/britta_geolog_rock-03-e1406241833624.png" data-url="http://opentextbc.ca/geography/wp-content/uploads/sites/34/2014/06/britta_geolog_rock-03-e1406241833624.png"><img class="wp-image-186" alt="Figure 2. Geologic era of rock in British Columbia" src="http://opentextbc.ca/geography/wp-content/uploads/sites/34/2014/06/britta_geolog_rock-03-e1406241833624.png" height="265" width="400" title="" /></a><div class="wp-caption-text" id="caption-attachment-186">Figure 8.7. Geologic era of rock in British Columbia</div></div> <p>Plate tectonics is a significant field of study in BC since as there are so many fault lines (see Figure 8.8). Faults are where plates meet. When two plates jam together, the edges often fracture and collapse&nbsp;forming mountain ranges in a process called&nbsp;<strong class="Bold">orogeny</strong>.</p> <p>Another significant process to the formation of the rugged terrain found in BC is&nbsp;<strong class="Bold">isostasy,</strong>&nbsp;which is the process of the surface of the Earth loading and unloading. For example, the Rocky Mountains are made up of sedimentary rock which erodes relatively quickly.&nbsp; A process is known as<strong class="Bold">&nbsp;isostatic rebound</strong>, occurs which is the gradual rising of land elevations as it springs back after thousands of years of being crushed under the weight of continental glaciers.</p> <p>A complex system of fault lines can be found in British Columbia. In Figure 8.8,&nbsp;all known and inferred fault lines are present with&nbsp;the major fault lines&nbsp;in bold. These fault lines&nbsp;have been designated as “major” because of their length and their&nbsp;potential impact on human populations.&nbsp;The five fault lines featured in the figure&nbsp;are the Pinchi Fault in Central BC, the Fraser River Fault, the Columbia River Fault, the Rocky Mountain Fault and the San Juan Fault.</p> <p>&nbsp;</p> <div class="wp-caption aligncenter" id="attachment_187" aria-describedby="caption-attachment-187" style="width: 400px"><a href="http://opentextbc.ca/geography/wp-content/uploads/sites/34/2014/06/Britta_faultLines-01-e1406241817718.png" data-url="http://opentextbc.ca/geography/wp-content/uploads/sites/34/2014/06/Britta_faultLines-01-e1406241817718.png"><img class="wp-image-187" alt="Figure 3. British Columbia fault lines" src="http://opentextbc.ca/geography/wp-content/uploads/sites/34/2014/06/Britta_faultLines-01-e1406241817718.png" height="341" width="400" title="" /></a><div class="wp-caption-text" id="caption-attachment-187">Figure 8.8 British Columbia fault lines</div></div> <h2>Subduction</h2> <p><span class="pullquote-right">View a short video on subduction from the National Oceanographic and Atmospheric Administration at <a href="http://oceanexplorer.noaa.gov/edu/learning/player/lesson04.html" target="_blank" data-url="http://oceanexplorer.noaa.gov/edu/learning/player/lesson04.html">http://oceanexplorer.noaa.gov/edu/learning/player/lesson04.htm</a></span>While the San Juan Fault&nbsp;may look small on this map, an earthquake along this fault could have significant ramifications for the residents of southwestern BC.&nbsp;The San Juan Fault separates the oceanic Juan de Fuca Plate from the heavier and denser&nbsp;North American continental plate through <strong>subduction</strong>. <strong class="Bold">Subduction</strong> occurs when two plates collide and one is denser or heavier than the other, forcing the heavier one downward and under the other.&nbsp; Subduction can cause trenches in the ocean floor, which will warm and may cause the plate to melt, producing magma and flow into volcanic eruptions at the surface resulting in new rocks. These processes also move and transfer minerals and sediment from different layers of the Earth and deposit them in different places.</p> <p>Understanding how and where these pieces of sediment have come from and moved to help geologists unlock the mystery of&nbsp; the formation of surface terrain. For example, the&nbsp;Pinchi Fault is a significant fault system in central BC that&nbsp;extends 450 kilometres and separates dominating oceanic sedimentary bedrock in the region from the volcanic rocks&nbsp; in the eastern portion of the province (Plouffe, 2001). The&nbsp; resulting&nbsp;terrain consists of&nbsp;a plate pushing up instead of down against the edge of the neighbouring plate, which&nbsp;can cause significant earthquakes.</p> <h2>Attributions</h2> <ul><li><strong>Figure 8.6</strong> <a href="https://commons.wikimedia.org/wiki/File:Earth-cutaway-schematic-english.svg#mediaviewer/File:Earth-cutaway-schematic-english.svg" data-url="https://commons.wikimedia.org/wiki/File:Earth-cutaway-schematic-english.svg#mediaviewer/File:Earth-cutaway-schematic-english.svg">Earth-cutaway-schematic-english</a> Licensed under Public domain via <a href="//commons.wikimedia.org/wiki/" data-url="//commons.wikimedia.org/wiki/">Wikimedia Commons</a>.</li> <li><strong>Figure 8.7</strong> Geologic era of rock in British Columbia. Created by&nbsp;Hilda Anggraeni with data provided by Digital Geology Maps BC Ministry of Geology and Mines &nbsp;(<a href="http://www.empr.gov.bc.ca/Mining/Geoscience/PublicationsCatalogue/DigitalGeologyMaps/Pages/default.aspx" target="_blank" data-url="http://www.empr.gov.bc.ca/Mining/Geoscience/PublicationsCatalogue/DigitalGeologyMaps/Pages/default.aspx">http://www.empr.gov.bc.ca/Mining/Geoscience/PublicationsCatalogue/DigitalGeologyMaps/Pages/default.aspx</a>)</li> <li><strong>Figure 8.8</strong> British Columbia fault lines. Created by&nbsp;Hilda Anggraeni with data provided by Digital Geology Maps BC Ministry of Geology and Mines &nbsp;(<a href="http://www.empr.gov.bc.ca/Mining/Geoscience/PublicationsCatalogue/DigitalGeologyMaps/Pages/default.aspx" target="_blank" data-url="http://www.empr.gov.bc.ca/Mining/Geoscience/PublicationsCatalogue/DigitalGeologyMaps/Pages/default.aspx">http://www.empr.gov.bc.ca/Mining/Geoscience/PublicationsCatalogue/DigitalGeologyMaps/Pages/default.aspx</a>)</li> </ul> 
	</div>


	</div>
<div class="chapter standard with-subsections" id="chapter-slug-9-5-hazards" title="Hazards">
	<div class="chapter-title-wrap">
		<p class="chapter-number">65</p>
		<h1 class="chapter-title">Hazards</h1>
								</div>
	<div class="ugc chapter-ugc">
				 <p>The term <strong>natural hazards</strong> refers to any natural process that poses&nbsp;a potential threat to human life and property. Natural hazards tend to be repetitive events and are predictable. Some of the most devastating natural hazards include:</p> <ul><li>Earthquakes</li> <li>Volcanic eruptions</li> <li>Landslides</li> <li>Hurricanes</li> <li>Heat waves</li> <li>Tsunamis</li> <li>Wildfires</li> <li>Floods</li> <li>Droughts</li> </ul> <p>Earthquakes are perhaps the most dangerous of all natural hazards. During the 20th century more than a million lives were lost worldwide due to earthquakes. Each year more than 50 earthquakes occur that are strong enough to be felt in Canada. As discussed in the section on geology, BC is subject to frequent and violent earthquake activity because of&nbsp;the presence of an active boundary between tectonic plates.</p> <p>Periodic disturbances from hazards such as earthquakes, volcanic eruptions and flooding adversely affect:</p> <ul><li>Fertile soil</li> <li>Available water</li> <li>Diverse land and life</li> <li>Aesthetic beauty</li> </ul> <p>Fortunately, some hazards can be predicted and much can be learned from past events. With appropriate data collection and analysis, scientists can use statistical models to identify patterns and evaluate the frequency of a particular event. For example, certain soil conditions may lead to the likelihood of landslides. Learning more about natural hazards and communicating this knowledge to the public can encourage hazard mitigation measures that may&nbsp;reduce the damage that could potentially be incurred by disaster.&nbsp;The predictability of hazards allows events to be&nbsp;forecasted and officials to implement warning systems, such as the tsunami&nbsp;warning system that is in place&nbsp;along the Pacific coast.</p> <p>Natural hazards and their effects are closely linked to our&nbsp;environment, and one hazardous event&nbsp;can set off another. For example, an area with weak soils may be at risk of a landslide.&nbsp;A&nbsp;volcanic eruption can cause a landslide, and a&nbsp;subduction earthquake may cause a tsunami. Hazards often&nbsp;influence or disrupt ecosystems:&nbsp;for example, human-caused landslides in the past have cut off Hell’s Gate in the Fraser River leading to massive declines of the Fraser River sockeye population and impacts across the ecosystem.</p> <p>Risk from hazards can be estimated and adverse effects of hazards can be minimized through efforts such as <a href="http://www.embc.gov.bc.ca/index.htm" target="_blank" data-url="http://www.embc.gov.bc.ca/index.htm">Emergency Management BC</a>.<span class="footnote"><span class="footnote-indirect" data-fnref="189-1"></span></span> Communities that have a more active versus reactive response to hazards stand a better chances of being prepared when adverse events occur. Emergency preparedness teams and communities need to consider land use planning, hazard-resistant construction and the protection of ecosystems.</p> <p>The <a href="http://cdd.publicsafety.gc.ca/srchpg-eng.aspx" target="_blank" data-url="http://cdd.publicsafety.gc.ca/srchpg-eng.aspx">Canadian Disaster Database</a><span class="footnote"><span class="footnote-indirect" data-fnref="189-2"></span></span> is an interactive geospatial map that allows users to define their search of the disaster database by using a spatially defined area.</p> 
	</div>
			
				
				<div class="footnotes"><div id='189-1'>
<p>Emergency Management BC <a href="http://www.embc.gov.bc.ca/index.htm" target="_blank" data-url="http://www.embc.gov.bc.ca/index.htm">http://www.embc.gov.bc.ca/index.htm</a></p>

</div><div id='189-2'>
<p>Canadian Disaster Database<a href="//cdd.publicsafety.gc.ca/srchpg-eng.aspx" target="_blank" data-url="//cdd.publicsafety.gc.ca/srchpg-eng.aspx"> http://cdd.publicsafety.gc.ca/srchpg-eng.aspx</a></p>

</div></div>
	</div>
<div class="chapter standard with-subsections" id="chapter-slug-9-6-case-studies" title="Case Study 1: 1965 Hope Slide">
	<div class="chapter-title-wrap">
		<p class="chapter-number">66</p>
		<h1 class="chapter-title">Case Study 1: 1965 Hope Slide</h1>
								</div>
	<div class="ugc chapter-ugc">
				 <p>A <strong>landslide</strong> is the general term that describes the movement of&nbsp;rock, soil and other debris down a slope as a result of&nbsp;gravitational pull.&nbsp;Landslides are most likely to&nbsp;occur&nbsp;in mountainous regions but may occur on any slope.</p> <p>There are many factors that can contribute to the likelihood of a landslide, including&nbsp;geological causes such as weak or sensitive materials, morphological causes such as tectonic plate shifting or soil erosion, and human causes&nbsp;such as deforestation, water leakage, imposed vibrations or excavation.</p> <p>One of the most tragic landslides in Canadian history was the Hope Slide, which occurred at 7 a.m. on January 9, 1965,&nbsp;in the Nicolum Valley in the Cascade Mountains near Hope, British Columbia.<span class="footnote"><span class="footnote-indirect" data-fnref="194-1"></span></span></p> <p></p> <div class="textbox interactive-content interactive-content--iframe"><span class="interactive-content__icon"></span> <p>One or more interactive elements has been excluded from this version of the text. You can view them online here: <a href="https://opentextbc.ca/geography/?p=194" title="Case Study 1: 1965 Hope Slide" data-url="https://opentextbc.ca/geography/?p=194">https://opentextbc.ca/geography/?p=194</a> </p> </div> <p>&nbsp;</p> <div class="wp-caption aligncenter" id="attachment_190" aria-describedby="caption-attachment-190" style="width: 400px"><a href="http://opentextbc.ca/geography/wp-content/uploads/sites/34/2014/06/Screen_Shot_2014-06-12_at_8.59_.58_AM_-e1406241804343.png" data-url="http://opentextbc.ca/geography/wp-content/uploads/sites/34/2014/06/Screen_Shot_2014-06-12_at_8.59_.58_AM_-e1406241804343.png"><img class="wp-image-190" alt="Figure 1. Hope Slide Location" src="http://opentextbc.ca/geography/wp-content/uploads/sites/34/2014/06/Screen_Shot_2014-06-12_at_8.59_.58_AM_-e1406241804343.png" height="327" width="400" srcset="https://opentextbc.ca/geography/wp-content/uploads/sites/34/2014/06/Screen_Shot_2014-06-12_at_8.59_.58_AM_-e1406241804343.png 661w, https://opentextbc.ca/geography/wp-content/uploads/sites/34/2014/06/Screen_Shot_2014-06-12_at_8.59_.58_AM_-e1406241804343-300x245.png 300w, https://opentextbc.ca/geography/wp-content/uploads/sites/34/2014/06/Screen_Shot_2014-06-12_at_8.59_.58_AM_-e1406241804343-65x53.png 65w, https://opentextbc.ca/geography/wp-content/uploads/sites/34/2014/06/Screen_Shot_2014-06-12_at_8.59_.58_AM_-e1406241804343-225x184.png 225w, https://opentextbc.ca/geography/wp-content/uploads/sites/34/2014/06/Screen_Shot_2014-06-12_at_8.59_.58_AM_-e1406241804343-350x286.png 350w" sizes="auto, (max-width: 400px) 100vw, 400px" title="" /></a><div class="wp-caption-text" id="caption-attachment-190">Figure 8.9 Location of Hope Slide</div></div> <p>Shortly before&nbsp;the landslide, a small avalanche (different from a landslide in that an avalanche is made up of moving snow, not rock or sediment) occurred on a stretch of the Hope-Princeton Highway below Johnson Peak, approximately 150 kilometres from&nbsp;Vancouver, which&nbsp;forced four people to stop their vehicles. While they were waiting for the clearing crews, a second landslide occurred.</p> <p>The landslide buried the vehicles and the occupants, and all four people died&nbsp;under 47 million cubic metres of pulverized rock, mud and debris that fell down&nbsp;the 2,000-metre mountainside. This mass of debris completely displaced the water and mud in Outram Lake with incredible force, throwing it against the opposite side of the valley, wiping all vegetation and trees down to the bare rock, then splashing it&nbsp;back up the original (now bare) slope before settling.</p> <p>Recent research shows that these impacts against the opposite valley sides produced the seismic signatures interpreted as earthquakes.</p> <div class="wp-caption aligncenter" id="attachment_191" aria-describedby="caption-attachment-191" style="width: 400px"><a href="http://opentextbc.ca/geography/wp-content/uploads/sites/34/2014/06/Hope_slide-e1406241761321.jpg" data-url="http://opentextbc.ca/geography/wp-content/uploads/sites/34/2014/06/Hope_slide-e1406241761321.jpg"><img class="wp-image-191" alt="Figure 2. Hope Slide, mountain scare is clearly visible from the side." src="http://opentextbc.ca/geography/wp-content/uploads/sites/34/2014/06/Hope_slide-e1406241761321.jpg" height="300" width="400" title="" /></a><div class="wp-caption-text" id="caption-attachment-191">Figure 8.10 Hope Slide; mountain scare is clearly visible from the side</div></div> <p>The landslide was caused by the presence of pre-existing tectonic structures (faults and shear zones) within the southwestern slope of Johnson Ridge. The lower parts of the slide scar are underlain by <strong class="Bold">felsite sheets </strong>(which may have failed first) while the upper parts of the slide scar are underlain by highly jointed <strong class="Bold">Paleozoic greenstone</strong> beds. Ongoing weathering and tectonic activity weakened the slide mass to the point where it had reached limiting equilibrium.</p> <p>Although we know the cause of the landslide, it remains unclear what the actual trigger was. A published analysis of seismograph records from January 9, 1965, suggested that the Hope Slide probably occurred as two rock avalanches separated by about 3 hours.</p> <p>Changes in groundwater condition are often a trigger for landslides, though are not thought to have played a role in the Hope Slide as the slide occurred during a protracted period of sub-zero temperatures in the winter. Weather records for the 25 days prior to the slide indicate that the temperature was much colder than normal, with&nbsp;the average daily temperature not exceeding 0º C, and on most days it was below -10º C (Earle, 2006). Some have suggested that freezing of seepage exit points may have caused an increase in water pressure at the toe of the slide. It is also suggested that progressive long-term deformation of the slopes of the southwest flanks of Johnson Peak caused the stability of the slope to deteriorate. We can conclude&nbsp;that the Hope Slide was the catastrophic result of very long term non-episodic mountain slope deformation.</p> <p>Since the landslide, the highway has been rerouted around and over the base of the slide’s debris field 55 metres above the original ground level on the other side of valley. As a result of the slide, the mountainside remains bare rock, without significant growth of trees or other large vegetation. Visitors to the region can view the scar of the landslide along Highway 3 at a viewpoint.</p> <h3>Attributions</h3> <ul><li><strong>Figure 8.9</strong> Hope Slide location (<a href="http://wikimapia.org/#lang=en&amp;lat=49.302404&amp;lon=-121.180916&amp;z=13&amp;m=b&amp;show=/7296/The-Hope-Slide" target="_blank" data-url="http://wikimapia.org/#lang=en&amp;lat=49.302404&amp;lon=-121.180916&amp;z=13&amp;m=b&amp;show=/7296/The-Hope-Slide">http://wikimapia.org/#lang=en&amp;lat=49.302404&amp;lon=-121.180916&amp;z=13&amp;m=b&amp;show=/7296/The-Hope-Slide</a>) by Wikimapia (http://wikimapia.org) licensed under CC BY SA 2.0 <a href="//creativecommons.org/licenses/by-sa/2.0/ca/" target="_blank" data-url="//creativecommons.org/licenses/by-sa/2.0/ca/">(http://creativecommons.org/licenses/by-sa/2.0/ca/</a>)</li> <li><strong>Figure 8.10</strong> Hope Slide; mountain scare is clearly visible from the side.&nbsp; Hope Slide (<a href="http://en.wikipedia.org/wiki/Hope_Slide" target="_blank" data-url="http://en.wikipedia.org/wiki/Hope_Slide">http://en.wikipedia.org/wiki/Hope_Slide</a>) by Fawcett5 (<a href="http://en.wikipedia.org/wiki/User:Fawcett5" target="_blank" data-url="http://en.wikipedia.org/wiki/User:Fawcett5">http://en.wikipedia.org/wiki/User:Fawcett5</a>) is in the Public Domain.</li> </ul> 
	</div>
			
				
				<div class="footnotes"><div id='194-1'><p>This Week in BC History video can be viewed at https://www.youtube.com/watch?v=Aigd-_En5z0</p>
</div></div>
	</div>
<div class="chapter standard with-subsections" id="chapter-case-study-2-6" title="Case Study 2: 1964 Port Alberni Tsunami">
	<div class="chapter-title-wrap">
		<p class="chapter-number">67</p>
		<h1 class="chapter-title">Case Study 2: 1964 Port Alberni Tsunami</h1>
								</div>
	<div class="ugc chapter-ugc">
				 <p>On the afternoon of Good Friday, March 27, 1964, the strongest earthquake recorded in North America, and the second strongest ever recorded, occurred in Alaska. The Great Alaskan Earthquake was a 9.2 magnitude subduction zone (megathrust) earthquake located at a depth of approximately 25 kilometres. It lasted four minutes and 38&nbsp; seconds. 131 people died in the earthquake and ensuing tsunami’s (USGS, 2012).</p> <p>The epicentre of the earthquake was 125 kilometres&nbsp;east of Anchorage, Alaska, where many inadequately engineered houses, buildings and infrastructure were&nbsp;damaged or destroyed.&nbsp;Three hundred kilometers southwest, some areas near Kodiak were permanently raised by 9.1 metres. Southeast of Anchorage, areas around the head of Turnagain Arm near Girdwood and Portage dropped as much as 2.4 metres. A massive underwater slide at Port Valdez in Prince William Sound created an 8.2 metre tsunami that destroyed the village of Chenega, killing 23 of the 68 people who lived there. Post-quake tsunamis severely affected Whittier, Seward, Kodiak and other Alaskan communities, as well as people and property in Oregon, California and British Columbia.</p> <div class="wp-caption aligncenter" id="attachment_192" aria-describedby="caption-attachment-192" style="width: 400px"><a href="http://opentextbc.ca/geography/wp-content/uploads/sites/34/2014/06/Calculated_Travel_Time_Map_for_1964_Alaska_Tsunami.jpg" data-url="http://opentextbc.ca/geography/wp-content/uploads/sites/34/2014/06/Calculated_Travel_Time_Map_for_1964_Alaska_Tsunami.jpg"><img class="wp-image-192" alt="Figure 1. Calculated travel time map for the tectonic tsunami produced by the 1964 earthquake in Alaska. Map does not show the height or strength of the waves, only the calculated travel times. Number represents time in hours for the wave to reach the destination." src="http://opentextbc.ca/geography/wp-content/uploads/sites/34/2014/06/Calculated_Travel_Time_Map_for_1964_Alaska_Tsunami.jpg" height="373" width="400" srcset="https://opentextbc.ca/geography/wp-content/uploads/sites/34/2014/06/Calculated_Travel_Time_Map_for_1964_Alaska_Tsunami.jpg 800w, https://opentextbc.ca/geography/wp-content/uploads/sites/34/2014/06/Calculated_Travel_Time_Map_for_1964_Alaska_Tsunami-300x279.jpg 300w, https://opentextbc.ca/geography/wp-content/uploads/sites/34/2014/06/Calculated_Travel_Time_Map_for_1964_Alaska_Tsunami-65x60.jpg 65w, https://opentextbc.ca/geography/wp-content/uploads/sites/34/2014/06/Calculated_Travel_Time_Map_for_1964_Alaska_Tsunami-225x209.jpg 225w, https://opentextbc.ca/geography/wp-content/uploads/sites/34/2014/06/Calculated_Travel_Time_Map_for_1964_Alaska_Tsunami-350x325.jpg 350w" sizes="auto, (max-width: 400px) 100vw, 400px" title="" /></a><div class="wp-caption-text" id="caption-attachment-192">Figure 8.11 Calculated travel time map for the tectonic tsunami produced by the 1964 earthquake in Alaska. Map does not show the height or strength of the waves, only the calculated travel times. Number represents time in hours for the wave to reach the destination.</div></div> <p>Two types of tsunami were produced as a result of the earthquake: a&nbsp;<strong class="Bold">tectonic tsunami</strong>&nbsp;caused by the movement of the tectonic plates, and&nbsp;<strong class="Bold">subaerial landslide (or submarine) tsunami</strong>&nbsp;caused by underwater landslides. About 20 of these smaller tsunamis were responsible for the majority of the tsunami damage in over 20 countries, including Canada, Peru, New Zealand, Papua New Guinea and Japan.&nbsp;The largest recorded wave was at&nbsp;Shoup Bay, Alaska, at&nbsp; height of about 67 metres.</p> <p>Three hours after the quake, a 1.4 metre tsunami wave reached Prince Rupert, BC, and did little damage. Then, around midnight, the first of two waves began travelling up the 40 kilometre&nbsp;Alberni Inlet toward the towns of Alberni and Port Alberni. The narrow inlet amplified the size and intensity of the wave, and when it struck the two towns it had a height of 2.44 metres. One hour later, a second, larger wave of 3.05 metres hit. It was the second wave that caused most of the damage, lifting&nbsp;houses off their foundations and sweeping&nbsp;log booms on shore. The second wave was followed by four more waves ranging in height from&nbsp;1.52 metres and 1.83 metres&nbsp;and ocurring at roughly 90 minute intervals.</p> <p>In total, the tsunami washed away away 55 homes and damaged 375 others. It&nbsp;caused $5 million in damage in Port Alberni and Alberni. The mill at Port Alberni, which employed 4,000 people, was temporarily closed. Incredibly, there were no fatalities in either town. The tsunami lead directly to the amalgamation of Alberni and Port Alberni into a single town in 1966.</p> <h2>Animation of Tsunami Generated by the Earthquake</h2> <p>If you are reading this in print, you can see the animation at <a href="https://www.youtube.com/watch?v=rJOGJApz1M0" target="_blank" data-url="https://www.youtube.com/watch?v=rJOGJApz1M0">https://www.youtube.com/watch?v=rJOGJApz1M0</a>.</p> <p></p> <div class="textbox interactive-content interactive-content--iframe"><span class="interactive-content__icon"></span> <p>One or more interactive elements has been excluded from this version of the text. You can view them online here: <a href="https://opentextbc.ca/geography/?p=486" title="Case Study 2: 1964 Port Alberni Tsunami" data-url="https://opentextbc.ca/geography/?p=486">https://opentextbc.ca/geography/?p=486</a> </p> </div> <h2><span style="background-color: #ffffff; color: #333333;">Attributions</span></h2> <p><strong>Figure 8.11</strong> Calculated Travel Time Map for 1964 Alaska Tsunami (<a target="_blank" href="http://en.wikipedia.org/wiki/File:Calculated_Travel_Time_Map_for_1964_Alaska_Tsunami.jpg" data-url="http://en.wikipedia.org/wiki/File:Calculated_Travel_Time_Map_for_1964_Alaska_Tsunami.jpg">http://en.wikipedia.org/wiki/File:Calculated_Travel_Time_Map_for_1964_Alaska_Tsunami.jpg</a>) by Ngdchazards&nbsp; used under CC BY SA 3.0 (<a href="http://creativecommons.org/licenses/by-sa/3.0/deed.en" target="_blank" data-url="http://creativecommons.org/licenses/by-sa/3.0/deed.en">http://creativecommons.org/licenses/by-sa/3.0/deed.en</a>)</p> 
	</div>


	</div>
<div class="chapter standard with-subsections" id="chapter-case-study-3" title="Case Study 3: 2003 Okanagan Mountain Park Fire">
	<div class="chapter-title-wrap">
		<p class="chapter-number">68</p>
		<h1 class="chapter-title">Case Study 3: 2003 Okanagan Mountain Park Fire</h1>
								</div>
	<div class="ugc chapter-ugc">
				 <p>On August 16, 2003, a wildfire was started near Rattlesnake Island in Okanagan Mountain Provincial Park in British Columbia. The one-in-a-hundred-year inferno began with a lightning strike and was fuelled by a constant wind and one of the driest summers in a&nbsp;decade.</p> <p>If you are reading this in print, you can view the following video at: <a href="https://www.youtube.com/watch?v=AsPG8zB-V1E" target="_blank" data-url="https://www.youtube.com/watch?v=AsPG8zB-V1E">https://www.youtube.com/watch?v=AsPG8zB-V1E</a></p> <p></p> <div class="textbox interactive-content interactive-content--iframe"><span class="interactive-content__icon"></span> <p>One or more interactive elements has been excluded from this version of the text. You can view them online here: <a href="https://opentextbc.ca/geography/?p=489" title="Case Study 3: 2003 Okanagan Mountain Park Fire" data-url="https://opentextbc.ca/geography/?p=489">https://opentextbc.ca/geography/?p=489</a> </p> </div> <p>The fire grew northward and eastward, initially threatening a small number of lakeshore homes, but quickly became an&nbsp;<strong>interface zone</strong><strong class="Bold">&nbsp;</strong>fire as it approached the city of Kelowna. An&nbsp;<strong>interface zone</strong> is an area where urban development occurs on or near&nbsp;lands that have a significant fire risk.</p> <div class="wp-caption aligncenter" id="attachment_193" aria-describedby="caption-attachment-193" style="width: 400px"><a href="http://opentextbc.ca/geography/wp-content/uploads/sites/34/2014/06/2003_Okanagan_Mountain_Park_Fire-e1406071597245.jpg" data-url="http://opentextbc.ca/geography/wp-content/uploads/sites/34/2014/06/2003_Okanagan_Mountain_Park_Fire-e1406071597245.jpg"><img class="wp-image-193" alt="Figure 1. Satellite image in natural colours of the fire location and the surrounding area. In white is the smoke from the fire, in red inside the white area are fire hotspots of intense heat." src="http://opentextbc.ca/geography/wp-content/uploads/sites/34/2014/06/2003_Okanagan_Mountain_Park_Fire-e1406071597245.jpg" height="418" width="400" title="" /></a><div class="wp-caption-text" id="caption-attachment-193">Figure 8.12 Satellite image in natural colours of the fire location and the surrounding area. In white is the smoke from the fire, in red inside the white area are fire hotspots of intense heat.</div></div> <p>The fire eventually grew to cover over 250 square kilometres and&nbsp; forced the evacuation of 27,000 residents. The firestorm challenged personnel from over 60 fire departments across BC:&nbsp;over 1,000 forestry fire fighters, contractors and loggers as well as 1,400 members of the Canadian armed forces.</p> <p>Tourism and the local wine industry were heavily impacted by the fire. August is the peak tourist season in the Okanagan region and tourism numbers are estimated to have declined&nbsp;30% to&nbsp;50% below normal during the period of the fire. A popular tourist attraction for extreme mountain biking, the Crawford area trails were closed indefinitely.&nbsp;The Kelowna Crags, a rock-climbing area within the fire zone was compromised by the heat of the fires, and six marine campgrounds accessible only by boat on Okanagan Lake, were destroyed. The St. Hubertus Estate Winery, originally planted in 1928, was destroyed along with the the owner’s home and the entire 2003 crop. Although St. Hubertus was the only winery damaged by fire, many others&nbsp;in the region also lost their crop that year due to&nbsp;smoke taint.</p> <p>In the end, 239 buildings were destroyed. The fire also destroyed&nbsp;12 historic wooden railway trestles and damaged two other steel trestles in the Myra Canyon<strong class="Bold">.</strong>&nbsp;These trestles were part of the Myra Canyon Section of the Kettle Valley Railway, in use from 1914 to 1978, and were considered&nbsp;a historic engineering feat. The section&nbsp;was declared a national historic site of Canada in 2002.</p> <h2>Attributions</h2> <ul><li><strong>Figure 8.12</strong> Satellite image in natural colours of the fire location and the surrounding area. 2003 Okanagan Mountain Park Fire (<a href="en.wikipedia.org/wiki/2003_Okanagan_Mountain_Park_Fire" target="_blank" data-url="en.wikipedia.org/wiki/2003_Okanagan_Mountain_Park_Fire">en.wikipedia.org/wiki/2003_Okanagan_Mountain_Park_Fire</a>) by NASA/GSFC/METI/Japan Space Systems, and U.S./Japan ASTER Science Team (<a href="http://asterweb.jpl.nasa.gov/gallery-detail.asp?name=okanagan" target="_blank" data-url="http://asterweb.jpl.nasa.gov/gallery-detail.asp?name=okanagan">http://asterweb.jpl.nasa.gov/gallery-detail.asp?name=okanagan</a>) is in the Public Domain.</li> </ul> 
	</div>


	</div>
<div class="chapter standard with-subsections" id="chapter-slug-9-7-summary" title="Summary">
	<div class="chapter-title-wrap">
		<p class="chapter-number">69</p>
		<h1 class="chapter-title">Summary</h1>
								</div>
	<div class="ugc chapter-ugc">
				 <p>Physical geography is the study of the processes and patterns of the natural environment. This&nbsp;chapter provided an overview of the array of process that create British Columbia’s physical characteristics and give the province&nbsp;its unique landscape.&nbsp; BC’s complex landscape includes 47 official ecoregions&nbsp;as defined by the government of BC –&nbsp;areas with physiographic,&nbsp;microclimatic and oceanographic variation.&nbsp;Marine and terrestrial ecosystems interact to create a unique and vibrant coastal zone.</p> <p>Climate change refers to change in weather patterns over time. Climate change impacts irreplaceable natural resources:&nbsp;water and air, game, fish, scenery, flood control natural barriers, metals, minerals and natural gas. The province of British Columbia must take some actions to further protect the environment of the region. Each person can make a difference if acting as a collective.&nbsp;Possible&nbsp;actions include:</p> <ul><li>Reducing emissions by reducing car usage, buying food locally, using&nbsp;eco-friendly products where possible, buying energy efficient appliances, getting energy from renewable sources and turning down heat sources in winter by just two degrees.</li> <li>Enhancing preparedness procedures, as has been done with the&nbsp;creation of &nbsp;FireSmart communities.</li> </ul> <p>Geology refers to the study of the solid features of any celestial body (such as the Moon or Mars).&nbsp;Geology gives insight into the history of the Earth by providing the primary evidence for plate tectonics, the evolutionary history of life and past climates. Geology is vital in BC as economic development is associated with mineral and hydrocarbon (oil and natural gas) exploration and&nbsp;harvest.</p> <p>Geomorphology is the study of the process that creates and transforms the surface of the Earth. Geomorphology seeks to understand landform history and dynamics, and predict future changes through a combination of field observation, physical experiment and numerical modelling (geomorphometry). Plate tectonics theory suggests that the Earth’s lithosphere is made up of seven large plates and several small ones. The plate edges are where most volcanic and earthquake activity take place.</p> <p>Natural hazards are a direct result of the physical geography of BC. BC has a complex system of fault lines. The five fault lines featured in the chapter are the Pinchi Fault in Central BC, the Fraser River Fault, the Columbia River Fault, the Rocky Mountain Fault and the San Juan Fault.</p> <p>Some of the most devastating events that have occurred because of natural hazards include the Okanagan forest fire, the Hope Slide and the Port Alberni tsunami.</p> 
	</div>


	</div>
<div class="chapter standard with-subsections" id="chapter-slug-9-10-key-terms" title="Key Terms">
	<div class="chapter-title-wrap">
		<p class="chapter-number">70</p>
		<h1 class="chapter-title">Key Terms</h1>
								</div>
	<div class="ugc chapter-ugc">
				 <div class="bcc-box bcc-success"><h3>Key Terms</h3> <p><strong>Biogeoclimatic&nbsp;zones:</strong></p> <p>Alpine Tundra<br /> Spruce—Willow—Birch<br /> Boreal White and Black Spruce<br /> Sub-Boreal Pine—Spruce<br /> Sub-Boreal Spruce<br /> Mountain Hemlock<br /> Engelmann Spruce—Subalpine Fir<br /> Montane Spruce<br /> Bunchgrass<br /> Ponderosa Pine<br /> Interior Douglas-fir<br /> Coastal Douglas-fir<br /> Interior Cedar—Hemlock<br /> Coastal Western Hemlock</p> <p><strong>Climate change:</strong>&nbsp;A significant and lasting change in&nbsp;weather&nbsp;patterns&nbsp;over time. This includes a variation in the average weather patterns,&nbsp;and/or more extreme weather patterns such as increased precipitation or drought.&nbsp;Natural factors such as biotic processes, variations in&nbsp;solar radiation received by Earth,&nbsp;plate tectonics and&nbsp;volcanic eruptions can influence climate change, but by far the most significant is the impact of human activities.</p> <p><strong class="Bold">Felsite sheet:&nbsp;</strong>A&nbsp;very fine grained volcanic rock that may or may not contain larger crystals. Felsite is a field term for a light-coloured rock that typically requires petrographic examination or chemical analysis for more precise definition. <strong class="Bold"><br /> </strong></p> <p><strong>Geology:</strong>&nbsp;The study of and&nbsp;discourse involving the&nbsp;solid Earth, including the rocks of which it is composed, and the processes by which they change. Geology can also refer generally to the study of the solid features of any celestial body (such as the Moon or Mars).</p> <p><strong>Geomorphology:</strong> The &nbsp;study of the process that creates and transforms the surface of the Earth.&nbsp;Geomorphology seeks to understand landform history and dynamics, and predict future changes through a combination of field observation, physical experimen, and numerical modelling (geomorphometry).</p> <p><strong class="Bold">Isostasy:&nbsp;</strong>The process of the surface of the Earth loading and unloading. For example, the Rocky Mountains are made up of sedimentary rock which erodes relatively quickly.<br /> <strong class="Bold"><br /> Isostatic rebound:&nbsp;</strong>The term used to describe the process of very heavy mountains erode from the top so that they actually “float up” and grow.</p> <p><strong>Landslide:</strong> The general term used to&nbsp;describe the movement of&nbsp;rock, soil and other debris down a slope as a result of&nbsp;gravitational pull.</p> <p><strong>Natural hazard:</strong> Any natural process that is a potential threat to human life and property. Natural hazards tend to be repetitive events and are predictable.</p> <p><strong class="Bold">Orogeny: </strong>Two plates jamming together, with the edges often fracturing and collapsing to&nbsp;form mountain ranges.</p> <p><strong class="Bold">Subaerial landslide (or submarine) tsunami:&nbsp;</strong>Large water waves generated by landslides, rock falls, snow avalanches, glacier calving, or meteoroids falling&nbsp;into a water body.</p> <p><strong class="Bold">Subduction: </strong>&nbsp;The process of&nbsp;plates colliding when&nbsp;one is denser or heavier than the other, forcing the heavier one downward and under the other.</p> <p><strong class="Bold">Tectonic tsunami: </strong><a href="https://www.e-education.psu.edu/earth501/content/p2_p3.html" data-url="https://www.e-education.psu.edu/earth501/content/p2_p3.html">https://www.e-education.psu.edu/earth501/content/p2_p3.html</a></p> </div> 
	</div>


	</div>
<div class="chapter standard with-subsections" id="chapter-slug-9-8-activities" title="Suggested Activities">
	<div class="chapter-title-wrap">
		<p class="chapter-number">71</p>
		<h1 class="chapter-title">Suggested Activities</h1>
								</div>
	<div class="ugc chapter-ugc">
				 <div class="bcc-box bcc-info"><h3>Suggested Activities</h3> <h2>Activity 1</h2> <p>Calculate how much time it approximately took for the tectonic tsunami from 1964 Alaska earthquake to reach the coast of Tofino BC.</p> <h2>Activity 2</h2> <p>Do some research online and c.Create your own tsunami or earthquake action plan. What would you do to prepare yourself for an earthquake or tsunami? What resources do the residents of BC have to&nbsp;protect against future tsunamis? What actions should be taken when a tsunami warning is announced?</p> <h2>Activity 3</h2> <p>Using the following website from University of British Columbia Department of Forestry, explain what is happening the the bioclimates of BC. <a href="http://cfcg.forestry.ubc.ca/projects/climate-data/climatebc-and-bioclimatic-envelope-modelling/%20" target="_blank" data-url="http://cfcg.forestry.ubc.ca/projects/climate-data/climatebc-and-bioclimatic-envelope-modelling/%20">http://cfcg.forestry.ubc.ca/projects/climate-data/climatebc-and-bioclimatic-envelope-modelling/ </a></p> <h2>Activity 4</h2> <p>Use the following website to see how the climate has changed in your local area in BC on this day since 1840 at 20-year intervals and then plot the data on a graph using excel&nbsp;<a href="http://climate.weather.gc.ca" target="_blank" data-url="http://climate.weather.gc.ca">http://climate.weather.gc.ca</a></p> <h2>Activity 5</h2> <p>Use your GPS-enabled smartphone or a handheld GPS to engage in Geocaching. Locate a GeoCache near you. Observe the physical environment in the process.<a href="//www.geocaching.com/" target="_blank" data-url="//www.geocaching.com/">&nbsp;http://www.geocaching.com/</a></p> <h2>Activity 6</h2> <p>Make a real time earthquake map. The United States Geological Society (USGS)&nbsp;has made its real-time earthquake information available via an API (see research methods section) thus making it easy to integrate this information with an online map. As a result there are several up-to-date online maps available on the web. Here are a few links:</p> <ul><li><a href="http://earthquaketrack.com/" target="_blank" data-url="http://earthquaketrack.com/">http://earthquaketrack.com/</a></li> <li><a href="http://www.iris.edu/seismon/" target="_blank" data-url="http://www.iris.edu/seismon/">http://www.iris.edu/seismon/</a></li> <li><a href="http://earthquake.usgs.gov/earthquakes/map/" target="_blank" data-url="http://earthquake.usgs.gov/earthquakes/map/">http://earthquake.usgs.gov/earthquakes/map/</a></li> </ul> <h2>Activity 7</h2> <p>Here are directions on how to make your own earthquake map using Google Maps API. There are several other tutorials available online. Find one that matches your technological skill level.</p> <ul><li><a href="https://developers.google.com/maps/tutorials/visualizing/earthquakes" target="_blank" data-url="https://developers.google.com/maps/tutorials/visualizing/earthquakes">https://developers.google.com/maps/tutorials/visualizing/earthquakes</a></li> <li>Link to data <a href="//earthquake.usgs.gov/earthquakes/feed/v1.0/geojson.php" target="_blank" data-url="//earthquake.usgs.gov/earthquakes/feed/v1.0/geojson.php">http://earthquake.usgs.gov/earthquakes/feed/v1.0/geojson.php</a></li> </ul> </div> <p>&nbsp;</p> 
	</div>


	</div>
<div class="chapter standard with-subsections" id="chapter-slug-9-9-references-and-resources" title="References and Resources">
	<div class="chapter-title-wrap">
		<p class="chapter-number">72</p>
		<h1 class="chapter-title">References and Resources</h1>
								</div>
	<div class="ugc chapter-ugc">
				 <h2>References</h2> <p>2003 Okanagan Mountain Park Fire, 2014 from Wikipedia <a target="_blank" href="https://en.wikipedia.org/w/index.php?title=2003_Okanagan_Mountain_Park_Fire&amp;oldid=617428650" data-url="https://en.wikipedia.org/w/index.php?title=2003_Okanagan_Mountain_Park_Fire&amp;oldid=617428650">https://en.wikipedia.org/w/index.php?title=2003_Okanagan_Mountain_Park_Fire&amp;oldid=617428650</a> and used under a CC-BY-SA license</p> <p>British Columbia’s Coast Region Species and Ecosystems of Conservation Concern [WWW Document], n.d. URL http://ibis.geog.ubc.ca/biodiversity/factsheets/ (accessed 7.25.14).</p> <p>Cannings, S., Cannings, R., 1999. Geology of British Columbia: A Journey Through Time. D&amp;M Publishers Incorporated.</p> <p>Centre for Forest Conservation Genetics, n.d. About BEC and BGC units | CFCG [WWW Document]. URL http://cfcg.forestry.ubc.ca/resources/cataloguing-in-situ-genetic-resources/about-bec-and-bgc-units/ (accessed 7.25.14).</p> <p>Dessai, S., Adger, W.N., Hulme, M., Turnpenny, J., Köhler, J. and Warren, R. 2004. Defining and Experiencing Dangerous Climate Change. Climate Change,&nbsp;64&nbsp;(1-2):&nbsp;pp&nbsp;11-25</p> <p>Dennis A. Demarchi, n.d. Ecology – Ecosystems Branch – Environment – Province of British Columbia [WWW Document]. URL http://www.env.gov.bc.ca/ecology/ecoregions/ (accessed 7.25.14)</p> <p>Digital Geology Maps [WWW Document], n.d. URL <a target="_blank" href="http://www.empr.gov.bc.ca/Mining/Geoscience/PublicationsCatalogue/DigitalGeologyMaps/Pages/default.aspx" data-url="http://www.empr.gov.bc.ca/Mining/Geoscience/PublicationsCatalogue/DigitalGeologyMaps/Pages/default.aspx">http://www.empr.gov.bc.ca/Mining/Geoscience/PublicationsCatalogue/DigitalGeologyMaps/Pages/default.aspx</a> (accessed 7.25.14).</p> <p>Environment, M. of, n.d. Climate Change Impacts – Reports &amp; Data [WWW Document]. URL <a target="_blank" href="http://www2.gov.bc.ca/gov/topic.page?id=BE3D1E436EE14ADE8255FA0AD060659C" data-url="http://www2.gov.bc.ca/gov/topic.page?id=BE3D1E436EE14ADE8255FA0AD060659C">http://www2.gov.bc.ca/gov/topic.page?id=BE3D1E436EE14ADE8255FA0AD060659C</a> (accessed 7.25.14).</p> <p>Government of Canada, S.C., 2005. Principal heights by range or region [WWW Document]. URL http://www.statcan.gc.ca/tables-tableaux/sum-som/l01/cst01/phys03-eng.htm (accessed 8.29.14).</p> <p>Hope Slide, 2014 from Wikipedia (<a target="_blank" href="http://en.wikipedia.org/wiki/Hope_Slide" data-url="http://en.wikipedia.org/wiki/Hope_Slide">http://en.wikipedia.org/wiki/Hope_Slide</a>) and used under a CC-BY-SA license.</p> <p>Kelowna after the fire [WWW Document], n.d. The Globe and Mail. URL <a target="_blank" href="http://www.theglobeandmail.com/life/kelowna-after-the-fire/article1047274/" data-url="http://www.theglobeandmail.com/life/kelowna-after-the-fire/article1047274/">http://www.theglobeandmail.com/life/kelowna-after-the-fire/article1047274/</a> (accessed 7.25.14).</p> <p>Mathews, W.H., 2005. Roadside geology of southern British Columbia. Mountain Press Pub. Co, Missoula, Mont.</p> <p>Meidinger, D. and&nbsp;Pojar, J. 1991&nbsp;<em class="Italic">Ecosystems of British Columbia.&nbsp;</em>Special Report Series – Ministry of Forests, Victoria, British Columbia</p> <p>Ministry of Energy and Mines, n.d. Landslide Glossary [WWW Document]. URL <a target="_blank" href="http://www.empr.gov.bc.ca/MINING/GEOSCIENCE/SURFICIALGEOLOGYANDHAZARDS/LANDSLIDES/Pages/Glossary.aspx" data-url="http://www.empr.gov.bc.ca/MINING/GEOSCIENCE/SURFICIALGEOLOGYANDHAZARDS/LANDSLIDES/Pages/Glossary.aspx">http://www.empr.gov.bc.ca/MINING/GEOSCIENCE/SURFICIALGEOLOGYANDHAZARDS/LANDSLIDES/Pages/Glossary.aspx</a> (accessed 7.25.14).</p> <p>McGillivray, B., 2011. Geography of British Columbia: people and landscapes in transition, 3rd ed. ed. UBC Press, Vancouver.</p> <p>Plouffe, A.&nbsp;2001 The glacial transport and physical portioning of mercury and gold in till: implications for mineral exploration with examples from central British Columbia Canada. P. 287- 300 Book title: Drift Exploration in Glaciated Terrain edited M.B. McClenaghan, PT Bolorowsky GEM Hall SJ Cook Geological Society&nbsp; Special Publication No. 185Roadside Geology of Southern British Columbia Matthews, W.H. &amp; Monger</p> <p>Remembering the 1964 Port Alberni tsunami, n.d. Global News <a target="_blank" href="http://globalnews.ca/news/1227757/watch-remembering-the-1964-port-alberni-tsunami/" data-url="http://globalnews.ca/news/1227757/watch-remembering-the-1964-port-alberni-tsunami/">http://globalnews.ca/news/1227757/watch-remembering-the-1964-port-alberni-tsunami/</a></p> <p>Special Report on Alberni Tidal Wave Disaster <a target="_blank" href="http://embc.gov.bc.ca/em/hazard_preparedness/Alberni_Tsunami_Report_1964.pdf" data-url="http://embc.gov.bc.ca/em/hazard_preparedness/Alberni_Tsunami_Report_1964.pdf">http://embc.gov.bc.ca/em/hazard_preparedness/Alberni_Tsunami_Report_1964.pdf</a></p> <p>Steven Earle, n.d. Hope Slide&nbsp;<a target="_blank" href="http://web.viu.ca/earle/geol390/hope-slide.doc" data-url="http://web.viu.ca/earle/geol390/hope-slide.doc">http://web.viu.ca/earle/geol390/hope-slide.doc</a> .</p> <p>USGS, 2012. Historic Earthquakes [WWW Document]. URL http://earthquake.usgs.gov/earthquakes/states/events/1964_03_28.php (accessed 8.29.14).</p> <h2>Resources</h2> <ul><li>A useful resource for instructors to see how their students can get involved <a href="http://www.sierraclub.bc.ca/education/ecomap" target="_blank" data-url="http://www.sierraclub.bc.ca/education/ecomap">http://www.sierraclub.bc.ca/education/ecomap</a></li> <li>Factsheets which&nbsp;provides species conservation ranking, field identification tips, ecology and links to management requirements and resources&nbsp;<a href="http://www.geog.ubc.ca/biodiversity/factsheets/" data-url="http://www.geog.ubc.ca/biodiversity/factsheets/">http://www.geog.ubc.ca/biodiversity/factsheets/</a></li> <li>Explore BC’s Species and Ecosystems <a href="http://a100.gov.bc.ca/pub/eswp/" data-url="http://a100.gov.bc.ca/pub/eswp/">http://a100.gov.bc.ca/pub/eswp/</a></li> <li>Information about how to prepare for disasters and facts about these disasters:&nbsp;<a href="http://www.getprepared.gc.ca/cnt/hzd/rgnl/bc-eng.aspx" data-url="http://www.getprepared.gc.ca/cnt/hzd/rgnl/bc-eng.aspx">http://www.getprepared.gc.ca/cnt/hzd/rgnl/bc-eng.aspx</a></li> <li>Provincial Emergency Management Agency <a href="http://embc.gov.bc.ca/em/index.html" data-url="http://embc.gov.bc.ca/em/index.html">http://embc.gov.bc.ca/em/index.html</a></li> </ul> 
	</div>


	</div>

</div>
<div class="back-matter appendix with-subsections" id="back-matter-tools-for-spatial-data-collection-and-utilization" title="Tools for Spatial Data Collection and Utilization">
	<div class="back-matter-title-wrap">
		<p class="back-matter-number">1</p>
		<h1 class="back-matter-title">Tools for Spatial Data Collection and Utilization</h1>
								</div>
	<div class="ugc back-matter-ugc">
				
 <h1 id="back-matter-200-section-1" class="section-header">Geographic Information</h1> <p><strong class="Bold">Geographic information </strong>is the collection of information about places and events that occur on the Earth’s surface. <strong class="Bold">Geographic information science </strong>(GIScience)&nbsp;is the study of&nbsp;organizations and tools associated with the process of collecting and disseminating geographic information.&nbsp;GIScience&nbsp;research includes topics that relate to&nbsp;cartography, remote sensing, photogrammetry, web mapping and spatial data organization.&nbsp;Digital data management of spatial information is also associated with GIScience.</p> <p>As we have seen throughout this book, there are a wide range of ways in which GIScience can help solve real-world problems. In this section,&nbsp;a range of tools associated with the collection and distribution of spatial data are presented as well as recommendations for further reading.</p> <h2>Geographic Information Systems (GIS)</h2> <p><strong class="Bold">Geographic information systems (GIS)</strong> are&nbsp;systems for input, storage, manipulation, summarizing, editing, querying&nbsp;and visualizing&nbsp;geographic information. (Read more in Longley, Goodchild, Maguire, &amp; Rhind, 2005).</p> <h2>Surveying</h2> <p><strong class="Bold">Surveying</strong>&nbsp;is&nbsp;the science of accurate measurement of natural and humanmade features on the Earth. Data collected by surveyors are&nbsp;then used to create highly precise maps. Surveyors calculate the precise position of points, distances and angles through geometry.</p> <h2>Remote Sensing</h2> <p><strong class="Bold">Remote sensing</strong>&nbsp;is the use of satellites orbiting the Earth to capture information of the surface and atmosphere. Satellites vary in spatial and spectral resolution. These signals are then transmitted to receiving stations on Earth where they can be transformed and distributed&nbsp;as digital images to be analyzed. Through the use of remote sensing, applying specific calculations to images can help spatial information analyst identify and classify features on a landscape such as changes in snowmelt and identifying the <a href="http://www.plosone.org/article/info%3Adoi%2F10.1371%2Fjournal.pone.0082306#pone-0082306-g011" target="_blank" data-url="http://www.plosone.org/article/info%3Adoi%2F10.1371%2Fjournal.pone.0082306#pone-0082306-g011">location of seasponges</a><span class="footnote"><span class="footnote-indirect" data-fnref="200-1"></span></span> without physically setting foot in that region. Remote sensing can be used to sense changes in ground cover, locate the presence of surficial&nbsp;minerals and identify the location of different types of vegetation. Both the Government of <a href="http://www.for.gov.bc.ca/hts/rs/" target="_blank" data-url="http://www.for.gov.bc.ca/hts/rs/">British Columbia</a><span class="footnote"><span class="footnote-indirect" data-fnref="200-2"></span></span> and the Government of <a href="http://www.nrcan.gc.ca/forests/remote-sensing/13429" target="_blank" data-url="http://www.nrcan.gc.ca/forests/remote-sensing/13429">Canada</a><span class="footnote"><span class="footnote-indirect" data-fnref="200-3"></span></span> extensively utilize remote sensing.</p> <h2>Maps</h2> <p><strong class="Bold">Maps</strong> are mathematical representations of Earth and the Earth’s surface. They can be used for geospatial data storage, spatial exploratory functions and as an analytical tool. Maps are a medium for visual communication of geospatial information relationships and depict human perception of the world. They can be used as spatial decision-making tools. For further study on maps, try the map reading skills crash course at <a href="http://www.wikihow.com/Read-a-Map" data-url="http://www.wikihow.com/Read-a-Map">http://www.wikihow.com/Read-a-Map</a></p> <h2>Cartography</h2> <p><strong class="Bold">Cartography</strong> is the design, construction and evaluation of maps. When designed well, maps can be&nbsp;powerful communication tools. The practice of cartography may require the knowledge of graphic design, computer science, mathematics, statistics, psychology and, most certainly, geography. The purpose of a map is to reduce the complexity of the real world to communicate a specific idea. A map should be quickly and easily interpreted by the viewer. All maps must include a legend to inform the user what is being represented, a north arrow or compass to orient the user and&nbsp;a scale bar to to reveal the dimensions being represented on&nbsp;the map.&nbsp;Cartographic principles are in place to guide cartographers. (Read more in Slocum, McMaster, Kessler, &amp; Howard, 2009.)</p> <h2>Geovisualization</h2> <p><strong class="Bold">Geovisualization</strong> is&nbsp;the display of geospatial information to be&nbsp;explored interactively in an effort to&nbsp;facilitate the process of hypothesis&nbsp;formation and knowledge construction&nbsp;(Dodge, McDerby, &amp; Turner, 2008;&nbsp;Dykes, MacEachren, &amp; Kraak, 2005;&nbsp;Kraak &amp;&nbsp;MacEachren, 2005; MacEachren &amp;&nbsp;Kraak, 2001).&nbsp;Data exploration is an individual activity in which unknown spatial patterns are revealed in an&nbsp;interactive environment (Slocum, McMaster, Kessler, &amp; Howard, 2009). A major difference between static cartography and geovisualization is interaction, and with geovisualizations it is possible that some information may go unnoticed without that interaction. Geovisualizations make it possible to provide&nbsp;more than one view (through multimedia, or another map, or tables or graphics). Geovisuazliations allow users to interact with data drawing their own conclusions and making them feel like they have made a new discovery.</p> <p>There are a wide varity of software packages available to create maps and geovisaulziations. A few software packages currently available and widely used are:</p> <ul><li>QGIS,&nbsp;a&nbsp;free and open source software (FOSS), meaning that it is free of charge and&nbsp;the code is made publicly available to be&nbsp;manipulated and improved. Additional tools and plug-ins are constantly being created. QGIS can be run on Mac or PC.&nbsp;http://www.qgis.org/en/site/</li> <li>ArcGIS, a&nbsp;proprietary&nbsp;software and industry standard</li> </ul> <p>Increasingly, anyone with Internet access can utilize simple GIS capabilities through online mapping platforms such as a digital earth. Digital globes or web maps are interactive digital representations of the Earth’s surface. Applications associated with Web maps&nbsp;include&nbsp;information systems used for online travel and hotel bookings, finding restaurants and getting directions to a desired location. Application programming interface (API) make it possible to harness information from online resources such as&nbsp;social media outlets and other data repositories&nbsp;that can then be collected and integrated with a map.</p> <h2>Digital Globes</h2> <p><strong class="Bold">Digital globes</strong> are three-dimensional&nbsp;representations of the Earth in high-resolution format. The aim of a globe is to reduce distortion and reveal spatial relationships between places.&nbsp;Digital globes provide many advantages. The user is able to scale up or down with ease since they are highly interactive. Digital globes are&nbsp;easy to transport since they are accessible on mobile and desktop computers, files can be shared easily and each&nbsp;user can choose a topic of interest to overlay on the globe. As well, they&nbsp;are dynamic and can be outfitted with up-to-date information. Interacting with digital globes is fun because the user can pan and zoom anywhere in the world on the fly.</p> <p>Popular digital globes&nbsp;that also have an API associated to assist in the creation of “mashups” include:</p> <ul><li>Google Earth</li> <li>Google Maps: proprietary data sources</li> <li>OpenStreetMap: all data have been contributed volunteerarily by citizens uploading and digitizing spatial data</li> <li>Yahoo Maps</li> <li>MapQuest</li> </ul> <p>Smartphones are pervasive among the general public and can be used to collect all sorts of spatial data. Most smartphones have built-in sensors that are able to document spatial data. Two ways in which you have likely interacted with geospatial technology and geographic information science with a smartphone&nbsp;are through volunteered geographic information and location-based services.</p> <h2>Volunteered Geographic Information&nbsp;(VGI)</h2> <p><strong class="Bold">Volunteered geographic information&nbsp;(VGI)</strong> is information collected by users roving the surface of the Earth. VGI is the contribution of content regarding local activities in various geographic locations around the world that may traditionally go unnoticed by the rest of the world’s media. People now have the ability to&nbsp;share qualitative or quantitative information with an Internet-enabled audience about their experience in a specific&nbsp;place in the world. VGI is typically collected and shared through the use of smartphones. Examples of VGI include checking into a location using Facebook or Foursquare, geotagging a photo and&nbsp;sharing a restaurant review on Yelp. When you use a new application you should be asked “Does this&nbsp;app&nbsp;have permission to use your locational information?” If you answered “yes” for the camera application on your phone,&nbsp;geocoded&nbsp;coordinates will be applied to the&nbsp;metadata associated with the image file so you can then map your photo at a later time, or an application associated with your phone will map your photos for you. This could be considered&nbsp;VGI.</p> <h2>Location-Based Services (LBS)</h2> <p><strong class="Bold">Location-based services (LBS)</strong> are services that offer information about where a location-aware device user is situated (Gartner, Cartwright, &amp; Peterson, 2007; Jiang &amp; Yao, 2007). Examples include popular applications such as Google Maps.</p> <p>VGI and LBS and the collection of other types of spatial data&nbsp;are not possible without sensors for collecting spatial data.</p> <p>With the increased computing capabilities and decrease in cost for hardware, collecting spatial data is becoming more and more&nbsp;accessible and feasible for the public. There are several options for collecting your own local spatial data and it can be done with relatively low-cost resources.</p> <h2>Global Positioning System (GPS)</h2> <p>A <strong class="Bold">global positioning system (GPS)&nbsp;</strong>is a&nbsp;satellite network&nbsp;that communicates with GPS&nbsp;receivers accessed by mobile users.&nbsp;The GPS receiver needs to connect with four or more satellites orbiting the Earth, as reference to calculate the precise&nbsp;location of the user within a few metres. GPS satellites&nbsp;were launched by the United States military but are also used for civilian use. GPS receivers&nbsp;are widely used in cars and smartphones to provide&nbsp;directions to specific&nbsp;locations. Individual GPS recievers can be purchased and installed on almost anything. Physical geographers and human geographers alike find them valuable for&nbsp;documenting information about place.</p> <p>Data formats collected by the GPS can be exported&nbsp;from many different file formats to be used in a wide variety of software platforms.</p> <p>For collecting your own up-to-date aerial photos you can mount cameras and&nbsp;GPS&nbsp;sensors to <strong class="Bold">drones</strong> or <strong class="Bold">unmanned aerial vehicle (UAV) ages</strong>, or by&nbsp;<strong class="Bold">balloon mapping</strong>.</p> <div class="wp-caption aligncenter" id="attachment_199" aria-describedby="caption-attachment-199" style="width: 400px"><a href="http://opentextbc.ca/geography/wp-content/uploads/sites/34/2014/06/8725078749_b8baf91344_b-e1405030339502.jpg" data-url="http://opentextbc.ca/geography/wp-content/uploads/sites/34/2014/06/8725078749_b8baf91344_b-e1405030339502.jpg"><img class="wp-image-199" alt="Figure 1. Drone and Moon by Don McCullough (https://www.flickr.com/photos/69214385@N04/8725078749/in/photostream/) licensed under CC BY 2.0 (https://creativecommons.org/licenses/by/2.0/)" src="http://opentextbc.ca/geography/wp-content/uploads/sites/34/2014/06/8725078749_b8baf91344_b-e1405030339502.jpg" height="267" width="400" title="" /></a><div class="wp-caption-text" id="caption-attachment-199">Figure 1. Drone and Moon by Don McCullough (https://www.flickr.com/photos/69214385@N04/8725078749/in/photostream/) licensed under CC BY 2.0 (https://creativecommons.org/licenses/by/2.0/)</div></div> <h3>An example of balloon mapping</h3> <p>The interactive aerial map below shows an example of balloon mapping. If you are reading this in print, you can view the map at <a href="http://archive.publiclaboratory.org/leaflet/?tms=http://mapknitter.org/tms/ne-false-creek/&amp;lon=-123.1058161843&amp;lat=49.2763304549&amp;zoom=17" data-url="http://archive.publiclaboratory.org/leaflet/?tms=http://mapknitter.org/tms/ne-false-creek/&amp;lon=-123.1058161843&amp;lat=49.2763304549&amp;zoom=17">http://archive.publiclaboratory.org/leaflet/?tms=http://mapknitter.org/tms/ne-false-creek/&amp;lon=-123.1058161843&amp;lat=49.2763304549&amp;zoom=17</a></p> <p></p> <div class="textbox interactive-content interactive-content--iframe"><span class="interactive-content__icon"></span> <p>One or more interactive elements has been excluded from this version of the text. You can view them online here: <a href="https://opentextbc.ca/geography/?p=200" title="Tools for Spatial Data Collection and Utilization" data-url="https://opentextbc.ca/geography/?p=200">https://opentextbc.ca/geography/?p=200</a> </p> </div> <p>If you are interested in trying out balloon or kite mapping yourself, you’ll find some do-it-yourself&nbsp;resources at <a href="http://publiclab.org/wiki/balloon-mapping" target="_blank" data-url="http://publiclab.org/wiki/balloon-mapping">http://publiclab.org/wiki/balloon-mapping</a>.</p> <h2>Existing Spatial Data Sources</h2> <p>Several government and other organizations often make spatial data publicly available in a variety of formats that are relatively easy for the general public to use&nbsp;through the creation of mash-ups. Mash-ups are web pages that&nbsp;take&nbsp;data from two different sources or sets and put them together. Just two examples of mash-ups include taking data from Vancouver open data and overlaying them on a Google maps.</p> <ul><li>Vancouver Open Data in file formats compatible with the Web, Google Maps and Google Earth, ArcGIS and QGIS and several other file formats compatible with accessible software systems.&nbsp;<a href="http://vancouver.ca/your-government/open-data-catalogue.aspx" target="_blank" data-url="http://vancouver.ca/your-government/open-data-catalogue.aspx">http://vancouver.ca/your-government/open-data-catalogue.aspx</a></li> <li>British Columbia Open Data <a href="http://www.data.gov.bc.ca/dbc/geographic/index.page?WT.svl=Breadcrumb" target="_blank" data-url="http://www.data.gov.bc.ca/dbc/geographic/index.page?WT.svl=Breadcrumb">http://www.data.gov.bc.ca/dbc/geographic/index.page?WT.svl=Breadcrumb</a></li> <li>Canada wide data offered by the Canadian government in file formats compatible with QGIS and ArcGIS. <a href="http://geogratis.cgdi.gc.ca/" target="_blank" data-url="http://geogratis.cgdi.gc.ca/">http://geogratis.cgdi.gc.ca/</a></li> </ul> <p>There are far more available online, and they will&nbsp;change rapidly. There is increasing expectation that data should be made publicly available.</p> <h2>Ethical Considerations</h2> <p>When creating maps and interacting with&nbsp;spatial data, ethical considerations&nbsp;are required. It is important to consider what is and is not being represented on a map, and who and who is not being represented in a data set.&nbsp;Geospatial information is inherently sensitive because it is tied to specific locations and people. When building applications that collect or share personal information, it is important to consider whether&nbsp;the people who are being represented&nbsp;know that their information is being used and&nbsp;how it is being used. &nbsp;Privacy of information laws must&nbsp;be considered. &nbsp;(To read more about the ethical implications of mapping, see Crampton, 2010.)</p> <h2>References</h2> <p>Crampton, J. 2010, <em class="Italic">Mapping: A Critical Introduction to Cartography and GIS, </em>First edn, Wiley-Blackwell.</p> <p>Dodge, M., McDerby, M. &amp; Turner, M. 2008, <em class="Italic">Geographic visualization : concepts, tools and applications, </em>Wiley, Chichester, England ; Hoboken, NJ.</p> <p>Dykes, J., MacEachren, A.M. &amp; Kraak, M.J. 2005, <em class="Italic">Exploring geovisualization, </em>1st edn, Elsevier, Amsterdam.</p> <p>Elwood, S. &amp; Leszczynski, A. 2013, “New spatial media, new knowledge politics”,&nbsp;<em class="Italic">Transactions of the Institute of British Geographers,&nbsp;</em>vol. 38, no. 4, pp. 544-559.</p> <p>Gärtner, G., Cartwright, W. &amp; Peterson, M.P. 2007, <em class="Italic">Location based services and telecartography, </em>Springer, Berlin.</p> <p>Jiang, B. &amp; Yao, X. 2007, “Location based services and GIS in perspective” in <em class="Italic">Location based services and telecartography</em>, eds. G. Gärtner, W. Cartwright &amp; M.P. Peterson, Springer, Berlin, pp. 27.</p> <p>Kraak, M.J. &amp; MacEachren, A.M. 2005, “Geovisualization and GIScience”, <em class="Italic">Cartography and Geographic Information Science, </em>vol. 32, no. 2, pp. 67-67.</p> <p>Leszczynski, A. &amp; Wilson, M.W. 2013, “Theorizing the geoweb”,&nbsp;<em class="Italic">GeoJournal,&nbsp;</em>.</p> <p>Longley, P., Goodchild, M., Maguire, D. &amp; Rhind, D. 2005, <em class="Italic">Geographic Information Systems and Science, </em>John Wiley and Sons, England.</p> <p>MacEachren, A.M. &amp; Kraak, M.J. 2001, “Research challenges in geovisualization”, <em class="Italic">Cartography and Geographic Information Science, </em>vol. 28, no. 1, pp. 3-12.</p> <p>Slocum, T., McMaster, R., Kessler, F. &amp; Howard, H. 2009, <em class="Italic">Thematic cartography and geographic visualization, </em>3rd edn, Pearson/Prentice Hall, Upper Saddle River, NJ.</p> <h2>Suggested readings</h2> <p>Cartography. 2005. Deetz C. H. US. Coast and Geodetic Survey. University Press of the Pacific.</p> <p>Elements of Cartography. 1995. Robinson. A. H. Morrison J. L. Muehrcke P. C. A. Kimerling. J, Guptill. S. C. Wiley.</p> <p>Making Maps, Second Edition: A Visual Guide to Map Design for GIS. 2011. Krygier. J. and Wood. D., The Guilford Press.</p> <p>Thematic Cartography and Geovisualization. 2008. Slocum. T. A. McMaster. R. B. Kessler. F. C. and Howard. H. H., Prentice Hall.</p> <p>&nbsp;</p> 

	</div>
			
				
				<div class="footnotes"><div id='200-1'>
<p>Modeling the Distribution of Geodia Sponges and Sponge Grounds in the Northwest Atlantic <a href="http://www.plosone.org/article/info%3Adoi%2F10.1371%2Fjournal.pone.0082306#pone-0082306-g011" target="_blank" data-url="http://www.plosone.org/article/info%3Adoi%2F10.1371%2Fjournal.pone.0082306#pone-0082306-g011">http://www.plosone.org/article/info%3Adoi%2F10.1371%2Fjournal.pone.0082306#pone-0082306-g011</a></p>

</div><div id='200-2'>
<p>Examples of how the government of British Columbia uses remote sensing can be found at <a href="http://www.for.gov.bc.ca/hts/rs/" target="_blank" data-url="http://www.for.gov.bc.ca/hts/rs/">http://www.for.gov.bc.ca/hts/rs/</a></p>

</div><div id='200-3'>
<p>Examples of how the government of Canada uses remote sensing can be found at <a href="http://www.nrcan.gc.ca/forests/remote-sensing/13429" target="_blank" data-url="http://www.nrcan.gc.ca/forests/remote-sensing/13429">http://www.nrcan.gc.ca/forests/remote-sensing/13429</a></p>

</div></div>
	</div>
<div class="back-matter appendix " id="back-matter-qualitative-research-methods-in-human-geography" title="Qualitative Research Methods in Human Geography">
	<div class="back-matter-title-wrap">
		<p class="back-matter-number">2</p>
		<h1 class="back-matter-title">Qualitative Research Methods in Human Geography</h1>
								</div>
	<div class="ugc back-matter-ugc">
				 <p>Qualitative research is the collection of information about human behaviour and perception. It is about focusing in depth to find out why and how certain activities and events occur.</p> <p>In research we aim to be rigorous in the scientific processes, which means&nbsp;aiming to be&nbsp;thorough, exhaustive and accurate. This requires ensuring that&nbsp;a study is replicable, by being transparent about the steps that were taken to obtain the findings that are presented. It also means being able&nbsp;to justify why you took each step in your research. Triangulation is a technique used to instill rigour. Triangulation is the use of&nbsp;multiple research methods for data collection to reveal insight&nbsp;about a specific topic.</p> <div class="textbox shaded">Read more about methodological rigour in&nbsp;Baxter and Eyles 1997&nbsp;<a href="http://onlinelibrary.wiley.com/doi/10.1111/j.0020-2754.1997.00505.x/abstract" data-url="http://onlinelibrary.wiley.com/doi/10.1111/j.0020-2754.1997.00505.x/abstract">http://onlinelibrary.wiley.com/doi/10.1111/j.0020-2754.1997.00505.x/abstract</a></div> <h2>Key Considerations</h2> <p><strong class="Bold">Positionality:&nbsp;</strong>Who you are, where you are, and how you ask your questions will influence the responses you elicit from participants in your study.</p> <p><strong class="Bold">Reflexivity:&nbsp;</strong>This is a process of considering your own positionality and the effects that your positionality will have on your research. It entails throughly considering the benefits and drawbacks of your positionality, and how this in turn can benefit or hinder your research.</p> <div class="textbox shaded">Read more about positionality and reflexivity in Rose 1997,&nbsp;<a href="http://phg.sagepub.com/content/21/3/305.short" data-url="http://phg.sagepub.com/content/21/3/305.short">http://phg.sagepub.com/content/21/3/305.short</a></div> <p>S<strong>ample: </strong>A sample is a set of data. In the case of qualitative data methods covered in this section, your sample is composed of those who are taking part in your study. The number of people who participate will be your sample size. When you reach a point of saturation, it means that you are starting to collect the same ideas over and over from your sample.</p> <h2>Methods</h2> <p><strong class="Bold">Interview:&nbsp;</strong>An&nbsp;interview&nbsp;is a method of inquiry in which you ask your participants a set of questions.&nbsp; It can&nbsp;be semi-structured or and structured and can use&nbsp;different mediums (e.g., phone,&nbsp;email, in-person). A semi-structured interview is one in which you have an idea about the types of questions you ask but the order and way you ask the question may vary.&nbsp; A structured interview is a specified set of questions that is asked in the same order using the same words during each interview.</p> <p><strong class="Bold">Focus group:&nbsp;</strong>This is a method in which you have a heterogeneous population come together in one room to discuss a certain topic of interest. Typically a facilitator organizes the focus group and will guide the conversation to keep the topic of conversation on track. The strength of this method is the opportunity for free flow of conversation; comments tend to stimulate new ideas and discussion topics. The challenge associated with this method is that it is possible for a few assertive people to dominate the conversation.</p> <p><strong class="Bold">Participant observation:</strong>&nbsp;This refers to when a researcher embeds him- or herself&nbsp;in the research context by becoming an active participant.</p> <p>S<strong class="Bold">urvey:&nbsp;</strong>This method uses a set of written questions that the participants then answer directly on paper or online.</p> <p><strong class="Bold">Oral history:&nbsp;</strong>This is the process of gathering and listening to people tell their stories and share knowledge. Traditionally oral histories were passed down through generations, building the knowledge bases of communities. Oral histories are often recorded so that both the information, as well as the voices and character of the story telling, can be preserved.</p> <div class="textbox shaded">For more information on oral history see&nbsp;<a target="_blank" href="http://www.canoha.ca" data-url="http://www.canoha.ca">http://www.canoha.ca</a></div> <p><strong class="Bold">Participatory mapping:</strong>&nbsp;Sometimes called sketch mapping, this is&nbsp;asking a set of questions and having the participants draw how they view the world in a map form. It&nbsp;is typically done using a piece of paper, but could be done using digital free drawing applications.</p> <p><strong class="Bold">Journaling:&nbsp;</strong>When a researcher or a participant documents his or her&nbsp;thoughts feelings or ideas on a topic on a regular basis, it is referred to as journaling.&nbsp;Journaling&nbsp;is a free-flow writing exercise.</p> <p><strong class="Bold">Content analysis:</strong>&nbsp;This method collects&nbsp;content in multimedia formats from the media, policy documents and other outlets and then codes the material for common themes and ideas.</p> <p><strong class="Bold">Qualitative data analysis:</strong> Qualitative data is collected via the methods described above and then is&nbsp;often transcribed and thematically coded. This means a researcher will read the transcript to identify common themes. There are multiple strategies to code qualitative data, either by formulating codes prior to collection it and reading transcripts, or by the researcher identifying common themes that emerge from the data.</p> <p><strong class="Bold">Obtaining informed consent:</strong>&nbsp;Ethically, researchers are required to&nbsp;inform the participants of what data they are collecting, why, and how the data will be used and shared. Depending on the study, researchers may wish to maintain anonymity of the participants; however, in some studies they may wish to have their real names be used.</p> <h2>Further resources</h2> <ul><li>Iain Hay (2000) Qualitative Research Methods in Human Geography</li> </ul> 
	</div>


	</div>
<div class="back-matter appendix " id="back-matter-physical-geography-research-methods" title="Physical Geography Research Methods">
	<div class="back-matter-title-wrap">
		<p class="back-matter-number">3</p>
		<h1 class="back-matter-title">Physical Geography Research Methods</h1>
								</div>
	<div class="ugc back-matter-ugc">
				 <h2>Physical Geography&nbsp;Sampling</h2> <p>Because it is impossible to&nbsp;measure everything everywhere at the same time, researchers&nbsp;<strong class="Bold">sample</strong>.&nbsp;Sampling in physical geography is of the utmost importance in order to&nbsp;<span style="background-color: #ffffff;">limit the amount of information that you collect, and so that you are careful that your&nbsp;</span>sample<span style="background-color: #ffffff;">&nbsp;is&nbsp;</span>representative<span style="background-color: #ffffff;">&nbsp;of the whole&nbsp;</span>population<span style="background-color: #ffffff;">.</span>&nbsp;Sampling is based on three principals:</p> <ul><li>The&nbsp;<strong class="Bold">sample</strong>&nbsp;is the limited number of measurements that you make.</li> <li>The&nbsp;<strong class="Bold">population</strong>&nbsp;is the total number of measurements that you might take.</li> <li>A totally&nbsp;<strong class="Bold">representative</strong>&nbsp;sample is everything you need to know about the&nbsp;population.</li> </ul> <p>For example, weather precipitation stations are located at specific locations across the country.&nbsp;The readings from each station are then statistically interpolated to give a picture of a large region. &nbsp;The same techniques can be done for soil and stream sampling. There are three types of samplying in physical geography:</p> <ul><li><span style="background-color: #ffffff;"><strong>Random sampling</strong> is used where the study area is uniform. For example, in a flat, grassy field you&nbsp;can&nbsp;assume that the environmental conditions do not change within the area so&nbsp;it doesn’t matter where within the area you take your samples from.</span>&nbsp;<span style="background-color: #ffffff;">Random sampling should be free from bias,&nbsp;but it is difficult to obtain a representative sample. The number of samples taken&nbsp;</span><span style="background-color: #ffffff;">is important.</span></li> <li><strong>Systematic sampling</strong> is used when the study area includes an environmental gradient. You would sample along a line and&nbsp;sample points should be evenly spaced or distributed. Systematic sampling is quick and easy to do, but you must be careful not to&nbsp;miss variation. The number of samples that you take (the&nbsp;sampling size) is important.</li> <li><strong>Stratified sampling</strong> is used when the study area includes significantly different parts or subsets. In an investigation into the&nbsp;effect of stream ordering on discharge, a stratified sample would be to choose sites where the two river segments of the same order join. Stratified sampling overcomes the problem with missing variation that might arise with systematic sampling. It is, however, difficult to get background data to allow you to apply stratified sampling appropriately.</li> </ul> <div class="textbox shaded">Further readings.&nbsp; <em>An Introduction to Scientific Research Methods in Geography</em>.&nbsp; 2006&nbsp;Montello. D. R. and Sutton. P. C. Sage.</div> <h2>Soil Science Research Methods</h2> <p>Soil testing is done by taking soil samples from different locations of the soil horizons.&nbsp;The soil samples are then taken to a lab for further analysis of the content of moisture, minerals, organic matter and air in the soil.</p> <div class="wp-caption aligncenter" id="attachment_202" aria-describedby="caption-attachment-202" style="width: 360px"><a href="http://opentextbc.ca/geography/wp-content/uploads/sites/34/2014/06/Soil_sci.jpg" data-url="http://opentextbc.ca/geography/wp-content/uploads/sites/34/2014/06/Soil_sci.jpg"><img class="size-full wp-image-202" alt="Figure 1. Soil examined from a scar made by excavator." src="http://opentextbc.ca/geography/wp-content/uploads/sites/34/2014/06/Soil_sci.jpg" height="458" width="360" srcset="https://opentextbc.ca/geography/wp-content/uploads/sites/34/2014/06/Soil_sci.jpg 360w, https://opentextbc.ca/geography/wp-content/uploads/sites/34/2014/06/Soil_sci-235x300.jpg 235w, https://opentextbc.ca/geography/wp-content/uploads/sites/34/2014/06/Soil_sci-65x82.jpg 65w, https://opentextbc.ca/geography/wp-content/uploads/sites/34/2014/06/Soil_sci-225x286.jpg 225w, https://opentextbc.ca/geography/wp-content/uploads/sites/34/2014/06/Soil_sci-350x445.jpg 350w" sizes="auto, (max-width: 360px) 100vw, 360px" title="" /></a><div class="wp-caption-text" id="caption-attachment-202">Figure 1. Soil examined from a scar made by excavator.</div></div> <div class="textbox shaded">For further readings and additional activities, check Virtual soil science learning resources and lab (<a href="http://soilweb.landfood.ubc.ca/promo/" target="_blank" data-url="http://soilweb.landfood.ubc.ca/promo/">http://soilweb.landfood.ubc.ca/promo/</a> Soil testing methods. <a href="http://soiltest.cfans.umn.edu/our-methods/" target="_blank" data-url="http://soiltest.cfans.umn.edu/our-methods/">http://soiltest.cfans.umn.edu/our-methods</a> , and Soil sampling and methods of analysis book. <a href="http://www.planta.cn/forum/files_planta/methods_of_analysis_212.pdf" target="_blank" data-url="http://www.planta.cn/forum/files_planta/methods_of_analysis_212.pdf">http://www.planta.cn/forum/files_planta/methods_of_analysis_212.pdf </a>You can also check out these suggested textbooks; <em>Soil Science And Management</em>. 2008. Plaster. E., Delmar Publishers Inc. and <em>Elements of the Nature and Properties of Soils</em>. 2009. Brady. N. C. and Weil. R. R. Pearson.</div> <h2>Hydrology&nbsp;Research Methods</h2> <p>Hydrology is the study of the movement, distribution and quality of water on Earth and other planets, including the hydrologic cycle, water resources and environmental watershed sustainability. A practitioner of hydrology is a hydrologist, working within the fields of earth or environmental science, physical geography, geology or civil and environmental engineering. Hydrogogy research makes extensive use of modelling to create conceptual representations of the different parts of the hydrologic cycle.</p> <div class="textbox shaded">For more information on hydrology and the types of models used in hydrology, refer to <em>Hydrology: An Introduction</em>. 2005. Brutsaert. W., Cambridge University Press,<em>Fundamentals of Hydrology</em>. 2008. Davie. T. and Quinn N. Routledge, and <em>Hydrology.</em> 2013. Das M. M. and Saikia M. D. PHI Learning Private Limited.</div> <h2>Climatology</h2> <p>Climatology is the study of climate, scientifically defined as weather conditions averaged over a period of time. Weather monitoring stations collect information for decades about temperature; wind velocity and direction; moisture concentration in the air; and precipitation, and indicate a specific climatic condition at a specific part of Earth.</p> <div class="textbox shaded">Suggested textbooks and resources for more information on climatology <em>Climatology.</em> 2013. Rohli. R. V. Vega. A. J. Jones &amp; Bartlett Learning, <em>Climatology:</em> An Atmospheric Science. 2009. Hidore. J. J. Oliver. J. E. Snow M. Snow R, the <em>Encyclopedia of world climatology</em>. 2005. Edited by Oliver. J. E. Springer.</div> <h2>Statistics in Geography</h2> <p>Statistical techniques and procedures are applied in all fields of academic research; wherever data are collected and summarized or wherever any numerical information is analyzed or research is conducted, statistics are needed for sound analysis and interpretation of results.</p> <p>Geographers use statistics in numerous ways:</p> <ul><li>To describe and summarize spatial data</li> <li>To make generalizations concerning complex spatial patterns</li> <li>To estimate the probability of outcomes for an event at a given location</li> <li>To use samples of geographic data to infer characteristics for a larger set of geographic data (population)</li> <li>To determine if the magnitude or frequency of some phenomenon differs from one location to another</li> <li>To learn whether an actual spatial pattern matches some expected pattern</li> </ul> <div class="textbox shaded">For additional information about statistics methods&nbsp;in geography, see <em>Statistical Methods for Geography: A Student’s Guide</em>. 2012. Rogerson. P. A. SAGE Publications Ltd.</div> <h2>Attributions</h2> <ul><li><strong>Figure 1.</strong> Soil examined from a scar made by excavator. Source: Soil Sci by Paleorthid (<a href="http://en.wikipedia.org/wiki/File:Soil_sci.jpg" data-url="http://en.wikipedia.org/wiki/File:Soil_sci.jpg">http://en.wikipedia.org/wiki/File:Soil_sci.jpg</a>) is in the public domain</li> </ul> 
	</div>


	</div>
<div class="back-matter appendix with-subsections" id="back-matter-statistical-geography" title="Statistical Geography">
	<div class="back-matter-title-wrap">
		<p class="back-matter-number">4</p>
		<h1 class="back-matter-title">Statistical Geography</h1>
								</div>
	<div class="ugc back-matter-ugc">
				
 <h1 id="back-matter-209-section-1" class="section-header">Statistical Geography</h1> <p><span style="background-color: #ffff00">(compiled from wikipedia)</span></p> <p>Statistical geography is the study and practice of collecting, analyzing and presenting data that has a geographic or area dimension, such as census or demographics data. It uses techniques from spatial analysis, but also encompasses geographical activities such as the defining and naming of geographical regions for statistical purposes. For example, for the purposes of statistical geography, the Australian Bureau of Statistics uses the Australian Standard Geographical Classification, a hierarchical regionalization that divides Australia up into states and territories, then statistical divisions, statistical subdivisions, statistical local areas and, finally, census collection districts.</p> <p>Geographers study how and why elements differ from place to place, as well as how spatial patterns change through time. Geographers begin with the question “Where?” to explore&nbsp;how features are distributed on a physical or cultural landscape, observing spatial patterns and the variation of phenomena. Contemporary geographical analysis has shifted to “Why?” to&nbsp;determine&nbsp;why a specific spatial pattern exists, what spatial or ecological processes may have affected a pattern, and why such processes operate. Only by approaching the “why”&nbsp;questions can social scientists begin to appreciate the mechanisms of change, which are infinite in their complexity.</p> <h3>Spatial Data and Descriptive Statistics</h3> <p>There are several potential difficulties associated with the analysis of spatial data. Among these are boundary delineation, modifiable areal units, and the level of spatial aggregation or scale. In each of these cases, the absolute descriptive statistics of an area (the mean, median, mode, standard deviation, and variation)&nbsp;are changed through the manipulation of these spatial problems.</p> <h3>Boundary Delineation</h3> <p>The location of a study area boundary and the positioning of internal boundaries affect various descriptive statistics. With respect to measures such as the mean or standard deviation, the study area size alone may have large implications. Consider a study of per capita income within a city:&nbsp;if confined to the inner city, income levels are likely to be lower because of a less affluent population, but if expanded to include the suburbs or surrounding communities, income levels will become greater with the influence of homeowner populations. Because of this problem, absolute descriptive statistics such as the mean, standard deviation and variance should be evaluated comparatively only in relation to a particular study area. In the determination of internal boundaries this is also true, as these statistics may only have valid interpretations for the area and subarea configuration over which they are calculated.</p> <h3>Spatial Aggregation/Scale Problem</h3> <p>Socio-economic data may be available at a variety of scales, such as&nbsp;municipalities, regional districts, census tracts, enumeration districts or at the provincial level. When these data are aggregated at different scales, the resulting descriptive statistics may exhibit variations, either in a systematic, predictable way, or in a more uncertain fashion.</p> <h3>Descriptive Spatial Statistics</h3> <p>For summarizing point pattern analysis, a set of descriptive spatial statistics has been developed that are areal equivalents to nonspatial measures. Since geographers are particularly concerned with the analysis of locational data, these descriptive spatial statistics (geostatistics) are often applied to summarize point patterns and to describe the degree of spatial variability of some phenomena.</p> <h3>Spatial Measures of Central Tendency</h3> <p>An example is the idea of a centre of population, of which a particular example is the mean centre of the BC population. Several different ways of defining a centre are available:</p> <ul><li>Mean centre: The mean is an important measure of central tendency, which when extended to a set of points, located on a Cartesian coordinate system, the average location, centroid or mean centre, can be determined.</li> <li>The weighted mean centre is analogous to frequencies in the calculation of grouped statistics, such as the weighted mean. A point may represent a retail outlet, while its frequency will represent the volume of sales within the particular store.</li> <li>The median centre or Euclidean centre and in the median centre of BC population.</li> </ul> <h3>Topology</h3> <p>The motivating insight behind topology is that some geometric problems depend not on the exact shape of the objects involved, but rather on the way they are connected. One of the first papers in topology was the demonstration, by Leonhard Euler, that it was impossible to find a route through the town of Königsberg (now Kaliningrad) that would cross each of its seven bridges exactly once. This result did not depend on the lengths of the bridges&nbsp;or on their distance from one another, but only on connectivity properties: which bridges are connected to which islands or riverbanks. Known as the Seven Bridges of Königsberg, this is now a famous problem in introductory mathematics, and it led to the branch of mathematics known as graph theory.</p> <div class="wp-caption alignnone" style="width: 302px"><img width="302" height="238" src="http://opentextbc.ca/geography/wp-content/uploads/sites/34/2014/06/Konigsberg_bridges.png" alt="" title="" /><div class="wp-caption-text">Figure 1. Map of Königsberg in Euler’s time showing the actual layout of the seven bridges, highlighting the river Pregel and the bridges. Source:&nbsp;Konigsberg bridges by&nbsp;Bogdan Giuşcă (http://creativecommons.org/licenses/by-sa/3.0/deed.en) licensed under CC BY SA 3.0 (http://creativecommons.org/licenses/by-sa/3.0/deed.en)</div></div> <h3></h3> <p>Topology rules are particularly important within GIS, and are used for a variety of correction and analytical procedures. The primary shapes in GIS are the point, line and polygon, each of which implies different spatial characteristics; for instance, the only shape that&nbsp;has a distinguishable inside and outside is the polygon. Principles of connectivity associated with topology lead to applications in hydrology, urban planning, logistics and&nbsp;other fields.&nbsp;Topological analyses offer unique modelling capabilities, defining the vector nature of topological features and correcting spatial data errors from digitizing.</p> <p><span style="background-color: #ffff00">Parts of this text have been modified from&nbsp;http://en.wikipedia.org/wiki/Statistical_geography</span></p> <p>&nbsp;</p> <p>Statistics.</p> <p>Further readings and additional activities.</p> <p>Suggested textbooks.</p> <p>Understanding Basic Statistics. 2012. Brase. C. H. and Brase. C. P. Brooks Cole.</p> <p>Basic Statistics: An Introduction with R. 2012. R. Tenko. Marcoulides G. A. Rowman &amp; Littlefield Publishers.</p> <p>Lectures of compete statistics course.</p> <p>https://www.youtube.com/watch?v=CWrgEjXGzfg&amp;list=PL02A86BB93BE23D65&amp;index=1</p> <p>Source: coursera.org (https://www.youtube.com/watch?v=CWrgEjXGzfg&amp;list=PL02A86BB93BE23D65&amp;index=1)</p> <p>&nbsp;</p> <p>&nbsp;</p> 

	</div>


	</div>
<div class="back-matter appendix " id="back-matter-how-to-find-research-literature" title="How to Find Research Literature">
	<div class="back-matter-title-wrap">
		<p class="back-matter-number">5</p>
		<h1 class="back-matter-title">How to Find Research Literature</h1>
								</div>
	<div class="ugc back-matter-ugc">
				 <p>&nbsp;</p> <h2>Understanding Your Assignment Requirements</h2> <p>The first thing you need to do when you are about to start working on an assignment is read the question very carefully. This might sound obvious, but many students lose marks unnecessarily because they don’t pay enough attention to what the assignment question is asking them to do. To get the maximum marks for the effort you put in, you need to answer the question that is asked. As well as reading the question you also need to analyze it. Assignment questions usually have a lot of information in them and you can use this information to help you with your answer. The information in this guide will help you to interpret what your assignment questions are asking you to do.</p> <h3>Content Words</h3> <p>Assignment questions usually have quite a lot of information in them about both what you need to be writing about and how you should structure your assignment. The words that tell you the topic of what the assignment should be about are commonly called “content words.”</p> <p>For example, the content words for the following assignment are bolded:</p> <p style="margin-left: 40px">Traditionally in many societies mothers are expected to stay at home and take care of their children. However, the financial pressures of modern life have forced many <strong class="Bold"><em class="Italic">mothers</em></strong> to find <strong class="Bold"><em class="Italic">jobs</em></strong> outside the home and rely on <em class="Italic"><strong class="Bold">childcare for their children.</strong></em> With reference to one particular type of childcare facility discuss whether this arrangement is damaging for children or not.</p> <p>These words tell you that the content of your assignment should relate to the effect of working mothers placing their children in childcare. Sometimes you will not be given any content words and you will be required to develop your own research question. We will discuss this later in this module.</p> <h3>Instruction Words</h3> <p>The words that tell you how to go about answering the question are commonly called <strong class="Bold">instruction words</strong>. Instruction words <strong class="Bold">tell you how</strong>.</p> <p>The <strong class="Bold">instruction words</strong> give you information on what type of assignment you need to write. For example, are you being asked to discuss, argue, describe, explain, report or compare and contrast? Each of these instruction words tells you that you need to write a different type of response to the question. For example, in a description you are asked to focus on what something is like or what happened. On the other hand, if you are asked to explain, you will need to focus on how something happens or happened.</p> <p>The following is a brief outline of instruction words you may find in your assignment. You need to understand the instruction words to satisfy the requirements of your assignment.</p> <table style="width: 700px; border-spacing: 1px;" cellpadding="1"><thead><tr><th scope="col">Instruction Words</th> <th scope="col">What They Mean</th> </tr> </thead> <tbody><tr><td>Analyze</td> <td>Examine in close detail. Identify important points and chief features.</td> </tr> <tr><td>Comment on</td> <td>Identify and write about the main issues. Base what you write on what you have read or heard in lectures. Avoid purely personal opinion.</td> </tr> <tr><td>Compare</td> <td>Show how two or more things are similar. Indicate the relevance or consequences of these similarities.</td> </tr> <tr><td>Contrast</td> <td>The opposite of compare. Point out what is different. Indicate whether or not the differences are significant. If appropriate, give reasons why one item or argument might be preferable.</td> </tr> <tr><td>Critically evaluate</td> <td>Examine arguments for and against something, assessing the strength of the evidence on both sides. Use your research to guide your assessment of which opinions, theories, models or items are preferable.</td> </tr> <tr><td>Discuss</td> <td>Similar to critically evaluate. Give arguments and evidence for and against something and make some judgment.</td> </tr> <tr><td>Summarise</td> <td>Similar to outline. Draw out the main points only. Leave out details or examples.</td> </tr> <tr><td>To what extent</td> <td>Consider how far or how much something is true, or contributes to a final outcome. The answer is usually somewhere between “completely” and “not at all.” Follow the order of different stages in an event or process.</td> </tr> </tbody> </table> <p>For additional content words, look at the follow Common Instruction Words list from Southern Cross University at http://www.scu.edu.au/teachinglearning/download.php?doc_id=12754&amp;site_id=301&amp;file_ext=.pdf</p> <p>To learn to read your assignment question for both content and instruction, watch the following video from the UNC Writing Center at http://youtu.be/KDBwh47nmiY</p> <h2>Developing a Research Topic</h2> <p>Developing a research topic is often the most difficult part of completing an assignment. It requires a lot of thought and time. To learn some tips about developing a research topic, watch the following video from UBC Library at <a href="http://youtu.be/dGdfnc7VBN4" data-url="http://youtu.be/dGdfnc7VBN4">http://youtu.be/dGdfnc7VBN4</a></p> <h3>Making Your Topic Searchable</h3> <p>Once you have a research topic, you need to take the time to make the topic searchable. With Google you could simply type the entire question in the search box, but you would retrieve millions of results. To develop a more specific search, here are some tips which will help make the process of searching simpler, faster and bring up more relevant results lists.</p> <h3>Choosing Keywords</h3> <p>Knowing how to find what you need in library resources is a powerful research skill and the keywords you use are a huge part of the success or failure of your search. Keywords, or search words, are words or short phrases that represent the main ideas or concepts in your topic. For example, look a the following topic:</p> <p><em class="Italic">Do the cost of parking spots increase demand for public transit?</em></p> <p>The keywords for this topic are: <strong>“cost,”</strong> “<strong class="Bold">parking” </strong>and <strong class="Bold">“public transit</strong><strong>.”</strong></p> <p>Once you have your keywords, you are ready to begin your search.</p> <h3>
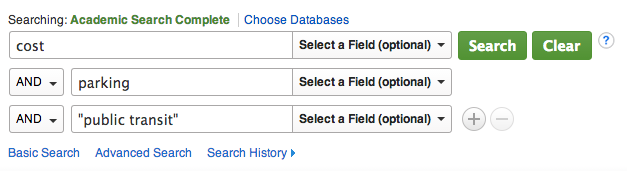
Putting the Keywords Together</h3> <p>Some library resources will need you to develop searches differently. Look at the example below. In Google&nbsp;you can search by putting all the keywords in one line, but some library databases such as&nbsp;Academic Search Complete require&nbsp;you to use AND between the keywords.</p> <p><img alt="" src="http://opentextbc.ca/geography/wp-content/uploads/sites/34/2014/06/Screen_Shot_2014-06-12_at_4.17_.59_PM_.png" title="" /></p> <h3>
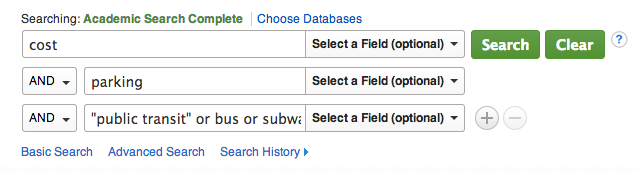
The Power of Synonyms</h3> <p>Include <strong class="Bold">synonyms</strong> in your search whenever possible. Databases only bring back results that&nbsp;contain the exact words you type in. If you don’t include <strong class="Bold">synonyms,</strong> you could miss a great deal of relevant material.</p> <p>For example, if you are researching a public transit-related topic you may think of the following alternate words to use in your search:</p> <p>e.g. “public transit” OR bus OR subway OR train</p> <p><img alt="" src="http://opentextbc.ca/geography/wp-content/uploads/sites/34/2014/06/Screen_Shot_2014-06-12_at_4.21_.07_PM_.png" title="" /></p> <h2>How to Use the Library</h2> <h3>Recognizing Different Types of Citations</h3> <p>A bibliographic citation is a reference that points toward a specific source of information. Citations can refer to a wide variety of published or unpublished works, such as books, journal articles, dissertations and films. A complete citation provides all the pieces of information that you need to track down a source that has been referenced in a paper or been assigned as part of your class readings.</p> <p>It is important to be able to recognize what citations look like for various types of information sources (e.g., books or journal articles), because you need to use different strategies to locate different kinds of materials. You can identify common types of citations by the information elements that they contain. While some elements are common to most citations (such as the author/creator of the work and the date of publication), other elements provide clues about the kind of information source that is being cited.</p> <p>Each type of citation can be formatted in different ways, depending on which citation style is being used.</p> <p><strong class="Bold">Books</strong></p> <p>McGillivray, B. 2011, <em class="Italic">Geography of British Columbia: people and landscapes in transition</em>, UBC Press, Vancouver.</p> <p>Citation Elements/Item Details</p> <table style="width: 500px; border-spacing: 1px;" cellpadding="1"><tbody><tr><td>Author</td> <td>McGillivray, B.</td> </tr> <tr><td>Year</td> <td>2011</td> </tr> <tr><td>Title</td> <td>Geography of British Columbia: people and landscapes in transition</td> </tr> <tr><td>Publisher</td> <td>UBC Press</td> </tr> <tr><td>Location</td> <td>Vancouver</td> </tr> </tbody> </table> <p>Distinguishing Features</p> <ul><li>Only one title appears in the citation.</li> <li>The citation includes the place of publication and the publisher’s name.</li> </ul> <p><strong class="Bold">Book Chapters</strong></p> <p>This type of citation includes all of the elements of a regular book citation, along with a few additional pieces of information. Individual chapters are usually cited when they form part of an edited collection, which contains chapters or essays contributed by several different authors.</p> <p>Halseth, G. 2009, “Understanding and transforming a staplesbased economy: place-based development in Northern British Columbia, Canada” in Halseth, G., Markey, S. &amp; Bruce, D. (eds),&nbsp;<em class="Italic">The next rural economies: constructing rural place in global economies,</em> CAB International, Wallingford, UK, pp. 251-262.</p> <p>Citation Elements/Item Details</p> <table style="width: 500px; border-spacing: 1px;" cellpadding="1"><tbody><tr><td>Author</td> <td>Halseth, G.</td> </tr> <tr><td>Year</td> <td>2009</td> </tr> <tr><td>Book Chapter</td> <td>Understanding and transforming a staplesbased economy: place-based development in Northern British Columbia, Canada</td> </tr> <tr><td>Book Editors</td> <td>Halseth, G., Markey, S. &amp; Bruce, D.</td> </tr> <tr><td>Book Title</td> <td>The next rural economies: constructing rural place in global economies</td> </tr> <tr><td>Publisher</td> <td>CAB International</td> </tr> <tr><td>Location</td> <td>Wallingford, UK</td> </tr> <tr><td>Page Range</td> <td>251-262</td> </tr> </tbody> </table> <p><strong class="Bold">Distinguishing Features</strong></p> <ul><li>The citation includes two titles: the title of the individual chapter and the title of the book in which it is published.</li> <li>The place of publication and publisher name indicate that the item is part of a book.</li> <li>Information about the editor(s) is given. (Note that regular book citations can also contain this element, so you need to confirm other features of a book chapter citation.)</li> <li>The citation contains the page number range for the chapter.</li> </ul> <p><strong class="Bold">Locating Books in Your Library</strong></p> <p>Sometimes in your research you will come across a book that you would like to locate in the library.&nbsp;Visit your university library website and use the library search. Many libraries may have a search engine that locates books together with other library resources such as journal articles. If you want to limit your search to books look for a search tab labelled “Catalogue” or “Books and Media.” The catalogue only searches items in the library’s collection.</p> <p>Let’s look at a book citation example:</p> <p>Bone, R.M. 2005, <em class="Italic">The regional geography of Canada</em>, Oxford University Press, Don Mills, Ont.</p> <p>To search for this book, you need to first identify the book title:</p> <p>Bone, R.M. 2005, <em class="Italic"><strong class="Bold">The regional geography of Canada</strong></em>, Oxford University Press, Don Mills, Ont.</p> <p>Now you are ready to find the book using your library catalogue.</p> <p>Once you locate a book, you will need to use the <strong class="Bold">call number </strong>to find the book on the library shelf. This resource guide will help you read a call number.</p> <p>http://wiki.ubc.ca/Library:Module_3_Reading_a_Record_3.3</p> <p><strong class="Bold">Journal Articles</strong></p> <p>At first glance, journal article citations can look very similar to book chapter citations. In particular, journal article citations also contain two titles: the title of the article and the title of the journal. However, different publication information is given for a journal article.</p> <p>Citation Elements/Item Details</p> <p>Hiebert, D. 1999, “Local Geographies of Labor Market Segmentation: Montréal, Toronto, and Vancouver, 1991”, <em class="Italic">Economic Geography</em>, vol. 75, no. 4, pp. 339-369.</p> <table style="width: 500px; border-spacing: 1px;" cellpadding="1"><tbody><tr><td><strong class="Bold">Citation Elements</strong></td> <td><strong class="Bold">Item Details</strong></td> </tr> <tr><td>Author</td> <td>Hiebert, D.</td> </tr> <tr><td>Year</td> <td>1999</td> </tr> <tr><td>Article Title</td> <td>Local Geographies of Labor Market Segmentation: Montréal, Toronto, and Vancouver, 1991</td> </tr> <tr><td>Journal Title</td> <td>Economic Geography</td> </tr> <tr><td>Volume and Issue</td> <td>vol. 75, no. 4, pp</td> </tr> <tr><td>Page Range</td> <td>339-369</td> </tr> </tbody> </table> <p><strong class="Bold">Distinguishing Features</strong></p> <ul><li>The citation includes two titles: the title of the individual article and the title of the journal in which it is published.</li> <li>No place of publication or publisher’s name is given.</li> <li>Instead, the citation specifies the exact volume and issue of the journal that is being referenced.</li> </ul> <p><strong class="Bold">Locating Articles in Your Library</strong></p> <p>Sometimes in your research you will come across an article that you would like to locate in the library. If you have the article citation it is simple to use a general library search engine. If your library does not have a general search engine, you can search by journal title and then locate the volume and pages for your article. You can also check your library to see if it has&nbsp;a research guide for geography with links to core and specialized search databases for your discipline.</p> <p>Let’s look at our previous journal article citation example:</p> <p>Hiebert, D. 1999, “Local Geographies of Labor Market Segmentation: Montréal, Toronto, and Vancouver, 1991”, <em class="Italic">Economic Geography</em>, vol. 75, no. 4, pp. 339-369.</p> <p>To search for this specific article in a library search engine or database, we need to first identify the article title and the last name of the author:</p> <p><strong class="Bold">Hiebert</strong>, D. 1999, “<strong class="Bold">Local Geographies of Labor Market Segmentation</strong>: Montréal, Toronto, and Vancouver, 1991″, <em class="Italic">Economic Geography</em>, vol. 75, no. 4, pp. 339-369.</p> <p>Sometimes article titles are very similar and it is difficult to find the exact article you are looking for by a specific author. To deal with this problem, search for the author’s last name and the title of the article:</p> <p><strong class="Bold">Things to note:</strong></p> <ul><li>We left out the remaining article title after the colon (i.e., Montréal, Toronto, and Vancouver, 1991). Often you will not need to use the full title to find the article. Additionally, punctuation marks, such as colons, periods, semicolons and quotes, can confuse the search.&nbsp;Leave punctuation out of your title search.</li> <li>We are not using capital letters. Capital letters are not important in your search. You can either choose to use capitals or not.</li> <li>We are using quotation marks around the title (i.e. “Local Geographies of Labor Market Segmentation”). Quotation marks will instruct library databases to search for the words in between the quotations as a phrase. This is important to remember. If you searched without the quotation marks, Summon would search for each word separately. This will give you far too many search results to look through to find your article.</li> </ul> <p>http://help.library.ubc.ca/planning-your-research/tutorials/basic-library-tutorials/basic-library-skills-tutorial/</p> <h2>How Reliable Are Your Resources?</h2> <p>You will need to evaluate each resource you use for research, whether it is an online or print journal article, a website, a book, a newspaper article, or other source that you want to cite. Use the questions in this guide to analyze materials and to assess how appropriate they will be for your research. Keep in mind that many publications have a particular bias or agenda, which may not be obvious at first.</p> <p>Don’t expect to be able to answer every question, all the time, for all information resources you look at. Rather, examine the following criteria and&nbsp;try to use the questions a tool to help you look at sources critically.</p> <h3>Authority</h3> <p>It seems obvious to state that no one is an expert at everything, but it’s easy to overlook an author’s credentials, especially when reading something online.</p> <ul><li>Some authors write to share the results of their research with other scholars.</li> <li>Some are hired to produce articles for the general public.</li> <li>Some are passionate amateurs.</li> <li>Some publish fabricated or unproven research for a variety of reasons.</li> </ul> <p>Anyone with an Internet connection has the potential to publish and distribute information. It’s up to you to assess whether or not the materials you find have been written by an authority on the subject.</p> <h3>Authorship</h3> <ul><li>Is there an author of the work? If so, is the author clearly identified?</li> <li>Are the author’s credentials for writing on this topic stated? For instance, journal articles often list the university or organization the authors are affiliated with.</li> <li>If the author is affiliated with an organization, could this organization have a bias?</li> <li>Have you seen the author’s name cited in other sources or bibliographies? Repeated citations by others and a substantial body of work by the author can indicate expertise.</li> <li>Does the source represent a group, organization, institution, corporation or government body?</li> <li>For online sources, is there a way to contact the author and/or organization?</li> </ul> <h3>Why Question the Author or Source?</h3> <p>If you cannot find an author or an organization connected to a source, be very suspicious. If no one wants to stand behind the work, why should you believe what is written there? Even if you can find an organization or author you still need to be cautious and make sure that the organization and/or author are who they say they are. This may include further research on a particular author or organization. The website alexa.com lets you check ownership of a website and find out what other sites link to it. Also, note that even if an author is an expert in one field, she or he may not have expertise in another field.</p> <h3>Scholarly or Not?</h3> <p>Some materials that you find will be written by academics, for an academic audience,&nbsp;and their authority, accuracy and scope will be relatively easy to analyze. Other&nbsp;material&nbsp;will be written for a general audience,&nbsp;with qualities that are equally easy to assess.</p> <p>Unfortunately, you will also easily find materials that are trickier to categorize, such as:</p> <ul><li>Work by scholars that has been adapted and simplified for a general audience</li> <li>Promotional articles written for professionals in the field</li> <li>Articles written by journalists</li> <li>Theses and&nbsp; dissertations</li> <li>Work published by groups with a well-known political bias</li> <li>Government reports, briefing notes and documents written for the general public</li> <li>Work from experts commenting outside their areas of expertise</li> </ul> <p>In fact, many of the sources that come up in a typical results list are not scholarly,&nbsp;and you won’t be able to use them if your assignment specifies “scholarly sources only.”</p> <p>For more detailed tips and suggestions to help you distinguish between scholarly and non-scholarly work consult this guide:&nbsp;<em class="Italic">Insert hyperlink?</em> http://help.library.ubc.ca/evaluating-and-citing-sources/scholarly-versus-popular-sources/</p> <h3>Accuracy</h3> <ul><li>Is the source part of an edited or peer-reviewed publication?</li> <li>Can factual information be verified through references to other credible sources?</li> <li>Based on what you already know about the subject, or have checked from other sources, does this information seem credible?</li> <li>Is it clear who has the responsibility for the accuracy of the information presented? Is it on a site like Wikipedia, which can be edited by anyone?</li> <li>
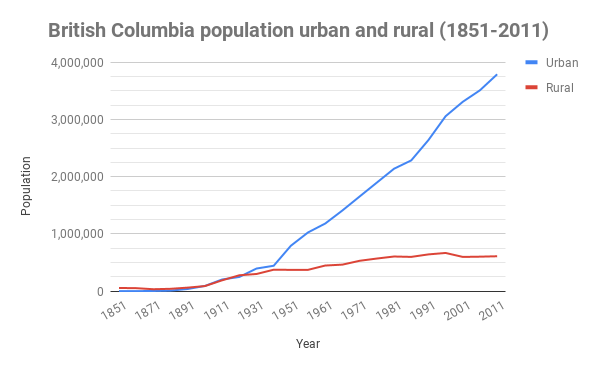
If data are presented in graphs or charts, is the source of the data clear?</li> </ul> <p><em class="Italic">Interactivity?&nbsp;</em>Look at the NIPCC website (http://nipccreport.org/)&nbsp;and ask yourself if the information seems credible and accurate.</p> <h3>Why Question the Accuracy of a Source?</h3> <p>In the scholarly publication process,&nbsp;journal articles must be peer reviewed. This means that&nbsp;when an author submits an article an editor can assign it to two or three, sometimes as many as four, independent referees, who have similar expertise to the author. The referees review the article and write reports that recommend acceptance, acceptance with minor changes, acceptance with major changes or rejection. Acceptance rates vary depending on the prestige of the journal, and the entire process can take up to a year.</p> <p>When you search the Web, you will usually find a combination of online scholarly journal articles (many provided to you by your library) and other websites. While individual websites may be written by experts and have some sort of editing process in place, there is no overall system for vetting the web. This lack of review and revision process means that not all Web pages are reliable or valuable. Documents can easily be copied and falsified, or copied with omissions and errors,&nbsp;intentional or accidental.</p> <p>Data presented in a source may be original work by the author or may be taken from another source. Just because data are&nbsp;presented in an attractive graph or chart&nbsp;doesn’t guarantee accuracy.&nbsp;(For more information on good and bad graphs, see Gallery of Data Visualization.&nbsp;<em class="Italic">Insert Hyperlink&nbsp;</em>http://www.datavis.ca/gallery)</p> <h3>Currency</h3> <ul><li>Is there a date stating when the document was originally created?</li> <li>Is it clear when the source was last updated, revised or edited?</li> <li>Are there any indications that the material is updated frequently or consistently to ensure currency of the content?</li> <li>If online, are any links to other websites current?</li> </ul> <h3>Why Question the Currency of a Source?</h3> <p>Currency of information is particularly important in the sciences as findings can change drastically in short periods of time. The&nbsp;currency of a source&nbsp;is relevant because you want to know that the information is updated or revised if necessary. On the other hand, some sources may remain authoritative even though they are older. Some older sources are “seminal works,” and&nbsp;represent the starting point of a new discipline, or the jumping off point of a new way of looking at a problem. An example is Harvey, D. 1974, “Population, resources, and the ideology of science,” <em class="Italic">Economic geography</em>, vol. 50, no. 3, pp. 256-277.</p> <h3>Objectivity</h3> <ul><li>Is the page free of advertising? If the page does contain advertising, are the ads clearly separated from the content?</li> <li>Does the page display a particular bias or perspective? Or is the information presented factually, without bias?</li> <li>Is it clear and forthcoming about its view of the subject?</li> <li>Does it use inflammatory or provocative language?</li> </ul> <p>&nbsp;</p> <p><strong>Why Question the Objectivity of a Web Page?</strong></p> <p>If advertisements are present, look for a relationship between the content of the page and the advertising. Are the advertising and content connected? Ask yourself if the sponsors of the advertisements could have sponsored the research reported.</p> <p>For example, suppose you find a Web page about a vitamin supplement and the page has advertisements flashing over it, selling the same health supplement. Be cautious and skeptical that the content of the page is without bias. Make sure that the information is factual, not just testimonials of “satisfied customers.”</p> <p>Check other sources to verify the information. Look closely at how information is presented. Are opinions clearly stated, or is the information vague? It is acceptable for a page to present a biased opinion, but you as the consumer of the information should know what that opinion is. It should be clear, not hidden.</p> <h3>Coverage</h3> <ul><li>Does the source update other works, support other works you’ve read, or add new information?</li> <li>Does the source cover the topic comprehensively, or does it only cover one aspect? Make sure to analyze enough sources to obtain a range of viewpoints on all facets of the topic.</li> <li>For books, a table of contents and index can be helpful in assessing the coverage of the work.</li> <li>For online sources, is the site complete or still under construction? Does the source seem stable, or is it likely to change much between the time you read it and the time your research is finished?</li> <li>For online sources, if there is a print equivalent to the website? Is there clear indication of whether the entire work or only a portion is available online?</li> </ul> <p>&nbsp;</p> <p><strong>Why Question the Coverage of a Source?</strong></p> <ul><li>Be wary of sites like wikis whose content may change rapidly and dramatically. If you are looking at a website for which there is a print equivalent, check to see if the entire work is online. If it is a portion of the work make sure that quotes have not been taken out of context or information has not been misrepresented.</li> </ul> <h3>Purpose and Audience</h3> <ul><li>Why was the source created?&nbsp;To educate? Sell a product? Advocate a viewpoint?</li> <li>Is the publication aimed at a general or a specialized audience?</li> <li>Is the source too elementary, too technical, too advanced, or just right for your research needs?</li> <li>Which parts of the information presented are fact and which are opinion?</li> </ul> <p>&nbsp;</p> <p><strong>Why Question the Purpose and Audience of a Source?</strong></p> <p>You want to ensure your sources are at the appropriate level for your research, and distinguish between facts and opinions. What is the difference between fact and opinion? Facts are usually verifiable. Opinions may be based on factual information, but evolve from the interpretation of facts. Most scholarly work will contain both; for example, scientists develop interpretations of data from several points of view successively in their writing. Each point of view expresses the implications of a different assumption. Think of these writings as the interpretations themselves (i.e., a record of the process of interpreting). That record of process is extremely valuable to you when you find and recognize it because it gives you models for your own thoughts (either to emulate or avoid).</p> <h3>What are Primary Sources?</h3> <p>In the social sciences, a primary source can be defined the same way that it is in the humanities;&nbsp;that is to say it is “something that was created either during the time period being studied or afterward by individuals reflecting on their involvement in the events of that time.” In addition, empirical studies – and the journal articles that&nbsp;report those studies — as well as numerical data that have been&nbsp;been gathered to analyze relationships between people, events and their environment are primary sources for social scientists.</p> <p>Some primary source formats for social science research&nbsp;include:</p> <ul><li>
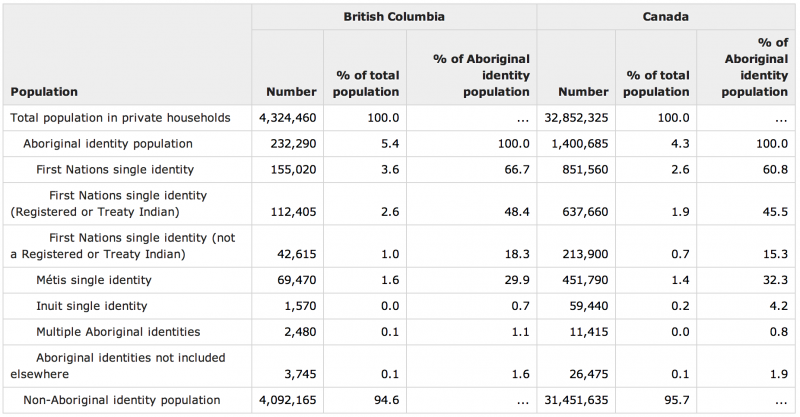
Numerical data, statistics, census figures</li> <li>Surveys, opinion polls, interview transcripts</li> <li>Journal articles&nbsp;reporting on studies</li> <li>Artifacts from the time under study (e.g., tools, fossils, coins, pottery, clothing, plant/animal specimens,)</li> <li>Oral histories</li> <li>Case studies, reports</li> <li>Field notes</li> </ul> <h2><strong class="Bold">Credit</strong></h2> <p>This information&nbsp;was adapted with permission from the following two guides at the University of British Columbia:</p> <ul><li>Basic Library Tutorials <a href="http://help.library.ubc.ca/planning-your-research/tutorials/basic-library-tutorials/" data-url="http://help.library.ubc.ca/planning-your-research/tutorials/basic-library-tutorials/">http://help.library.ubc.ca/planning-your-research/tutorials/basic-library-tutorials/</a></li> <li>Evaluating Information Sources <a href="http://help.library.ubc.ca/evaluating-and-citing-sources/evaluating-information-sources/" data-url="http://help.library.ubc.ca/evaluating-and-citing-sources/evaluating-information-sources/">http://help.library.ubc.ca/evaluating-and-citing-sources/evaluating-information-sources/</a></li> </ul> <p>License: http://creativecommons.org/licenses/by-nc-sa/4.0/</p> <h2>Additional Resources</h2> <h3>British Columbia Post-Secondary Library Geography Research Guides (openly&nbsp;accessible)</h3> <ul><li>University of the Fraser Valley <a href="http://libguides.ufv.ca/cat.php?cid=13378" data-url="http://libguides.ufv.ca/cat.php?cid=13378">http://libguides.ufv.ca/cat.php?cid=13378</a></li> <li>Northern Lights College <a href="//libguides.nlc.bc.ca/content.php?pid=166967&amp;sid=1407120" data-url="//libguides.nlc.bc.ca/content.php?pid=166967&amp;sid=1407120">http://libguides.nlc.bc.ca/content.php?pid=166967&amp;sid=1407120</a></li> <li>University of Northern <a href="//libguides.unbc.ca/cat.php?cid=19758" data-url="//libguides.unbc.ca/cat.php?cid=19758">British Columbia http://libguides.unbc.ca/cat.php?cid=19758</a></li> <li>Thompson Rivers University <a href="http://libguides.tru.ca/cat.php?cid=426" data-url="http://libguides.tru.ca/cat.php?cid=426">http://libguides.tru.ca/cat.php?cid=426</a></li> <li>Okanagan College <a href="http://libguides.okanagan.bc.ca/Geography" data-url="http://libguides.okanagan.bc.ca/Geography">http://libguides.okanagan.bc.ca/Geography</a></li> <li>Camosun College <a href="http://camosun.ca.libguides.com/content.php?pid=199471&amp;sid=1931665" data-url="http://camosun.ca.libguides.com/content.php?pid=199471&amp;sid=1931665">http://camosun.ca.libguides.com/content.php?pid=199471&amp;sid=1931665</a></li> <li>University of Victoria <a href="http://libguides.uvic.ca/geog" data-url="http://libguides.uvic.ca/geog">http://libguides.uvic.ca/geog</a></li> <li>Vancouver Island University <a href="http://libguides.viu.ca/content.php?pid=220631&amp;sid=1831532" data-url="http://libguides.viu.ca/content.php?pid=220631&amp;sid=1831532">http://libguides.viu.ca/content.php?pid=220631&amp;sid=1831532</a></li> <li>Simon Fraser University <a href="http://www.lib.sfu.ca/help/subject-guides/geography/home" data-url="http://www.lib.sfu.ca/help/subject-guides/geography/home">http://www.lib.sfu.ca/help/subject-guides/geography/home</a></li> <li>University of British Columbia <a href="http://guides.library.ubc.ca/geography?hs=a" data-url="http://guides.library.ubc.ca/geography?hs=a">http://guides.library.ubc.ca/geography?hs=a</a></li> </ul> 
	</div>


	</div>
<div class="back-matter about-the-author " id="back-matter-about-the-authors" title="About the Authors">
	<div class="back-matter-title-wrap">
		<p class="back-matter-number">6</p>
		<h1 class="back-matter-title">About the Authors</h1>
								</div>
	<div class="ugc back-matter-ugc">
				 <p>This book was written by the British Columbia Geography Open Textbook Collective<br /> <a href="http://opentextbc.ca/geography/wp-content/uploads/sites/34/2014/07/AUTHOR_creditPDF-01-e1405033750149.png" data-url="http://opentextbc.ca/geography/wp-content/uploads/sites/34/2014/07/AUTHOR_creditPDF-01-e1405033750149.png"><img class="aligncenter wp-image-620" alt="British Columbia Geography Open Textbook Collective" src="http://opentextbc.ca/geography/wp-content/uploads/sites/34/2014/07/AUTHOR_creditPDF-01-e1405033750149.png" height="701" width="525" title="" /></a></p> 
	</div>


	</div>
<div class="back-matter credits " id="back-matter-additional-credits" title="Additional Credits">
	<div class="back-matter-title-wrap">
		<p class="back-matter-number">7</p>
		<h1 class="back-matter-title">Additional Credits</h1>
								</div>
	<div class="ugc back-matter-ugc">
				 <p>Support for the creation of this book was provided by:</p> <ul><li>Hilda Anggraeni, Illustrator, BCcampus</li> <li>Amanda Coolidge, Manager, Open Education, BCcampus</li> <li>Clint Lalonde, Manager, Open Education, BCcampus</li> <li>Brad Payne, Programmer, BCcampus</li> <li>Barbara Rheuling, Facilitator, BookSprints.net</li> <li>West Coast Editorial Services</li> <li>Jon Strang, Librarian, UBC Library</li> </ul> <p>And UBC librarians Darrell Bailie, Paul Lesack, Shawnna Parlongo, Sally Taylor, Ursula Ellis, Marjorie Mitchell, Devin Soper and Bryan Beck.</p> <p>With thanks to Megan Beckett from Siyavula and Dr. Erika Pearson from the University of Otago for their help and advice on organizing a textbook sprint.</p> <p>And finally, a very special thank you to all those who contributed resources and were willing to release their content with a Creative Commons license so that they could be included in this book.</p> 
	</div>


	</div>
<div class="back-matter miscellaneous " id="back-matter-versioning-history" title="Versioning History">
	<div class="back-matter-title-wrap">
		<p class="back-matter-number">8</p>
		<h1 class="back-matter-title">Versioning History</h1>
								</div>
	<div class="ugc back-matter-ugc">
				 <p>This page provides a record of edits and changes made to this book since its initial publication. Whenever edits or updates are made, we make the required changes in the text and provide a record and description of those changes here. If the change is minor, the version number increases by 0.1. However, if the edits involve substantial updates, the version number goes up to the next full number. The files on our website always reflect the most recent version.</p> <p>If you find an error in this book, please fill out the <a href="https://collection.bccampus.ca/report-error/" target="_blank" rel="noopener" data-url="https://collection.bccampus.ca/report-error/">Report an Error</a>.</p> <table style="border-collapse: collapse; width: 100%; height: 56px;"><thead><tr style="height: 14px;"><th style="width: 25%; height: 14px;" scope="col">Version</th> <th style="width: 25%; height: 14px;" scope="col">Date</th> <th style="width: 25%; height: 14px;" scope="col">Change</th> <th style="width: 25%; height: 14px;" scope="col">Details</th> </tr> </thead> <tbody><tr style="height: 14px;"><td style="width: 25%; height: 14px;">1.1</td> <td style="width: 25%; height: 14px;">September 8, 2014</td> <td style="width: 25%; height: 14px;">Book published.</td> <td style="width: 25%; height: 14px;"></td> </tr> <tr style="height: 14px;"><td style="width: 25%; height: 14px;">1.2</td> <td style="width: 25%; height: 14px;">August 8, 2018</td> <td style="width: 25%; height: 14px;">Figure 1.1 replaced in <a href="#chapter-2-2-introduction" data-url="/geography/chapter/2-2-introduction/">Chapter 1: Introduction</a>.</td> <td style="width: 25%; height: 14px;">The y-axis in Figure 1.1 went up at an inconsistent rate and contained errors. The graph was recreated based on source data to fix those errors. Attribution information for this figure was also updated.</td> </tr> <tr><td style="width: 25%;">1.3</td> <td style="width: 25%;">November 2, 2018</td> <td style="width: 25%;">Added links to new case studies.</td> <td style="width: 25%;">Three new case studies added as suggested activities to <a href="#chapter-4-6-activities" data-url="/geography/chapter/4-6-activities/">Chapter 3</a> and <a href="#chapter-6-8-activities" data-url="/geography/chapter/6-8-activities/">Chapter 5</a>.</td> </tr> <tr><td style="width: 25%;">1.4</td> <td style="width: 25%;">November 5, 2018</td> <td style="width: 25%;">The following changes were part of a project to standardize BCcampus-published books.</td> <td style="width: 25%;"><ul><li>Added additional publication information</li> <li>Updated copyright information</li> <li>Updated information&nbsp;on the “About the book” page</li> <li>Updated book’s cover</li> </ul> </td> </tr> <tr><td style="width: 25%;">1.5</td> <td style="width: 25%;">June 12, 2019</td> <td style="width: 25%;">Updated the book’s theme.</td> <td style="width: 25%;">The styles of this book have been updated, which may affect the page numbers of the PDF and print copy.</td> </tr> <tr><td style="width: 25%;">1.6</td> <td style="width: 25%;">January 19, 2022</td> <td style="width: 25%;">Added ISBNs to metadata and updated front matter.</td> <td style="width: 25%;">Updated the “About BCcampus Open Education” information on the <a href="#front-matter-about-the-book" data-url="https://opentextbc.ca/geography/front-matter/about-the-book/">About the Book</a> page.</td> </tr> </tbody> </table> 
	</div>


	</div>

</body>
</html>