Chapter 4. Biological Basis of Behaviour
The Brain and Spinal Cord
Tareq Yousef
Approximate reading time: 66 minutes
Learning Objectives
By the end of this section, you will be able to:
- Recognise the anatomy and functions of the spinal cord
- Express the major areas of the hindbrain, midbrain, and forebrain, and describe their main functions
- Be aware of the anatomical and functional divisions of the cortex
- Be aware of the anatomy and function of the corpus callosum
- Appreciate diversity and inclusion in brain research
- Acknowledge brain lateralization and give examples of lateralization in humans
- Be aware of differences in the roles of Broca’s area and Wernicke’s area in language ability
- Observe how neuroscientists measure brain activity
The brain is a complex organ with billions of interconnected neurons and glia. These cells are the basis of communication in the nervous system, which is organised into specialised structures that provide the foundation for thought, emotion, and behaviour. In this section, we discuss the overall organisation of the nervous system and the functions associated with different areas, beginning with the spinal cord.
The Spinal Cord
The spinal cord connects the brain to the outside world. It works like a relay station to direct messages to and from the brain, and also has its own system of automatic processes, called reflexes.
The top of the spinal cord is a bundle of nerves that merges with the brain stem, where many basic life processes, like breathing and digestion, are controlled. The spinal cord itself ends just below the ribs while its nerves extend all the way to the base of the spine. It’s functionally organised into 31 segments, each connected to a specific part of the body through the peripheral nervous system. Nerves branch out from the spine at each vertebra: sensory nerves bring messages in; motor nerves send messages out to the muscles and organs.
The spinal cord is set up to make simple decisions about incoming sensory messages without requiring input from the brain. This is the basis of several types of reflexes, such as knee jerk and pain withdrawal reflexes. When a sensory message meets certain parameters, its signal passes from the sensory nerve to a spinal interneuron, which then activates a motor neuron to initiate movement. This happens before the brain receives information about the painful stimulus, so this automatic spinal reflex allows the body to react very quickly (and minimise injury!).
The spinal cord is protected by bony vertebrae and cushioned in cerebrospinal fluid, but injuries can still occur. When the spinal cord is damaged in a particular segment, all lower segments are cut off from the brain, usually causing paralysis and loss of sensation. Therefore, someone with a severe spinal injury at the level of the hips will keep motor control and sensation in more body parts than someone with a spinal injury at the level of the shoulders. The higher the damage occurs, the greater the loss of function and sensation. Below we will discuss the hindbrain, midbrain, and forebrain, as well as some important functional regions of the brain.
Hindbrain Structure
The hindbrain is located at the back of the head and looks like an extension of the spinal cord. It contains the medulla, pons, and cerebellum (Figure BB.9). The medulla controls the automatic processes of the autonomic nervous system, such as breathing, blood pressure, and heart rate. The word pons literally means “bridge,” and as the name suggests, the pons connects the hindbrain to the rest of the brain. Acting as a bridge, the pons contains several “highways” that send information about body sensations to the brain and brings directions for body movement down to the spinal cord. The pons is also involved in regulating sleep and pain signals. The medulla and pons are part of the brain stem, which extends to the thalamus in the forebrain.

Midbrain Structures
The midbrain, located between the forebrain and the hindbrain, is home to a curious collection of structures involved in diverse functions. The superior colliculus is important in directing eye movements towards important aspects of a visual scene, while the inferior colliculus is involved in sound localization. Both structures direct behaviours to parts of the environment that are relevant to an individual at that moment in time. The midbrain also contains structures that are involved in the sleep/wake cycle, arousal, and motor activity.
These structures include the substantia nigra (Latin for “black substance”) and the ventral tegmental area (VTA) (Figure BB.10), which both contain cell bodies that produce the neurotransmitter dopamine and project to areas of the forebrain.The substantia nigra is important for planning and control of voluntary movement, and degeneration of these dopaminergic (“-ergic” means that those neurons contain and can release the neurotransmitter, here, dopamine) neurons is thought to be the main cause of the neurological disorder, Parkinson’s disease (Parent & Parent, 2010). In terms of the VTA, it sends parallel projections to the forebrain and is involved in reward and motivation. Alterations in the neuronal signalling in this pathway is linked to addictive behaviours, such as substance misuse and gambling (George & Le Moal, 2012).

Forebrain Structures
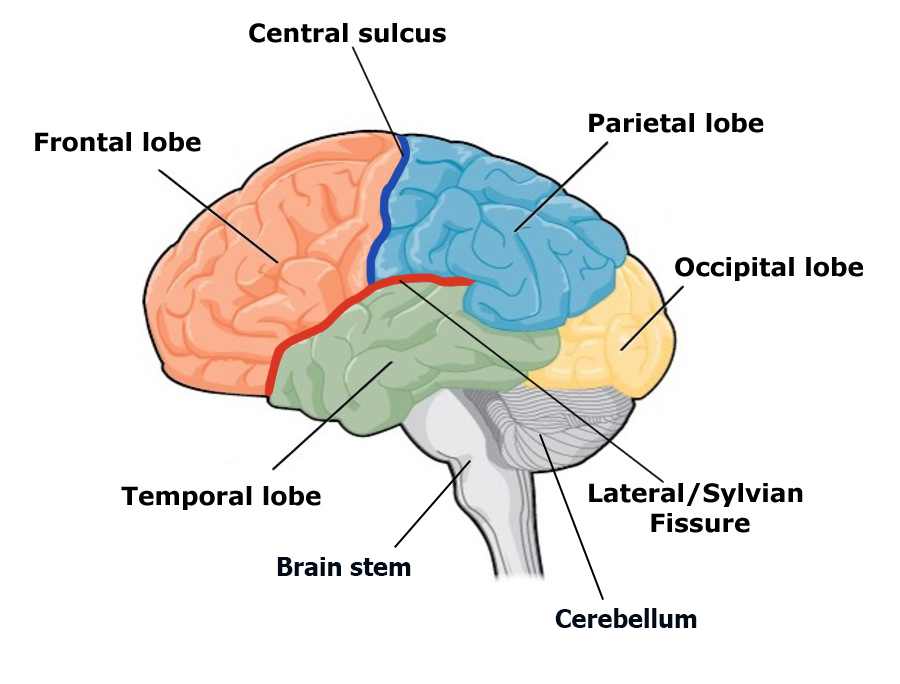
The surface of the forebrain is dominated by the cerebral cortex, with its distinctive pattern of folds or bumps, known as gyri (singular: gyrus), and grooves, known as sulci (singular: sulcus), shown in Figure BB.11. These gyri and sulci allow us to separate the brain into functional centres. The most prominent sulcus, known as the longitudinal fissure, is the deep groove that separates the brain into two halves or hemispheres: the left and the right.

The cerebral cortex makes up the majority of the forebrain (Figure BB.12), the largest part of the brain. In addition to the cortex the forebrain contains a number of other subcortical structures including the thalamus, hypothalamus, pituitary gland, and a collection of areas called the limbic system. We will elaborate on these terms below, but first we will map out the lobes of the cerebral cortex.
, midbrain (a small central portion), and hindbrain (a portion in the lower back part of the brain).")
Watch this video: Tricky Topics: Cortical Anatomy (11 minutes)
“Tricky Topics: Cortical Anatomy” video by FirstYearPsych Dalhousie is licensed under the Standard YouTube licence.
Here is the Tricky Topics: Cortical Anatomy transcript.
Lobes of the Cerebral Cortex
There are four lobes on each side of the cerebral cortex: frontal, parietal, temporal, and occipital (Figure BB.13). As its name suggests, the frontal lobe is located at the front and extends back to a fissure called the central sulcus, which separates it from the parietal lobe just behind. The temporal lobe begins below the lateral sulcus and extends backward towards the occipital lobe, which makes up most of the back part of the brain. The cortex can be described anatomically in terms of these lobes and sulci; size, shape, and location are all anatomical features that help us further map out different regions. Different areas of the cortex can also be described functionally, in terms of what they do. By the end of this section, you should be able to describe and compare different areas of the cortex both functionally and anatomically.
The size and location of the cerebral cortex makes it vulnerable to damage from injury and disease, however this is not usually fatal. In fact, most of what we’ve learned about the human cortex comes from observations of people living with damage to specific areas. If someone loses function after a brain injury, the damaged area was probably involved in that function.
Potentially the most famous case of brain damage is Phineas Gage: On September 13, 1848, 25-year old Gage was working as a railroad foreman. He and his crew were using an iron rod to tamp explosives into a blasting hole to remove rock along the railway’s path. Unfortunately, this created a spark and the rod exploded out of the hole, into Gage’s face, and through his skull (Figure BB.14). It passed through the left frontal lobe and exited between the parietal and frontal bones of the skull.
 is a photograph of Phineas Gage holding a metal rod. Image (b) is an illustration of a skull with a metal rod passing through it from the cheek area to the top of the skull.")
Remarkably, Gage was conscious and capable of moving and talking within minutes. In the following months he had a severe fungal infection of the brain (that could have resulted in more damage) and was cared for by doctor John Martyn Harlow (Harlow, 1848). Harlow’s notes provide the most direct information on Gage’s recovery.
In the months following the injury, Harlow wrote that Gage was improving, but he had trouble with self control. His friends also noted this with reports of overspending and inappropriate social behaviour, like swearing (Harlow, 1968). Within three months Gage was healthy enough to move home, but hadn’t recovered enough to resume his duties as a foreman. However, just four years later he moved to Chile to establish a line of stage coaches. The job involved scheduling, managing finances, and interacting with passengers during long journeys — requiring a lot of patience and perseverance! It seems unlikely that this would have been possible for the rude, unpredictable man often described in this case (Macmillan & Lena, 2010).
Harlow didn’t have access to imaging technology so we aren’t sure what structures were affected by Gage’s injury, or which structures adapted so he could recover. Luckily, we can use modern techniques to make an educated guess about what happened to Gage’s brain. A study from 2012 (Van Horn et al., 2012) used Gage’s skull along with imaging data from similar living subjects to model the damage based on the rod’s trajectory (Figure BB.15). This model suggested that the left orbitofrontal cortex in the frontal lobe was severely damaged. The majority of connective pathways from the left frontal lobe to other areas, including the limbic system, were also affected. Further inspection of Gage’s skull indicates that there may have also been some direct damage to the amygdala (Szczepanski & Knight, 2014).
 is a photograph of Phineas Gage holding a metal rod. Image (b) is an illustration of a skull with a metal rod passing through it from the cheek area to the top of the skull.")
So what kind of impairments do we commonly see after damage to these areas? Patients with damage to similar areas of the prefrontal cortex show higher scores on tests of impulsivity, taking less time to consider tasks and plan action, and making more errors. These patients are also less likely to change their behaviour in response to consequences, report more inappropriate social behaviours, and more feelings of anger (Berlin et al., 2004, Szepanski & Knight, 2015), similar to what Gage experienced. In fact, Harlow’s research with Gage prompted him to coin the term Frontal Lobe Syndrome, a term describing deficits in motivation, planning, social behaviour, and language production that can appear after damage to the prefrontal cortex (Pirau & Lui, 2021). Gage’s case provides a memorable demonstration of frontal lobe function, but it also shows the brain’s remarkable ability to adapt and regain function after injury.
Brain damage studies provide important information about the cortex but advancements in medicine and technology have since given us more precise methods for investigating the brain. A foundational example comes from neurosurgeon Wilder Penfield, who systematically studied the effects of electrical stimulation on different parts of the cortex. At the very back end of the frontal lobe, just before the central sulcus, is a strip of cortex called the precentral gyrus and is home to the primary motor cortex, an area that activates movements after we decide to make them. Most of what we know about this part of the brain comes from classic research in epilepsy patients done by Penfield and associates Theodore Rassmussen and Edwin Boldrey.
Some patients don’t respond to anti-seizure drugs, so in severe cases the seizure-inducing part of the brain is removed. To ensure that only the problematic brain tissue was removed, these researchers stimulated the brains of awake, anaesthetised patients with a mild electric current and asked them to report their sensations. When he stimulated neurons in the primary motor cortex, patients reported movements of body parts on the opposite side. In other words, the right primary motor cortex controls movement of body parts on the left and the left primary motor cortex controls movement on the right. This arrangement is referred to as contralateral, meaning opposite side. These movement-controlling areas can be understood as representations of the body parts they activate, and stimulation studies indicate that they are laid out in the brain in the same order as they appear in the body. For example, finger neurons are located next to hand neurons which are located next to arm neurons. (Figure BB.16) (Penfield & Boldrey, 1937). This is called somatotopy, the concept that parts of the body correspond to specific parts of the cortex.
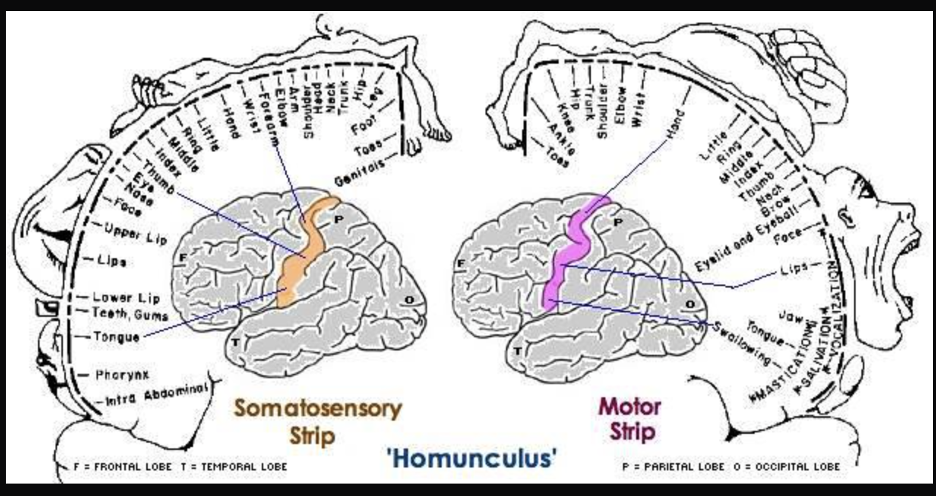
Just behind the motor cortex on the other side of the central sulcus is the primary somatosensory (involved in sensation of the body) cortex. This strip of cortex is at the beginning of the parietal lobe, and it plays an essential role in the perception of touch, temperature, and pain. Penfield discovered that electrical stimulation of this area produces tactile sensations in different regions of the body on the contralateral side. Like in the primary motor cortex, neurons in the primary somatosensory cortex are also grouped by body part, so that the arrangement in the body is maintained on the surface of the cortex (Figure BB.16).
Note that the size of body parts on both these motor and touch maps is distorted, with huge amounts of cortical space devoted to the fingers, hands, and mouth compared to the arms, legs, and torso (Penfield & Boldery, 1937; Penfield & Rasmussen, 1950). The areas of the body that we have more control over or which are more sensitive have the most cortical space. For example, the fingers have more cortical space than the chin, which is much less sensitive and can’t carry out coordinated movement.
Penfield’s representation of the brain’s somatosensory “touch map” as a two-dimensional homunculus or ‘little man’ is one of the most recognisable images in neuroscience. Every introductory Psychology textbook has some version of it, along with its twin, the “motor map”, located next door in the frontal lobe. These images demonstrate that 1) the map of the body is retained in the brain and 2) the size of a body part’s representation is related to its function rather than its physical size. These features are key to understanding the way movement and somatosensation are coded in the brain. See the end of this section for a section on homunculus representation and how rewiring of the neurons in the brain (an important indicator of change after injury, or even something positive like learning!) can be studied from diverse perspectives.
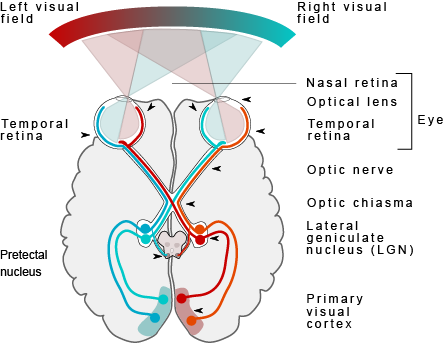
Just like the sense of touch, other senses send information to the cortex in an organised, map-like arrangement. The primary visual cortex is located at the back end of the brain in the occipital lobe, and is the first bit of cortex to receive visual information from the eyes. Unlike the somatosensory system, which sends signals separately from each side of the body, the visual system is a little different because the left and right eyes each capture images from the left and right sides of visual space (Figure BB.17). This bit of detail is beyond what al-Haytham (who hypothesised how vision works at the beginning of this chapter) envisioned but you should be able to see the similarities between his depiction and our modern understanding of the beginnings of the visual pathway! The inside part of the right eye and the outside part of the left eye both detect stimuli in the right visual field and the optic nerves carry information from the eye to the brain so the right visual world ALL ends up in the left side of the brain. If you follow the lines in the figure you can see the same arrangement is true for the left visual field.
The primary auditory cortex is the main area responsible for processing incoming auditory information from the ears, and is located within the temporal lobe, tucked inside the lateral fissure. The primary gustatory cortex is responsible for the perception of taste and is found deeper within the lateral fissure that includes a portion of the frontal lobe as well as a structure called the insula. The sense of smell is sent from receptors in the nose to the olfactory bulb that runs along the bottom of the frontal lobe and then to the primary olfactory area in the piriform cortex.
These primary sensory areas are important for categorising and integrating sensory information, which are the first steps in conscious perception and therefore can be considered the main sites of input from the environment. The primary motor area is responsible for voluntary movement, so it is one of the main sites of output by the brain. Collectively, these functional areas make up only a small proportion of the total cortical tissue, the rest is referred to as association cortex. It integrates information gathered from other areas to regulate complex thought processes such as problem-solving, decision-making, and language. Unlike the primary sensory and motor areas, electrical stimulation of association cortex does not produce simple movement or sensation.
Other Areas of the Forebrain
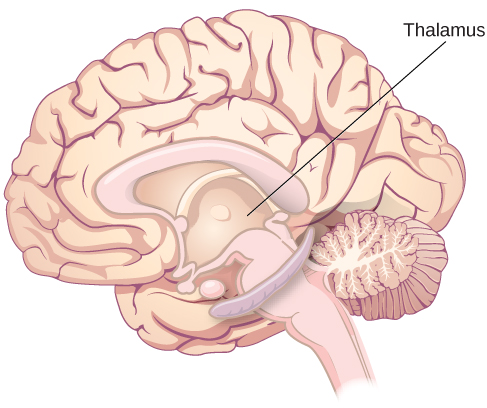
Other areas of the forebrain, located beneath the cerebral cortex, include the thalamus and the limbic system. The thalamus is a sensory relay for the brain. All of our senses, with the exception of smell, are routed through the thalamus before being directed to other areas of the brain for processing (Figure BB.18).
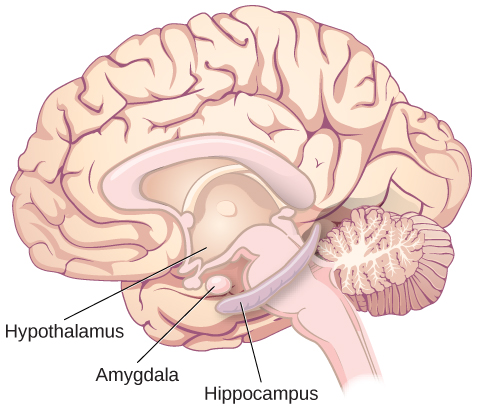
The limbic system is involved in processing both emotion and memory. The limbic system is made up of a number of different structures, but three of the most important are the hippocampus, the amygdala, and the hypothalamus (Figure BB.19). The hippocampus is an essential structure for learning and memory. The amygdala is involved in our experience of emotion and in tying emotional meaning to our memories. The hypothalamus regulates a number of homeostatic processes, including the regulation of body temperature, appetite, and blood pressure. The hypothalamus also serves as an interface between the nervous system and the endocrine system and in the regulation of sexual motivation and behaviour, all things that can also influence our emotion and learned behaviours (i.e., creation of new memories). You will read more about how learning happens shortly, and later on in this book!
The Case of Henry Molaison (H. M.)
In 1953, Henry Gustav Molaison (H. M.) was a 27-year-old man who experienced severe seizures. In an attempt to control his seizures, H. M. underwent brain surgery to remove his hippocampus and amygdala. Following the surgery, H.M’s seizures became much less severe, but he also suffered some unexpected — and devastating — consequences of the surgery: he lost his ability to form many types of new memories. For example, he was unable to learn new facts, such as who was the president of the United States.
He was able to learn new skills, but afterward he had no recollection of learning them. For example, while he might learn to use a computer, he would have no conscious memory of ever having used one. He could not remember new faces, and he was unable to remember events, even immediately after they occurred. Researchers were fascinated by his experience, and he is considered one of the most studied cases in medical and psychological history (Hardt, Einarsson, & Nader, 2010; Squire, 2009). Indeed, his case has provided tremendous insight into the role that the hippocampus plays in the consolidation of new learning into explicit memory.
Does the Classic Homunculus Represent Us All?
The somatosensory homunculus is a popular depiction of somatotopy for mainstream culture. You might have seen one of these three-dimensional figures in a museum or at themed exhibits like Ripley’s Believe It or Not. Often, the homunculus is presented as a demonstration of neural organisation in a neutral human body, even though it depicts a person with a penis and testicles. What about bodies that don’t have those parts? Glaringly, Penfield didn’t make a homunculus with breasts, vagina, clitoris, uterus or ovaries (Di Noto et al., 2012), even though he studied people with those body parts.

It’s possible that Penfield and associates didn’t make a map representing those without a penis because they didn’t have a big enough sample of people with that anatomy, but it’s likely that this exclusion was also influenced by gender or sex-based bias. This bias can be demonstrated in the language these researchers chose. He/him pronouns were always used to refer to patients, even though some of them would have been assigned she/her pronouns at birth instead (Penfield & Rasmussen, 1950). This bias has long been present in biomedical research, and persists today. In neuroscience specifically, studies that only use assumed male patients outnumber studies using assumed female patients 5.5:1 (Plevkova et al., 2020).
Furthermore, many transgender people describe feelings of disconnection with sexed body parts and some experience phantom limb-like sensations from sexed body parts they weren’t born with. It isn’t surprising that these experiences could relate to differences in the neural representation of those body parts (Ramachandran, 2008; McGeoch et al., 2011). Case et al. (2017) used magnetoencephalography imaging to record brain activity during stimulation of the breast, a body part that many trans men feel disconnected from. Their findings suggest that feelings of disconnection from gender-incongruent body parts in trans men could be related to differences in the neural representation of the body. Mapping the AFAB (assigned female at birth) brain might also have implications for other pain conditions like hysterectomy, vulvodynia, and fibromyalgia (Di Noto et al., 2012).
There have been recent attempts to create a somatosensory homunculus that represents the AFAB body, for example Di Noto et al. (2012) used existing data to create an illustration of AFAB anatomy in Penfield’s 2D homunculus. However, this version is not as precise as the existing homunculus. In 2020, Wright and Foerder created the first 3D somatosensory homunculus to include breasts, nipples, vagina, and clitoris. As of 2022, there is still no comprehensive 2-D map displaying where AFAB body parts are precisely located in the somatosensory cortex. Currently, many of these attempts are being called the hermunculus, but it should be noted that this term could be more inclusive. Trans men and non-binary people who don’t use she/her pronouns would also have their bodies represented by it. Given the erasure of transgender people in medical settings and the negative health outcomes associated (Bauer et al., 2009), it would be ideal to work towards using terminology that doesn’t force anyone to identify with the wrong gender in order to receive medical care.
This gap in the research isn’t just an issue of representation; it has medical implications that lead to the neglect of large portions of the world’s population. Importantly, the somatosensory cortex is a focus of research on neuroplasticity because representations of body parts can change if the way they are used is altered. Neuroplasticity is a word used to describe the capacity of the brain’s neurons to change their connections–an indication of some sort of learning or change in an individual. For example, after amputation of an arm, sensory input from the face starts to activate the area of the somatosensory cortex that used to represent the hand. This change in neural representation can also cause changes in perceptual experience like phantom limb syndrome, where an individual experiences sensations or pain that feel like they are coming from the missing limb (Ramachandran & Rogers-Ramachandran, 2000). Without a somatosensory map that represents the bodies of people who were assigned female at birth (AFAB), we can’t assess neuroplasticity after changes to their anatomy.
Consider a common procedure like the mastectomy, the removal of breast tissue. Mastectomies are used to treat breast cancer and also as a gender affirming surgery for trans men and other trans and non-binary people with breasts (Dutta, 2015; Case et al., 2017). Data from people undergoing mastectomy indicates that about 33% of patients show changes in the neural representation of the breast, but we don’t know what that change causes perceptually for those patients (Aglioti et al., 1993; Aglioti et al., 1994; Dutta, 2015). In other words, how does an individual’s own sensation and feeling change after gender affirming surgery? Studies of plasticity that centre on decolonisation can help us understand this.
Understanding Changes in the Brain: Indigenous Perspectives
Dr. Michael Yellow Bird, a Professor from the University of Manitoba describes neuro-decolonisation as a term that “involves combining mindfulness approaches with traditional and contemporary secular and sacred contemplative practices to replace negative patterns of thought, emotion and behaviour with healthy productive ones” (Yellow Bird, n.d.).
This “replacement” suggests a change like that described as neuroplasticity—an indication that decolonising work, though it may be done with the intent to support others, requires the individual (importantly, the settler) to change their ways of thinking. For example, neuro-decolonisation would work to support individuals dealing with the trauma of colonialism (cultural genocide associated with residential schools) and would also expand the work of neuroscience to broader perspectives including exploring colonially marginalised experiences such as those of two-spirit or transgender individuals.
Incorporating Indigenous perspectives can and ought to start at the beginning of the scientific process. Engaging in scientific research usually relies on settler-dominant spaces such as the research institutions across Canada. Two-eyed seeing (etuaptmumk) was conceived by Mi’kmaw Elder Albert Marshall (Bartlett, Marshall, & Marshall, 2012). This concept encourages researchers to use the strengths of mainstream Western knowledge and Indigenous knowledge and ways of knowing together. Two-eyed seeing is one path toward neuro-decolonisation and has been recognised by the Canadian Brain Research Strategy as a path toward greater diversity in the field (Perreault et al., 2021). The strength in this neuro-decolonising practice is expected to, among other things, enrich brain health and associated human rights (i.e., justice and support for those with mental health issues) (Harding et al., 2022).
Considering multiple perspectives should feel like the appropriate thing to do, given that the brain’s plasticity is an indication of changes at biological levels (changes in synapses and brain function), sometimes as a response to something external like an amputation or having a new experience (for example, learning an instrument). The fact that experience shapes our brain can also be addressed from a decolonised way. The indigenous group, the Pirahã of the Amazon region of Brazil, have numbers for one, two, and “many” — a different way of conceptualising numbers than for those who grew up learning one of the predominantly spoken languages of the world. The Pirahã people’s experience of counting in this way has likely shaped brain synapses that result in different experiences with managing large numbers yielding a heavier reliance on estimation (Gordon, 2004).
Lateralization
You may be familiar with the idea that the right and left hemispheres have different abilities or specialised functions, referred to as lateralization. Some of the earliest evidence of lateralization comes from Paul Broca. Broca identified a structure in the frontal lobe now known as Broca’s area, which typically appears on the left hemisphere (Figure BB.21). This discovery came from work with patients with a particular set of language impairments after damage in the Broca’s area, called Broca’s aphasia.
Consider Louis Leborgne or ‘Tan’, Broca’s first patient with damage in this area. Leborgne was described as intelligent, and understood language but wasn’t able to reply with anything other than “tan” or a single swear word if he was angry. Leborgne’s primary communication was a combination of gestures and “tan”, spoken in a variety of tones depending on context (Devinsky & Samuels, 2016). This is why Broca’s aphasia is also called expressive aphasia, because people affected by it cannot produce communicative language in a verbal or written form, though they have no problems with comprehension.
Wernicke’s area, important for speech comprehension, is also located in the left hemisphere, close to the primary auditory cortex. Whereas individuals with damage to Broca’s area have difficulty producing language, those with damage to Wernicke’s area can produce words, but they aren’t able to understand language or combine words in sensible ways (Figure BB.21). In most people, both Broca’s area and Wernicke’s area are located in the left hemisphere.

These kinds of cases indicate that the left hemisphere may have some specialised control of verbal language. For most people, the left hemisphere is needed for verbal language, while the right hemisphere may be better at some kinds of comprehension and symbol recognition (Taylor & Regard, 2003). It’s likely that both hemispheres need to interact to produce a full range of language functions.
More evidence for lateralization comes from Michael Gazzaniga and his colleagues, who studied the function of each hemisphere independently in patients who had undergone ‘split-brain’ surgery. This surgery is used to stop the spread of seizures from one hemisphere to the other in some cases of severe epilepsy. To accomplish this the surgeon must cut the corpus callosum, a band of about 200 million axons that allows for communication between the two hemispheres (Figure BB.22). Because the two sides normally share the information they have processed, we aren’t aware of the different roles they play in day-to-day function.
This is not the case for split-brain patients. For instance, if you show a picture to the patient’s left visual field only, they won’t be able to name it because the information is only available in the largely nonverbal right hemisphere. However, they can recreate the picture with their left hand, which is also controlled by the right hemisphere. When the more verbal left hemisphere sees the picture that the hand drew, the patient is able to name it (assuming the left hemisphere can interpret what was drawn by the left hand).
 and (b) show the corpus callosum’s location in the brain in front and side views. Photograph (c) shows the corpus callosum in a dissected brain.")
More data from Gazzinga and associates suggests that a variety of functions show patterns indicating some degree of hemispheric dominance (Gazzaniga, 2005). For example, the left hemisphere may be superior for forming associations in memory, selective attention, and positive emotions. The right hemisphere, on the other hand, may be superior in pitch perception, arousal, and negative emotions (Ehret, 2006). It’s tempting to conclude that certain behaviours can be attributed to one hemisphere or the other, but research in this area produces inconsistent results and there’s a natural variation of brain organisation in every population of humans (Banich & Heller, 1998).
Watch this video: Tricky Topic: Hemispheric Lateralization (9 minutes)
“Tricky Topics: Hemispheric Lateralization” video by FirstYearPsych Dalhousie is licensed under the Standard YouTube licence.
Here is the Tricky Topics: Hemispheric Lateralization transcript.
Brain Imaging
You have learned how brain injury can provide information about the functions of different parts of the brain. Increasingly, however, we are able to obtain that information using brain imaging techniques on individuals who have not suffered brain injury. In this section, we take a more in-depth look at some of the techniques that are available for imaging the brain, including techniques that rely on radiation, magnetic fields, or electrical activity within the brain.
Techniques Involving Radiation
A computerised tomography (CT) scan involves taking a number of x-rays of a particular section of a person’s body or brain (Figure BB.23). The x-rays pass through tissues of different densities at different rates, allowing a computer to construct an overall image of the area of the body being scanned. A CT scan is often used to determine whether someone has a tumour or significant brain damage. Different types of tissues will show up differently in CT scans as they can be more or less dense.
 shows a brain scan where the brain matter’s appearance is fairly uniform. Image (b) shows a section of the brain that looks different from the surrounding tissue and is labeled “tumour.”")
Figure BB.23. Figure 3.26 as found in Psychology 2e by OpenStax is licensed under a CC BY 4.0 License.
Positron emission tomography (PET) scans create pictures of the active brain (Figure BB.24). An individual receiving a PET scan drinks or is injected with a mildly radioactive substance, called a tracer. Once in the bloodstream, the amount of tracer in any given region of the brain can be monitored. As a brain area becomes more active, more blood flows to that area and more of the tracer is visible.
A computer monitors the movement of the tracer and creates a rough map of active and inactive areas of the brain during a given behaviour. PET scans show little detail, are unable to pinpoint events precisely in time, and require that the brain be exposed to radiation; therefore, this technique has been replaced by newer technologies (see below). However, combined with CT, PET technology is still being used in certain contexts. For example, CT/PET scans allow better imaging of the activity of neurotransmitter receptors and open new avenues in schizophrenia research. In this hybrid CT/PET technology, CT contributes clear images of brain structures, while PET shows the brain’s activity.

Techniques Involving Magnetic Fields
In magnetic resonance imaging (MRI), a person is placed inside a machine that generates a strong magnetic field. The magnetic field causes the hydrogen atoms in the body’s cells to move. When the magnetic field is turned off, the hydrogen atoms emit electromagnetic signals as they return to their original positions. Tissues of different densities give off different signals, which a computer interprets and displays on a monitor.
Functional magnetic resonance imaging (fMRI) operates on the same principles as MRIs, but it shows changes in brain activity over time by tracking blood flow and oxygen levels. The fMRI provides more detailed images of the brain’s structure, as well as better accuracy in time than is possible in PET scans (Figure BB.25). With their high level of detail, MRI and fMRI are often used to compare the brains of healthy individuals to the brains of individuals with psychological disorders. This comparison helps determine what structural and functional differences exist between these populations.

Techniques Involving Electrical Activity
In some situations, it is helpful to gain an understanding of the overall activity of a person’s brain, without needing information on the actual location of the activity.
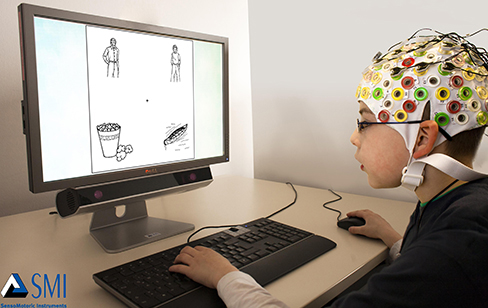
Electroencephalography (EEG) serves this purpose by measuring a brain’s electrical activity. An array of electrodes is placed around a person’s head (Figure BB.26). The signals received by the electrodes result in a printout of the electrical activity of their brain, or brainwaves, showing both the frequency (number of waves per second) and amplitude (height) of the recorded brainwaves, with an accuracy within milliseconds. Such information is especially helpful to researchers studying sleep patterns among individuals with sleep disorders.
By the end of this chapter, you are encouraged to take time to reflect on the physical parts of you that make you who you are. The sum of all of the parts of your nervous system (from the neurotransmitters to the synapses they target, the axons of neurons that carry electrical signals, and beyond) make up a vastly complex organism that not only responds to its environment, but has thoughts and feelings. How vast and brilliant! Many psychologists aim to understand how this all works, an opportunity you will have if you continue on in this field.
Summary
Cells of the Nervous System
Glia and neurons are the two cell types that make up the nervous system. While glia generally play supporting roles, the communication between neurons is fundamental to all of the functions associated with the nervous system. Neuronal communication is made possible by the neuron’s specialised structures. The soma contains the cell nucleus, and the dendrites extend from the soma in tree-like branches. The axon is another major extension of the cell body; axons are often covered by a myelin sheath, which increases the speed of transmission of neural impulses. At the end of the axon are terminal buttons that contain synaptic vesicles filled with neurotransmitters.
Neuronal communication is an electrochemical event. The dendrites contain receptors for neurotransmitters released by nearby neurons. If the signals received from other neurons are sufficiently strong, an action potential will travel down the length of the axon to the terminal buttons, resulting in the release of neurotransmitters into the synaptic cleft. Action potentials operate on the all-or-none principle and involve the movement of sodium (Na+) and potassium (K+) across the neuronal membrane.
Different neurotransmitters are associated with different functions. Often, psychological disorders involve imbalances in a given neurotransmitter system. Therefore, psychotropic drugs are prescribed in an attempt to bring the neurotransmitters back into balance. Drugs can act either as agonists or as antagonists for a given neurotransmitter system.
Parts of the Nervous System
The brain and spinal cord make up the central nervous system. The peripheral nervous system comprises the somatic and autonomic nervous systems. The somatic nervous system transmits sensory and motor signals to and from the central nervous system. The autonomic nervous system controls the function of our organs and glands, and can be divided into the sympathetic and parasympathetic divisions. Sympathetic activation prepares us for fight or flight, while parasympathetic activation is associated with normal functioning under relaxed conditions.
The Brain and Spinal Cord
The brain consists of two hemispheres, each controlling the opposite side of the body. Each hemisphere can be subdivided into different lobes: frontal, parietal, temporal, and occipital. In addition to the lobes of the cerebral cortex, the forebrain includes the thalamus (sensory relay) and limbic system (emotion and memory circuit). The midbrain contains the substantia nigra and ventral tegmental area. These structures are important for movement, reward, and addictive processes. The hindbrain contains the structures of the brainstem (medulla, pons, and midbrain), which control automatic functions like breathing and blood pressure. The hindbrain also contains the cerebellum, which helps coordinate movement and certain types of memories.
Individuals with brain damage have been studied extensively to provide information about the role of different areas of the brain, and recent advances in technology allow us to obtain similar information by imaging brain structure and function. These techniques include CT, PET, MRI, fMRI, and EEG.
Image Attributions
Figure BB.9. Figure 3.25 as found in Psychology 2e by OpenStax is licensed under a CC BY 4.0 License.
Figure BB.10. Figure 3.24 as found in Psychology 2e by OpenStax is licensed under a CC BY 4.0 License.
Figure BB.11. Figure 3.15 as found in Psychology 2e by OpenStax is licensed under a CC BY 4.0 License and contains modification of work by Bruce Blaus.
Figure BB.12. Figure 3.17 as found in Psychology 2e by OpenStax is licensed under a CC BY 4.0 License.
Figure BB.13. Figure 3.18 as found in Introduction to Psychology & Neuroscience (2nd Edition) is licensed under a CC BY 4.0 License and was adapted for this book by adding the cerebellum label.
Figure BB.14. Figure 3.19 as found in Psychology 2e by OpenStax is licensed under a CC BY 4.0 License and contains modification of work by Jack and Beverly Wilgus.
Figure BB.15. “Simulated Connectivity Damage of Phineas Gage” by Van Horn JD, Irimia A, Torgerson CM, Chambers MC, Kikinis R, et al., 2012, is licensed under a CC BY 2.5 license.
Figure BB.16 as found in Introduction to Psychology & Neuroscience (2nd Edition) is licensed under a CC BY 4.0 License.
Figure BB.17. A simplified schema of the human visual pathway By Miquel Perello Nieto is licensed under a CC BY-SA 4.0 license.
Figure BB.18. Figure 3.22 as found in Psychology 2e by OpenStax is licensed under a CC BY 4.0 License.
Figure BB.19. Figure 3.23 as found in Psychology 2e by OpenStax is licensed under a CC BY 4.0 License.
Figure BB.20 (a) is an adaptation of the following works: Sensory Homunculus Figure by Mpj29 is licensed under a CC BY-SA 4.0 License; Front of Sensory Homunculus Figure by Mpj29 is licensed under a CC BY-SA 4.0 License; Rear of Sensory Homunculus Figure by Mpj29 is licensed under a CC BY-SA 4.0 License.
Figure BB.21. Figure 3.21 as found in Psychology 2e by OpenStax is licensed under a CC BY 4.0 License.
Figure BB.22. Figure 3.16 as found in Psychology 2e by OpenStax is licensed under a CC BY 4.0 License.
Figure BB.23. Figure 3.26 as found in Psychology 2e by OpenStax is licensed under a CC BY 4.0 License.
Figure BB.24. Figure 3.27 as found in Psychology 2e by OpenStax is licensed under a CC BY 4.0 License.
Figure BB.25. Figure 3.28 as found in Psychology 2e by OpenStax is licensed under a CC BY 4.0 License.
Figure BB.26. Figure 3.29 as found in Psychology 2e by OpenStax is licensed under a CC BY 4.0 License.
To calculate this time, we used a reading speed of 150 words per minute and then added extra time to account for images and videos. This is just to give you a rough idea of the length of the chapter section. How long it will take you to engage with this chapter will vary greatly depending on all sorts of things (the complexity of the content, your ability to focus, etc).
division of the brain containing the medulla, pons, and cerebellum
hindbrain structure that controls our balance, coordination, movement, and motor skills, and it is thought to be important in processing some types of memory
hindbrain structure that controls automated processes like breathing, blood pressure, and heart rate
hindbrain structure that connects the brain and spinal cord; involved in regulating brain activity during sleep
division of the brain located between the forebrain and the hindbrain
midbrain structure where dopamine is produced; involved in control of movement
midbrain structure where dopamine is produced: associated with mood, reward, and addiction
surface of the brain that is associated with our highest mental capabilities
computerised tomography (CT) scan
(plural: gyri) bump or ridge on the cerebral cortex
(plural: sulci) depressions or grooves in the cerebral cortex
deep groove in the brain’s cortex
left or right half of the brain
largest part of the brain, containing the cerebral cortex, the thalamus, and the limbic system, among other structures
secretes a number of key hormones, which regulate fluid levels in the body, and a number of messenger hormones, which direct the activity of other glands in the endocrine system
collection of structures involved in processing emotion and memory
part of the cerebral cortex involved in reasoning, motor control, emotion, and language; contains motor cortex
a deep groove separating the temporal lobe and the frontal and parietal lobes
part of the cerebral cortex involved in processing various sensory and perceptual information; contains the primary somatosensory cortex
part of cerebral cortex associated with hearing, memory, emotion, and some aspects of language; contains primary auditory cortex
part of the cerebral cortex associated with visual processing; contains the primary visual cortex
area in the frontal lobe responsible for higher-level cognitive functioning
a set of common symptoms that can occur after damage to the frontal lobe, affecting motivation, planning, social behaviour, and language/speech production
strip of cortex involved in planning and coordinating movement
a term that refers to something on the opposite side of the body from a particular structure or phenomenon, e.g., the left hemisphere is contralateral to the right hand.
the matching arrangement of body parts and their representation in the cerebral cortex
essential for processing sensory information from across the body, such as touch, temperature, and pain
a human figure in which the size of different parts represents the relative amount of cortical space that corresponds to each body part
an area at the back of the occipital lobe that is responsible for processing visual information
strip of cortex in the temporal lobe that is responsible for processing auditory information
an area that includes a portion of the frontal lobe as well as the insula, buried inside the lateral fissure and responsible for processing information about flavour
an area on the ventral surface of the frontal lobe that is responsible for processing information about smells
areas of the cortex that are not primary sensory areas, responsible for more complex processing and combining information from multiple senses
sensory relay for the brain
structure in the temporal lobe associated with learning and memory
structure in the limbic system involved in our experience of emotion and tying emotional meaning to our memories
forebrain structure that regulates sexual motivation and behaviour and a number of homeostatic processes; serves as an interface between the nervous system and the endocrine system
nervous system’s ability to change
An Indigenous perspective for the conduct of neuroscience research that emphasises the plasticity associated with moving beyond colonial trauma
concept that each hemisphere of the brain is associated with specialised functions
region in the left hemisphere that is essential for language production
region in the left hemisphere that is essential for language production
thick band of neural fibres connecting the brain’s two hemispheres
imaging technique in which a computer coordinates and integrates multiple x-rays of a given area
involves injecting individuals with a mildly radioactive substance and monitoring changes in blood flow to different regions of the brain
magnetic fields used to produce a picture of the tissue being imaged
MRI that shows changes in metabolic activity over time
recording the electrical activity of the brain via electrodes on the scalp

.gif)