Chapter 15. Psychology in Our Social Lives
Behaving in the Presence of Others
Amelia Liangzi Shi
Approximate Reading Time: 30 minutes
Learning Objectives
After reading this chapter, you will be able to:
- Describe the advantages and disadvantages of working together in groups to perform tasks and make decisions
- Apply the techniques to increase group productivity
- Explain the reasons for conformity and obedience to authority
People today still spend a great deal of time in groups. We study together in groups, we work together on production lines, and we decide the fates of others in courtroom juries. Group work can be beneficial. During a complex surgery, a team works together so effectively that the outcome wouldn’t be possible if each person worked alone. However, group performance is almost never as good as we would expect, given the number of individuals in the group. In some cases, it might be worse than what one or more group members could achieve alone. What factors determine whether we work better or worse in front of others, or as a group? In this chapter, we will learn the factors that increase and decrease group productivity, and how our behaviours are influenced by peers and authority figures.

Social Facilitation and Social Loafing
In an early social psychological study, Norman Triplett (1898) found that bicycle racers who were competing with other bicyclers on the same track rode significantly faster than bicyclers who were racing alone. This led Triplett to hypothesize that people perform tasks better when there are other people present than they do when they are alone. The tendency to perform tasks better or faster in the presence of others is known as social facilitation.
However, it seems that the conclusion that being with others increases performance is not entirely true. Perhaps you remember an experience when you performed a task (e.g., playing the piano, shooting basketball free throws, giving a public presentation) very well alone but poorly with, or in front of, others. The tendency to perform tasks more poorly or more slowly in the presence of others is known as social inhibition.
Robert Zajonc (1965) explained the phenomena using the idea of physiological arousal. When we’re with others, we feel more aroused than when we’re alone. When the task to be performed is relatively easy, or if the individual has learned to perform the task very well (e.g., riding a bike), the increase in arousal caused by the presence of others will create social facilitation. On the other hand, when the task is difficult or not well learned (e.g., giving a public speech), the increase in arousal will hinder performance.
A great deal of experimental research has now confirmed these predictions. A meta-analysis by Charles Bond and Linda Titus (1983), which looked at the results of over 200 studies using over 20,000 research participants, found that the presence of others significantly increased the performance on simple tasks and decreased the performance on complex tasks.
Other factors have been proposed to account for social facilitation and social inhibition. For example, we are particularly influenced by others when we perceive that the others are evaluating us or competing with us. Strube and colleagues’ (1981) findings support this idea. In their study, the presence of spectators increased joggers’ speed only when the spectators were facing the joggers, so that the spectators could see the joggers and assess their performance. The presence of others did not influence joggers’ performance when the joggers were facing in the other direction and thus could not see them.
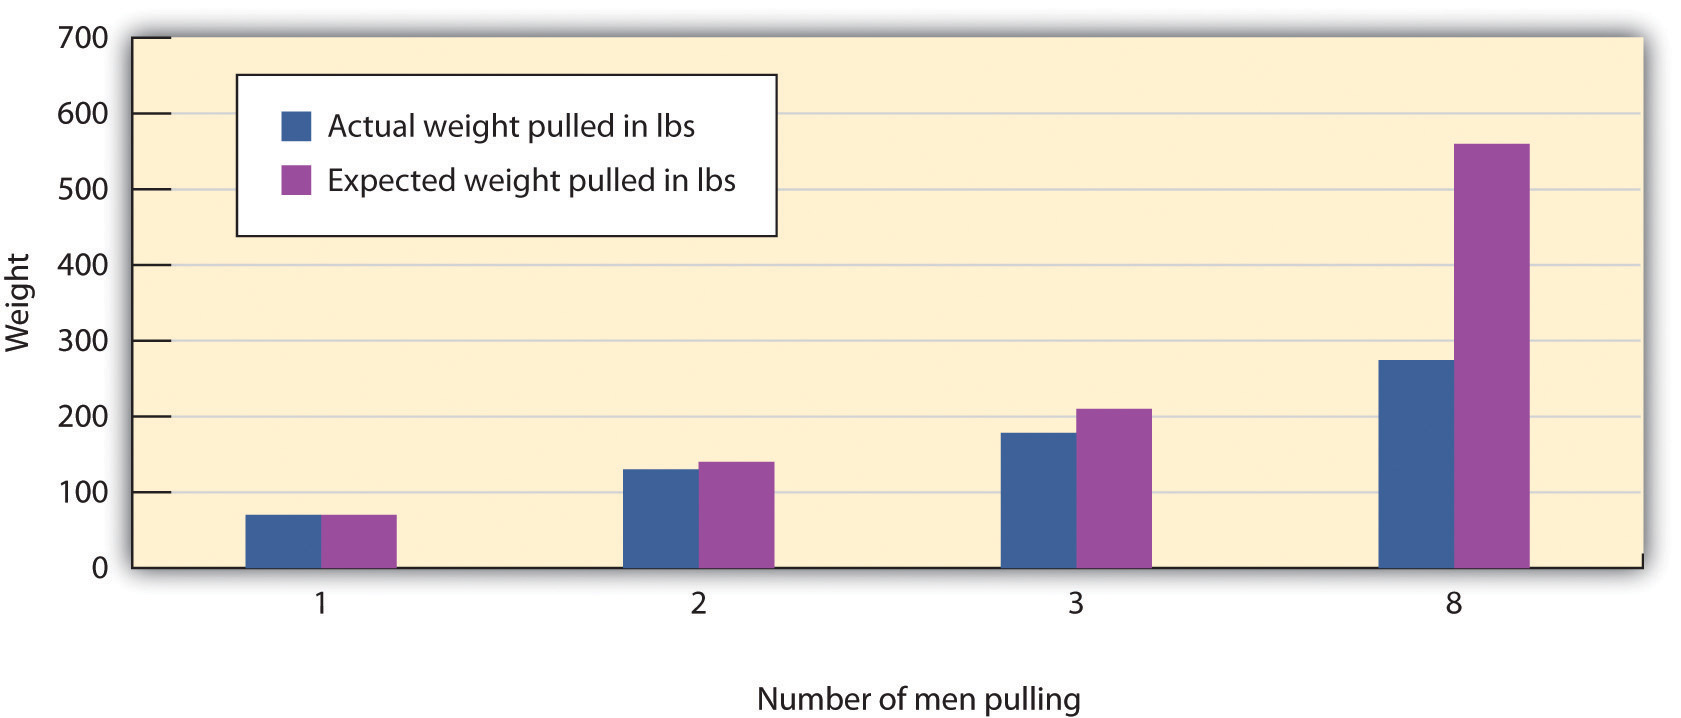
A common group process loss is social loafing, where members may not contribute as much as they should. In one of the earliest social psychology experiments, Max Ringelmann (1913; reported in Kravitz & Martin, 1986) had men pull on ropes, either individually or in groups. While larger groups pulled harder than one person, there was also a significant loss. Groups of three men pulled at only 85% of their expected capability, and groups of eight pulled at just 37%. This kind of loss, where group productivity drops as the group size increases, happens on many tasks.
Groupthink and Group Polarization
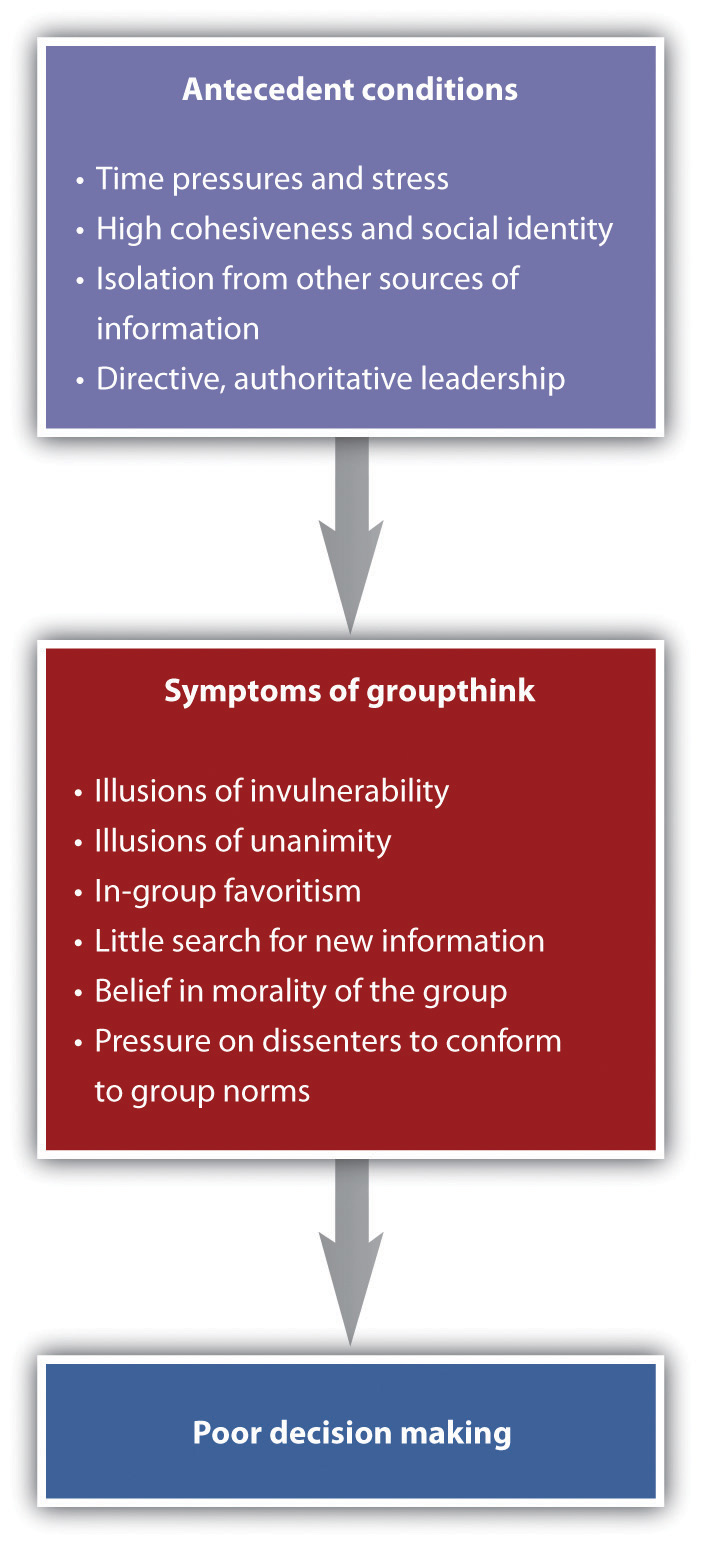
Group process losses can also occur when group members conform to each other rather than expressing their own divergent ideas. Groupthink occurs when a group, even if its members are smart and capable, ends up making a poor decision, as a result of a flawed group process and strong peer pressures. Groupthink is more likely to occur (a) when members feel a strong group identity (e.g., the Stanley Cup riots of 1994 and 2011 in Vancouver), (b) when there is a strong and directive leader, (c) when the group needs to make an important decision quickly, and (d) when the group is prevented from making a fully informed decision (e.g., members have no access to additional information). Groups suffering from groupthink become unwilling to seek out contradictory information and group members do not express contradictory opinions. The group begins to see itself as extremely valuable and important, highly capable of making high-quality decisions, and invulnerable. The group members begin to feel that they are superior and do not need to seek outside information. Such a situation is conducive to terrible decision making. Groupthink was involved in a number of well-known and important, but very poor, decisions made by government and business groups, including the crashes of two Space Shuttle missions in 1986 and 2003.
Another phenomenon that occurs within group settings is group polarization. Group polarization occurs when a group’s original attitude gets stronger after they talk about their opinions. That is, if a group initially favours a certain viewpoint, after discussion the group consensus is likely a stronger endorsement of that viewpoint. Conversely, if the group was initially opposed to a viewpoint, group discussion would likely lead to stronger opposition. Group polarization explains many actions taken by groups that would not be undertaken by individuals alone. For example, group polarization might be the reason for the strong political divisions that are very common in today’s society. Because people often choose news sources that match their own political beliefs, they don’t often come across different viewpoints. This makes their own views stronger over time and can lead to prejudice and discrimination towards people with different political ideas (Iyengar & Westwood, 2015).
Working in groups has both positive and negative outcomes. On the positive side, it’s smart to use groups for decisions because they can achieve more together than one person can alone. Besides, once a group decides on something, it’s often easier to get others to follow because people think decisions by groups are fairer. However, groups often face problems that make them less effective. Group members often do not realise that the process losses are occurring around them. For example, people in brainstorming groups may feel they’ve been more productive than they would have been if they were working alone, even if the group didn’t do very well (Nijstad et al., 2006). The tendency for group members to overvalue the productivity of the groups they work in is known as the illusion of group productivity. Group members hear many ideas, making it seem like the group is doing great. Also, the sense of group belongingness makes members believe the group is strong and doing well. We can use some techniques to increase process gains and reduce process losses. Table SL.2 summarises some of these techniques.
| Technique | Example |
|---|---|
| Provide rewards for performance | Rewarding employees and team members with bonuses will increase their effort toward the group goal. People will also work harder in groups when they feel that they are contributing to the group goal rather than when they feel that their contributions are not important. |
| Keep group member contributions identifiable | If they feel that their contributions to the group are known and potentially seen positively by the other group members, group members will work harder than they will if their contributions are summed into the group total and thus unknown (Szymanski & Harkins, 1987). |
| Maintain equity | Workers who feel that their rewards are proportional to their efforts in the group will be happier and work harder than workers who feel that they are underpaid (Geurts et al., 1994) |
| Keep groups small | Larger groups are more likely to suffer from coordination problems and social loafing. The most effective working groups are of relatively small size — about four or five members. |
| Create positive group norms | Group performance is increased when the group members care about the ability of the group to do a good job. On the other hand, some groups develop norms that prohibit members from working to their full potential and thus encourage loafing. |
| Improve information sharing | Leaders must work to be sure that each member of the group is encouraged to present the information that they have in group discussions. One approach to increasing full discussion of the issues is to have the group break up into smaller subgroups for discussion. |
| Allow plenty of time | Groups need time to reach consensus, and allowing plenty of time will help keep the group from coming to premature consensus and making an unwise choice. Time to consider the issues fully also allows the group to gain new knowledge by seeking information and analysis from outside experts. |
| Set specific and attainable goals | Groups that set specific, difficult, yet attainable goals (e.g., “improve sales by 10% over the next six months”) are more effective than groups that are given goals that are not very clear (e.g., “let’s sell as much as we can!”) (Locke & Latham, 2006). |
Social Dilemmas
According to behaviourism, people act in ways that maximise the benefits. A social dilemma is a situation in which the behaviour that creates the most positive outcomes for the individual may in the long term lead to negative consequences for the group as a whole. In the context of social dilemmas, it is easy to be selfish, because the personally beneficial choice, such as using water during a water shortage or catching as many fish as you want on your fishing trip, produces immediate reinforcements for the individual. The long-term negative outcome (e.g., the extinction of fish species) is far away in the future. It is difficult for an individual to see how many costs there really are. Each individual might prefer to make use of public resources for themselves, whereas the best outcome for the group as a whole is to use the resources more slowly and wisely.
Consider a situation known as the commons dilemma (Hardin, 1968). The commons refer to public resources that are shared by the group members. Commons dilemmas can be found in many contemporary issues, including the use of limited natural resources, air pollution, and public land. In large cities, most people may prefer the convenience of driving their own car to work each day rather than taking public transportation, yet this behaviour uses up public resources, like the space on limited roadways, crude oil reserves, and clean air. People are lured into the dilemma by short-term rewards, seemingly without considering the potential long-term costs of the behaviour, such as air pollution and the necessity of building even more highways.
Psychologists have been using a game called the prisoner’s dilemma (Poundstone, 1992) to study social dilemmas in the lab. In this game, people face a social dilemma where their own goals clash with the goals of someone else or the whole group. Just like in any social dilemma, we assume each player in the prisoner’s dilemma game would aim to maximise their own benefit.
In the original game, two prisoners named Frank and Malik are accused of a crime. Even though the police believe they worked together, they only have enough evidence for a smaller crime for each. To get more evidence, the police question each prisoner separately. They hope that by promising a shorter sentence, one of the prisoners will confess to the bigger crime. Each prisoner can make either the cooperative choice by not confessing, or the competitive choice by confessing.
Figure SL.10 shows a payoff matrix that tells the two game players what might happen based on the choices made. The top part of the matrix is for Malik’s choices — to confess or not confess. The side is for Frank’s choices — to confess or not confess. The payoffs that each prisoner receives, given the choices of each of the two prisoners, are shown in each of the four squares. If both Malik and Frank don’t confess, they each get three years in prison. If only one of them confesses, the confessor gets no years in prison while the person who did not confess gets 30 years in prison. If they both confess, they each get 10 years in prison.
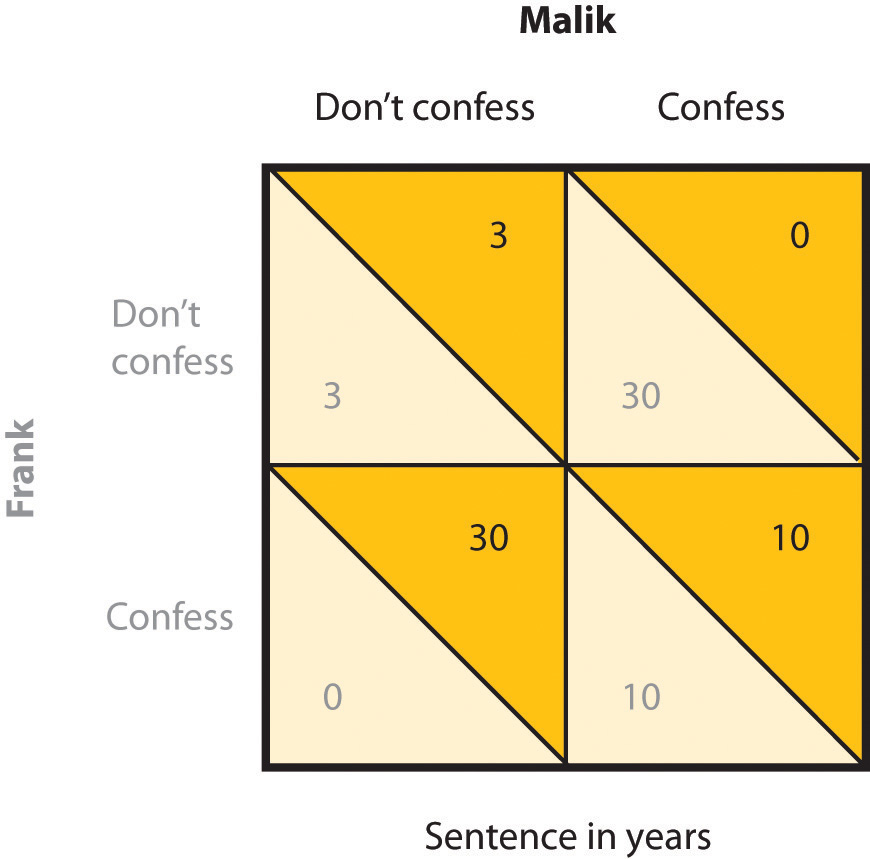
The prisoner’s dilemma is helpful in studying social dilemmas due to two key features. First, a positive outcome for one player doesn’t necessarily mean a negative outcome for the other. You may think if you cooperate (don’t confess) while the other player competes (confesses), you will lose and the confessor wins. However, if both of you cooperate by staying quiet, you will both receive a lighter sentence, resulting in a win-win. Second, the matrix pushes each player to compete. Imagine your goal is to maximise your benefits. Looking at the matrix values, if you think the other player will confess, you should confess too (to get 10 years instead of 30). If you think the other player won’t confess, you should still confess (to get no time instead of 3 years). Thus, the matrix suggests that the “best” choice for each player is to make the competitive choice (confess).
This setup mimics a real-life dilemma: each person is better off doing what’s best for them right away, but if everyone just thinks about themselves, everyone ends up worse off. The prisoner’s dilemma can be used to predict behaviour in many different types of dilemmas involving two or more parties, including choices of helping and not helping, working and loafing, and paying and not paying debts. For example, it may help us understand roommates’ decisions on housework. Each roommate seems to be better off if they rely on the other to clean the house (the competitive choice). But if neither of them makes an effort to clean the house(the cooperative choice), the house becomes a mess, and they will both be worse off.
Conformity and Obedience
When we decide on what courses to enroll in by asking for advice from our friends, change our behaviours as a result of the ideas that we hear from others, or binge drink because our friends are doing it, we are engaging in conformity. Conformity refers to a change in behaviour that occurs as the result of the presence of the other people around us. We conform for two reasons: informational conformity, thinking others have good information and wanting to gain knowledge, and normative conformity, wanting to be liked. The typical outcome of conformity is that our behaviours become more similar to those of others around us. However, some situations create more conformity than others. Table SL.3 summarises some of the factors that contribute to conformity.
| Variable | Description | Example |
|---|---|---|
| Number in majority | As the number of people who are engaging in a behaviour increases, the tendency to conform to those people also increases. | People are more likely to stop and look up in the air when many, rather than few, people are also looking up (Milgram et al., 1969). |
| Unanimity | Conformity reduces greatly when any one person deviates from the norm. | In line-matching research, when any one person gave a different answer, conformity was eliminated (Asch, 1955). |
| Status and authority | People who have higher status, such as those in authority, create more conformity. | Conformity in obedience studies was greatly reduced when the person giving the command to shock was described as an “ordinary man” rather than a scientist at Yale University (Milgram, 1974). |
At times, conformity occurs in a relatively spontaneous and unconscious way. Robert Cialdini and colleagues (1990) found that university students were more likely to throw litter on the ground themselves when they had just seen another person throw some paper on the ground. Clara Michelle Cheng and Tanya Chartrand (2003) found that people unconsciously mimicked the behaviours of others, such as by rubbing their face or shaking their foot.
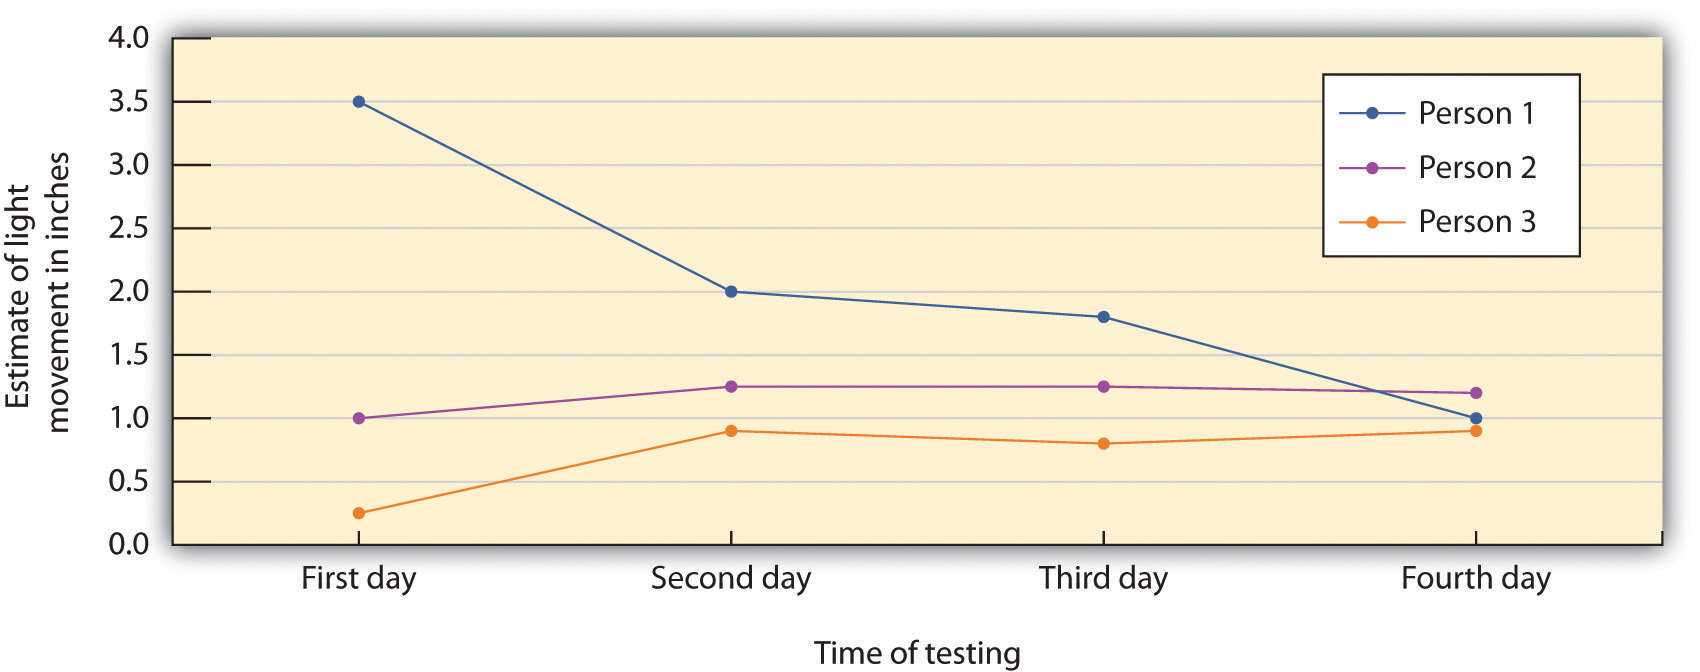
Muzafer Sherif (1936) studied how norms develop in ambiguous situations. In one experiment, college students were in a dark room with a single light point. They had to say how much the light seemed to move each time it turned on. The apparent movement happens due to eye movements. Each person in the group spoke their answer aloud in a different random order. Sherif discovered a conformity effect. Over time, group members’ responses became more similar, and after four days, they settled on a common norm. When interviewed later, participants said they didn’t realise they were conforming.
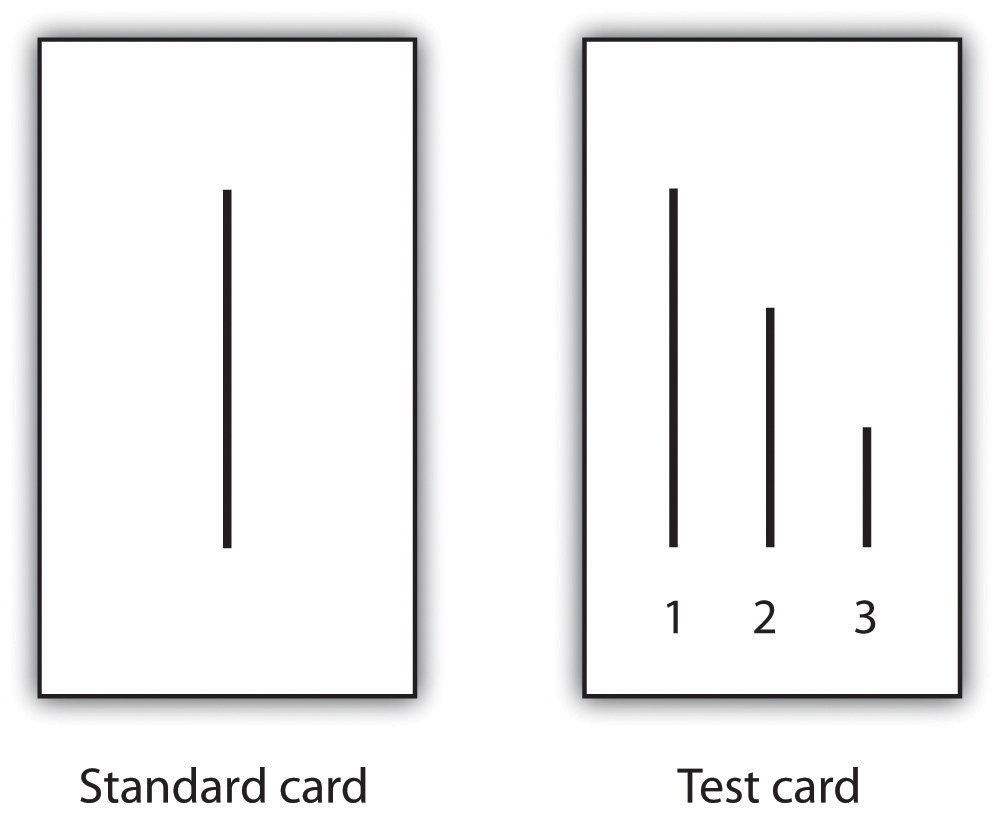
In the research of Solomon Asch (1955), male university students participated in what they thought was a test of visual abilities. Seated in front of a board with visual stimuli, they had 18 trials. Each trial presented two cards, and participants had to compare a single line on the standard card with three lines on the test card (Figure SL.12). The judgments that group members were asked to make were not ambiguous at all. Yet, their results still showed a strong conformity effect. The group answered aloud, proceeding from one end to the other. Unbeknownst to the real participant, other members were experimental confederates. A confederate is not a genuine participant but plays a specific role as directed by the researchers. On some trials, all confederates purposely chose the wrong answer. For example, even though the correct answer was Line 1, they would all say it was Line 2. Thus, when it became the participant’s turn to answer, they could either give the clearly correct answer or conform to the incorrect responses of the confederates. About 76% of the 123 men gave at least one incorrect response, showing the power of conformity. However, 24% never conformed, and only 5% conformed on all 12 critical trials. The following YouTube link provides a demonstration of Asch’s line studies.
Watch this video: The Asch Line Study – Conformity Experiment (6 minutes)
“The Asch Line Study – Conformity Experiment” video by Practical Psychology is licensed under the Standard YouTube licence.
Stanley Milgram’s (1974) studies explored obedience, the tendency to conform to authority. He designed a test to see whether people would listen to someone acting like an authority figure, even if it meant doing harm to others. He recruited men (and, in one of his studies, women) from diverse backgrounds through newspaper ads. Participants met a “fellow participant,” who was actually a confederate working with the experimenter. Participants were told that the research aimed to study punishment effects on learning. One of them would be the teacher, and the other the learner. They were each given a slip of paper, asked to open it, and indicate what it said. Both were labeled as “teachers,” ensuring the real participant was always the teacher. The learner was taken to a shock room and strapped to an electrode. The teacher’s task was to read word pairs, with the learner remembering which words went together. For example, if the word pair was “blue sofa,” the teacher would say the word “blue” on the testing trials, and the learner would have to indicate which of four possible words — “house,” “sofa,” “cat,” or “carpet” — was the correct answer by pressing one of four buttons in front of them. Before they started the experiment, the teacher first received a mild shock to demonstrate that the shocks really were painful. The participant read words to the learner, then started the test. The learner sat in another room. The experimenter, standing behind the teacher, told them to give shocks to the learner for each mistake. The shock level increased with every mistake, making each shock stronger.

Once the learner (the confederate) was alone in the other room, he unstrapped himself from the shock machine and brought out a tape recorder that he used to play a prerecorded series of responses that the teacher could hear through the wall of the room. The teacher heard the learner say “ugh!” after the first few shocks. After the next few mistakes, when the shock level reached 150 volts (V), the learner was heard to exclaim, “Let me out of here. I have heart trouble!” When the shock hit around 270 volts, the learner’s protests got stronger. After 300 volts, the learner said they wouldn’t answer any more questions. From 330 V and up, the learner was silent. The experimenter responded to participants’ questions, if any, with a scripted response indicating that they should continue reading the questions and applying increasing shock when the learner made a mistake or did not respond.
The results of Milgram’s research were quite shocking. Although some participants refused to continue after about 150 V despite the insistence of the experimenter’s demands, 65% of the participants gave the shock to the learner all the way up to the 450 V maximum. Note that the shock at this level was marked as “danger: severe shock” and no response had been heard from the participant for several trials. In other words, over half of the participants shocked another person to death.
In case you are thinking that such high levels of obedience would not be observed in today’s modern culture, there is evidence that they would. Milgram’s findings were almost exactly replicated, using men and women from a wide variety of ethnic groups, in a study conducted in the first decade of this century at Santa Clara University (Burger, 2009). In this replication of the Milgram experiment, 67% of the men and 73% of the women agreed to administer increasingly painful electric shocks when an authority figure ordered them to do so. The participants in this study were not, however, allowed to go beyond the 150 V shock switch.
While it might seem like Burger’s and Milgram’s experiments show that people are naturally bad and willing to harm others, the behaviour is more about the social situation than the people themselves. When Milgram created variations on his original procedure, he found that conformity was significantly reduced (a) when people were allowed to freely choose their shock level, (b) when the experimenter communicated by phone from another room, and (c) when they noticed another teacher refuse to give the shock.
Further argument of the power of role expectations was given in the infamous Stanford Prison Experiment. Philip Zimbardo and colleagues (Haney et al., 1973; Zimbardo, n.d.) designed a study that randomly assigned male university students to the roles of prisoner or guard in a simulated prison located in the basement of a building at Stanford University. The study was set to run for two weeks. The “prisoners” were picked up at home by real police officers and subjected to a variety of humiliating procedures designed to replicate real-life arrest procedures. The “guards” were given uniforms, nightsticks, and mirror sunglasses and were encouraged to act out their roles authentically. Within a short period of time, the prisoners began to experience mental and physical distress, while some of the guards became punitive and cruel. The study had to be ended in only six days.
The Stanford Prison Experiment results have been widely reported for nearly 50 years as evidence that situational requirements can be powerful in eliciting behaviour that is out of character. However, a recent investigation by Le Texier (2019) has challenged these conclusions. For example, the prison guards in fact were given specific instructions about the treatment of the prisoners. The guards considered themselves research assistants and did not know that they were also subjects. The prisoners were not allowed to leave at the beginning. Given the importance of the Stanford Prison Experiment in psychology, it is surprising that Le Texier’s (2019) review is the first to do a thorough examination of all of the archival material. The Stanford Prison Experiment is a good example for showing how biased research can lead to unjustified conclusions. You are encouraged to visit the Stanford Prison Experiment website, and then to read Le Texier’s re-examination of its conclusions.
Conformity typically occurs as an impact of the majority. However, there are cases in which the minority is able to create conformity. For example, Charlan Nemeth and Julianne Kwan’s (1987) research shows that exposure to dissenting minority viewpoints can positively impact decision-making. It is a good thing that minorities can be influential; otherwise, the world would be pretty boring indeed.
The research that we have discussed to this point suggests a powerful conformity effect, but it is not always the case that we blindly conform. Sometimes people don’t conform, especially when they think someone is trying to control them. If they believe their freedom is at risk but can still push back, they might feel strongly against the desires of the influencer. This resistance is called psychological reactance (Brehm, 1966). James Pennebaker and Deborah Sanders (1976) attempted to get people to stop writing graffiti on the walls of campus restrooms. In the first group of restrooms, they put a sign that read, “Do not write on these walls under any circumstances” whereas in the second group they placed a sign that simply said, “Please don’t write on these walls.” Two weeks later, the researchers returned to the restrooms to see if the signs had made a difference. They found that there was significantly less graffiti in the second group of restrooms than in the first one. Reactance represents a desire to restore freedom that is being threatened. A child who feels that their parents are forcing them to eat asparagus may react with a strong refusal to touch the plate. An adult who feels that they are being pressured by a car salesperson might feel the same way and leave the showroom entirely.
Image Descriptions
Figure SL.8. Social Loafing image description:
| Number of men pulling | Actual weight pulled | Expected weight pulled |
|---|---|---|
| 1 | 80 pounds | 80 pounds |
| 2 | 140 pounds | 145 pounds |
| 3 | 180 pounds | 205 pounds |
| 8 | 275 pounds | 560 pounds |
Figure SL.9. Groupthink image description: A flowchart that identifies the flow of the causes and outcomes of groupthink.
- Antecedent conditions
- Time pressures and stress
- High cohesiveness and social identity
- Isolation from other sources of informatioin
- Directive, authoritative leadership
- Symptoms of groupthink
- Illusions of invulnerability
- Illusions of unanimity
- In-group favouritism
- Little search for new information
- Belief in morality of the group
- Pressure on dissenters to conform to group norms
- Poor decision making [Return to Figure SL.9]
Figure SL.10. Prisoner’s Dilemma image description:
If both Malik and Frank don’t confess, they each get three years in prison. If only one of them confesses, the confessor gets no years in prison while the person who did not confess gets 30 years in prison. If they both confess, they each get 10 years in prison. [Return to Figure SL.10]
Image Attributions
Figure SL.7. Operating Room by John Crawford is in the public domain; Revision 3’s Friday Afternoon Staff Meeting by Robert Scoble is used under a CC BY 2.0 license.
Figure SL.8. Figure 7.15 as found in Psychology – 1st Canadian Edition is licensed under a CC BY-NC-SA License.
Figure SL.9. Figure 7.16 as found in Psychology – 1st Canadian Edition is licensed under a CC BY-NC-SA License.
Figure SL.10. Figure 7.18 as found in Psychology – 1st Canadian Edition is licensed under a CC BY-NC-SA License.
Figure SL.11. Figure 7.17 as found in Psychology – 1st Canadian Edition is licensed under a CC BY-NC-SA License.
Figure SL.12. Figure 7.11 as found in Psychology – 1st Canadian Edition is licensed under a CC BY-NC-SA License.
Figure SL.13. Figure 7.12 as found in Psychology – 1st Canadian Edition is licensed under a CC BY-NC-SA License.
To calculate this time, we used a reading speed of 150 words per minute and then added extra time to account for images and videos. This is just to give you a rough idea of the length of the chapter section. How long it will take you to engage with this chapter will vary greatly depending on all sorts of things (the complexity of the content, your ability to focus, etc).

