Chapter 3. Psychological Science
Designing Research in Psychology
Amelia Liangzi Shi
Approximate reading time: 48 minutes
Learning Objectives
After reading this chapter, you will be able to:
- Describe the different research methods used by psychologists
- Discuss the strengths and weaknesses of case studies, naturalistic observation, surveys, and archival research
- Contrast correlation and causation
Researchers have different research designs to choose from when testing their predictions. A research design is the specific way a researcher collects, analyzes, and interprets data. Psychologists mainly use three types of research design, and each is crucial for scientific investigation. Descriptive research aims to give a snapshot of the present situation. It includes case studies, surveys and tests, naturalistic observation, and laboratory observation. It helps researchers understand what is happening at a given time. Correlational research, on the other hand, aims to find relationships between and among two or more variables. It helps researchers see how variables might be related to each other. Experimental research, the third type, is focused on assessing cause and effect. By conducting experiments, researchers can determine if one variable directly influences another.
Descriptive Research
In 2011, the New York Times published a feature story on Krista and Tatiana Hogan, Canadian twins. These particular twins are unique because Krista and Tatiana are conjoined twins, connected at the head. There is evidence that the two girls are connected in a part of the brain called the thalamus, which is a major sensory relay centre. Most incoming sensory information is sent through the thalamus before reaching higher regions of the cerebral cortex for processing. The potential connection in their brains suggests that one twin might feel the sensations of the other (Egnor, 2017). For example, if Krista finds something funny on TV, Tatiana might smile or laugh, even if she isn’t watching the show. This has caught the attention of neuroscientists who want to understand how the brain handles sensory information. Since their condition is very rare, it is likely that as long as their family agrees, scientists will follow these girls very closely throughout their lives to gain as much information as possible (Dominus, 2011). Watch this CBC video to learn more about Krista and Tatiana’s lives.
In descriptive research, researchers are conducting a case study when they focus on one person or just a few individuals, to gain an in-depth understanding of the individuals and the particular phenomenon being studied. Case studies allow researchers to describe what could happen. Sometimes a single case may challenge the validity of an existing theory. However, case studies bring some challenges when it comes to interpreting the data. This method is often used to study individuals with rare characteristics. Therefore, the individuals who serve as the focus of case studies are not like most other people. If scientists ultimately want to explain all behaviour, focusing attention on such a special group of people can make it difficult to generalise any observations to the larger population as a whole. Generalisation refers to the ability to apply the findings of a particular research project to larger segments of society. Again, case studies provide enormous amounts of information, but since the cases are so specific, the potential to apply what’s learned to the average person may be very limited.
The data from descriptive research projects can also come in the form of a survey. Surveys are lists of questions to be answered by research participants and can be delivered as paper-and-pencil questionnaires, administered electronically, or conducted verbally in forms of interviews.
?\". The media mentioned are books, games, internet, magazine, music, newspaper, radio, and TV.")
Surveys help researchers collect information from a larger group of people than other research methods. The people chosen to participate in the research, known as the sample, are selected to be representative of all the people that the researcher wishes to know about, known as the population. Researchers study the sample to make generalisations about the population. The representativeness of samples is enormously important. For example, a representative sample of Canadians must reflect Canada’s demographic make-up in terms of age, sex, gender orientation, socioeconomic status, ethnicity and cultural backgrounds, and so on. Research based on unrepresentative samples is limited in generalisability, meaning it will not apply well to anyone who was not represented in the sample.
Historically, psychological researchers have been publishing results collected entirely from Western, Educated, Industrialized, Rich, and Democratic (WEIRD) samples, probably with an assumption that there is little variation across human populations. However, the majority of the world’s population is not WEIRD. Henrich and colleagues (2010) reviewed the databases across behavioural sciences and concluded that WEIRD samples are not representative for making generalisations about humans, particularly on some basic psychological processes, such as visual perception, reasoning, moral development, self-concepts, social abilities, and intelligence. Psychological researchers should strive to include more diverse groups of people in their studies, beyond just WEIRD samples, to ensure that their findings are more representative and generalisable to the entire spectrum of human experiences.
There are both strengths and weaknesses in using a survey when compared to case studies. Psychologists use surveys to measure a wide variety of behaviours, attitudes, opinions, and facts. By using surveys, we can collect information from a larger sample of people, more quickly. A larger sample is better able to reflect the actual diversity of the population, thus allowing better generalisability. These days, many surveys are available online, and they tend to be aimed at a wide audience. Statistics Canada is a rich source of surveys of Canadians on a diverse array of topics. Their databases are searchable and downloadable, and many deal with topics of interest to psychologists, such as mental health, wellness, and so on. Psychologists may use these existing databases, rather than conducting their own surveys, for their research. This is called archival research. Explore the Statistics Canada website and look for profiles of the marginalised populations in Canada, such as Indigenous People and non-permanent residents.
 A photograph shows stacks of paper files on shelves. (b) A photograph shows a computer on a desk.")
Even though survey data can be generalised to a large population more confidently than information from case studies, we cannot get as much detailed information about each person. There is another potential weakness of surveys – people might not always tell the truth or remember things correctly. They could answer questions in a way that they think makes them look good. For example, a study found that people’s answers in a tourism survey were affected by the nationality of the interviewer asking the questions (Dahlgren & Hansen, 2015).
Surveys are only useful if they are valid and reliable. Validity means a survey actually measures what you think it measures (e.g., participants’ results from a self-reported anxiety scale indeed indicate their level of anxiety). Reliability means a survey gives similar answers over time or in different situations. For example, if you take a test to measure your intelligence three times and get different scores each time, the test is not reliable. Psychometrics is a branch of psychology devoted to understanding not only how to demonstrate that tests and surveys are valid and reliable, but also how to improve them.
If you want to understand how behaviour occurs, one of the best ways to gain information is simply to observe the behaviour in its natural context. However, people might change their behaviour in unexpected ways if they know they are being observed. How do researchers obtain accurate information when people tend to hide their natural behaviour? For example, imagine your teacher asks the class who always donates money to charity when asked. Many might raise their hands, but do all of them actually do it? To find out, we have another option. We could place a charity donation box at the cashier and send a classmate to secretly watch if everyone donates money. But our observer should blend in, perhaps by standing at the cashier and pretending to do something while secretly taking notes. This type of research design is called naturalistic observation: observing behaviour in its natural setting.
It is critical that the observer be as unobtrusive as possible: when people know they are being watched, they are less likely to behave naturally. To better understand “peer exclusion,” Fanger and colleagues (2012) observed the behaviour of preschool children on a playground. How did the observers remain unobtrusive over the duration of the study? They equipped a few of the children with wireless microphones (which the children quickly forgot about) and observed while taking notes from a distance. Also, the children in that particular preschool (a “laboratory preschool”) were accustomed to having observers on the playground.
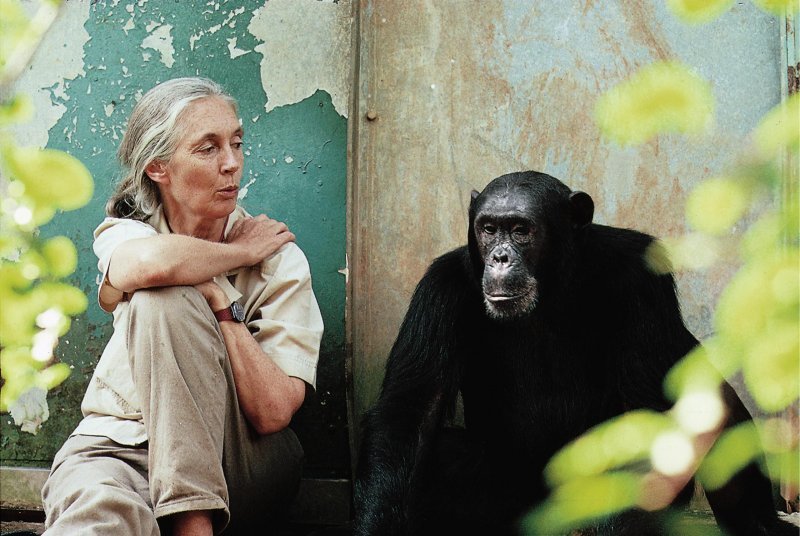
It should be pointed out that naturalistic observation is not limited to research involving humans. Scientists have used this technique to study social hierarchies and interactions among animals ranging from ground squirrels to gorillas. The information provided by these studies is invaluable in understanding how those animals organise socially and communicate with one another. The anthropologist Jane Goodall, for example, spent nearly five decades observing the behaviour of chimpanzees in Africa.
The greatest benefit of naturalistic observation is the validity of information collected unobtrusively in a natural setting. Having individuals behave as they normally would in a given situation creates a higher degree of ecological validity, or realism, than we might achieve with other research approaches. Therefore, our ability to generalise the findings of the research to real-world situations is enhanced. If we conduct the observation correctly, we need not worry about people or animals modifying their behaviour simply because they are being observed.
The major downside of naturalistic observation, however, is that they are often difficult to set up and control. In our charity donation study, what if you stood by the charity box all day, ready to record people’s donation behaviour, and no one came in? Or, what if you have been closely observing a troop of gorillas for weeks only to find that they migrated to a new place while you were sleeping in your tent? As a researcher you have no control of whether and when you have behaviour to observe.
Sometimes, researchers conducting observational research move out of the natural world and into a laboratory. In these cases, people are observed while engaging in set, specific tasks. Laboratory observation (also called structured or controlled observation) allows much more control over the situation and setting in which the participants will be observed. An excellent example of laboratory observation comes from the Strange Situation experiment by Mary Ainsworth. The Strange Situation experiment evaluates attachment styles that exist between an infant and caregiver. In this scenario, caregivers bring their infants into a room filled with toys. The Strange Situation experiment involves a number of phases, including a stranger coming into the room, the caregiver leaving the room, and the caregiver’s return to the room. The infant’s behaviour is closely monitored at each phase, but it is the behaviour of the infant upon being reunited with the caregiver that is most telling in terms of characterising the infant’s attachment style with the caregiver. Moving observation into a laboratory potentially reduces ecological validity – participants are less likely to behave naturally in the laboratory settings, so controlled observations may fail to capture the real-world behaviour.
Another potential problem in observational research is observer bias. Generally, people who act as observers are closely involved in the research project and may unconsciously skew their observations to fit their research goals or hypotheses. To protect against this type of bias, researchers should set clear criteria before collecting data, specifying the behaviours to be recorded and how those behaviours should be classified. In addition, researchers often compare observations of the same event by multiple observers, in order to test inter-rater reliability: a measure of reliability that assesses the consistency of observations by different observers.
Correlational Research
Correlation means that there is a relationship between two or more variables (such as height, weight, shoe size, and hours of sleep), but this relationship does not necessarily imply cause and effect. When two variables are correlated, it simply means that as one variable changes, so does the other. We can measure correlation by calculating a statistic known as a correlation coefficient. A correlation coefficient is a number from -1 to +1 that indicates the strength and direction of the relationship between variables. The correlation coefficient is usually denoted by the letter r.
The number portion of the correlation coefficient indicates the strength of the relationship. The closer the number is to 1, the more strongly related the variables are, and the more predictable changes in one variable will be as the other variable changes. The closer the number is to zero, the weaker the relationship, and the less predictable the relationships between the variables. For instance, a correlation coefficient of 0.9 indicates a far stronger relationship than a correlation coefficient of 0.3, and a correlation coefficient of +0.9 is as strong as a correlation coefficient of -0.9. If the variables are not related to one another at all, the correlation coefficient is 0.
The sign—positive or negative—of the correlation coefficient indicates the direction of the relationship. A positive correlation means that the variables move in the same direction. Put another way, it means that as one variable increases so does the other, and conversely, when one variable decreases so does the other. A negative correlation means that the variables move in opposite directions. If two variables are negatively correlated, a decrease in one variable is associated with an increase in the other and vice versa.
As an illustration, we might expect a positive correlation between a person’s height and weight, and conversely, we might predict a negative correlation between tiredness during the day and the hours of sleep from the night before – when tiredness ratings are high, sleep time from the night before is low. Remember, a negative correlation does not mean there is no connection at all. Manipulate this interactive scatterplot to practice your understanding of positive and negative correlation.

Correlational research designs are often used by psychological researchers as they are affordable, time-efficient, and usually can be conducted without much equipment. Online survey platforms have made data collection easier than ever. Correlational research does not even necessitate collecting data if researchers have access to archival databases. We can also use correlational designs to make predictions. For example, if you’re on a team that decides who gets into a graduate program, and there are lots of applications but only a few spots, you could use correlations between current students’ GPA and their scores on standardized tests like the GRE or GMAT to predict which applicants might succeed in the graduate program.
Correlational results can suggest new directions for further research, but such information tells us little about cause and effect; in other words, we cannot know what causes what in correlational research. Consider a researcher who hypothesizes violent TV causes more aggressive play in children. They collect data from Grade 4 children on Variable 1: the hours of violent TV shows watched by each child weekly and Variable 2: how aggressively each child plays on the school playground. A positive correlation between Variable 1 and Variable 2 appears to support the researcher’s hypothesis, but it cannot be taken to indicate that viewing violent television causes aggressive behaviour, as other explanations exist: aggression at school might lead to violent TV preference, or a third variable, such as parenting style, could influence both variables. For example, permissive parents might permit violent TV and be less strict about children’s aggressive actions.

To recap, whenever we find a correlation between two variables, X and Y, that is not zero, there are three possible ways of explaining this result: (1) X might cause Y; (2) Y might cause X; (3) some uninvestigated third variables (e.g., Z) might cause both X and Y. For the below examples, can you provide three different interpretations? In each case, identify variables X, Y, and Z:
- A positive correlation between dark chocolate consumption and health.
- A negative correlation between sleep and smartphone use.
- A positive correlation between self confidence and test scores.
A negative association between time spent exercising and consumption of junk food.Unfortunately, people mistakenly make causal conclusions from correlational findings all the time. For example, recent research found that people who eat cereal on a regular basis achieve healthier weights than those who rarely eat cereal (De La Hunty & Ashwell, 2007; Frantzen et al., 2013). Guess how the cereal companies report this finding. Does eating cereal really cause an individual to maintain a healthy weight, or are there other possible explanations, such as, someone at a healthy weight is more likely to regularly eat a healthy breakfast than someone who avoids meals in an attempt to diet? Again, correlation does not mean causation. The only way to establish that there is a cause-and-effect relationship between two variables is to conduct a scientific experiment.
Experimental Research
The goal of experimental research design is to provide potential explanations about the causal relationships among the variables. The most basic experimental design involves two groups: the experimental group and the control group. The two groups are designed to be the same except for one difference — experimental manipulation: the experimental group gets the treatment being tested and the control group does not. Since experimental manipulation is the only difference between the experimental and control groups, we can be sure that any differences between the two are due to experimental manipulation rather than by chance.
To investigate the relationship between observed aggression and imitated aggressive behaviour in children, our experimental manipulation will be to allow children to observe an adult modeling aggressive behaviour. We might have the children in our experimental group play in a room where they are able to observe adults playing aggressively with toys, hitting, pushing and yelling at them. The study we are describing here is actually a simplified version of Bandura and colleagues’ (1961) famous Bobo doll study.

In our experimental condition, children will observe an adult playing with the Bobo doll in an aggressive way, whereas children assigned to our control condition will see the adult playing with the doll in a non-aggressive way. The two conditions will be the same in all other ways, such as children’s gender ratio, the adult model’s gender, the location of the Bobo doll in the room, and the length of time for observation. At the beginning of our experiment, we must randomly assign the participants into these two conditions. This is called manipulation of the independent variable. With the current design, we only have one independent variable – the type of behaviour observed by the children, which varies across two conditions: experimental (aggressive) and control (non-aggressive). We may also include a second independent variable – the match between the adult model’s gender and the child observer’s gender. However, since researchers cannot use random assignment to manipulate many variables, such as gender, age, cultural background, and educational level, we don’t use the word “manipulate” for these participant variables. Instead, we “compare” the condition when the model’s gender matches the child’ gender (e.g., assigning a female model to a female observer) and the condition when their genders are unmatched (e.g., assigning a male model to a female observer). We also need to identify and measure our dependent variables. The dependent variable is the outcome on the measure of interest that is dependent on the actions of the independent variable. In our example, the dependent variable is the number of modelled aggressive behaviours our participants imitate.
One of the most important parts of a scientific study is having a clear description of how each variable is measured. Researchers often create different operational definitions of the same variable. In our Bobo doll study, we need to decide how we can measure aggression, which could be described in a variety of ways. For example, one might define aggression as a destructive tendency caused by frustration. Then we could measure aggression by asking how frustrated participants feel. Self-report is often used when the variable is not externally observable. Alternatively, we may operationally define aggression with physiological measures; we can test participants’ physiological arousal (such as heart rate or blood pressure) in response to a frustrating situation. For the purposes of our current experiment, we could define aggressive behaviour as overt actions that have the potential to cause harm to the Bobo doll, including kicking the doll, throwing it, or saying things like “stupid doll,” which imitate our adult models’ aggressive behaviour observed earlier. In this case, we are using behavioural measures.
To illustrate how complicated operational definitions can be, let’s look at another variable investigated in the original Bobo doll study. Bandura and colleagues were not only interested in whether children would imitate aggressive behaviours, they also wanted to know if observing same-sex adults would have a greater impact on children’s behaviour than observing adults of a different sex. To clarify, we now use “sex” to refer to the different biological categories people might fit into, while “gender” refers to the socially constructed characteristics we assign to those categories and is something an individual must define for themselves.
- Option 1 – Behavioural Measures. In this approach, researchers would record “sex” based on their visual assessment of the clothed participant. This might work for many individuals, but it may not be generalised to a broader population. There are female humans with beards, male humans without Adam’s apples, and of course, transgender, non-binary, and intersex people whose bodies may not fit these assumed categories.
- Option 2 – Archival Data. Sex may be assessed simply by looking at participants’ medical records or birth certificates. However, biological sex assignment of infants at birth is often based on a visual assessment of external genitals, which is used to categorise the infant as “male” or “female.” A larger problem is that this method of sex assignment at birth has been incredibly harmful to intersex people.
- Option 3 – Self-Report. To avoid the issues described above, it may seem reasonable to ask participants to self-identify. However, the validity of self-report is reliant upon the researchers providing appropriate categories (e.g., has intersex been included as an option) and the participant being truthful. Participants may not readily volunteer this information.
- Option 4 – Physiological Measures. The biological sex of an individual is determined by more than their external genitals. Some other determinants of biological sex include the internal gonads (ovaries or testes), predominant hormones (testosterone or estrogen), and chromosomal DNA (e.g., XX, XY). Physiological measures may provide the most objective, reliable, and valid data compared to other methods. The biggest challenge of using physiological measures is that researchers must have the knowledge to choose the proper device and interpret the data.
It is worth exploring the details of the methods to understand how researchers have actually measured biological sex and whether their approach may impact the validity of their conclusions. In the original Bobo doll study, participants were divided into male-female categories. There is no mention of biological measures being taken so we can assume that sex categorisation was based on visual assessment or by report from the children’s parents.
We know now that this is not an accurate way to measure biological sex, so we should consider why sex was even included in the experiment. Given that children were found to perceive their parents as having preferences for them to behave in ‘sex appropriate’ ways (e.g., girls playing with dolls and boys playing with trucks), the researchers hypothesized their participants would be more likely to imitate the behaviour of a same-sex model than a model of a different sex. They were interested in the effect that socially reinforced gender roles would have on imitated behaviour, so the assumed sex of the children was all that mattered, as this would determine what behaviours would be discouraged or reinforced by adults. It’s ok that no biological measures were taken for this study because biological sex wasn’t actually relevant, but terms like sex and gender have often been used interchangeably in research, so it’s important to think critically about how constructs are being operationally defined and measured. If Bandura and colleagues were to replicate this study today, we should hope that they would be more accurate and specific with their terminology and use something like “assumed sex/gender” rather than “sex” to refer to the variable they were interested in. After all, this kind of specificity in language allows for more accurate understanding and replication, which can increase our confidence in their original conclusion.
Manipulating the independent variable causes the change of the dependent variable. In other words, the dependent variable depends on the independent variable. In our Bobo doll study, the children observing aggressive behaviour will act aggressively and the children observing non-aggressive behaviour will not act aggressively.

As we know, we can only say that observing an adult’s aggressive behaviour is the cause of children’s aggression if it is the only difference between the experimental and control groups. This means we must control all the confounding variables that may also influence the study’s results.
Now, let’s explore some examples of confounding variables. To begin with, participants must be randomly assigned to the conditions so that there are no differences between the groups. This should also be a single-blind procedure – participants are unaware as to which group they are in (experiment or control group) while the researcher who developed the experiment knows which participants are in each group.
Ideally, the people who count imitated behaviours are unaware of who was assigned to the experimental or control group, in order to control for experimenter bias. Experimenter bias refers to the tendency that a researcher might interpret the results in favour of their hypotheses. If the observers know which child is in which group, it will influence how they interpret ambiguous responses, such as squeezing the doll. With the double-blind procedure, both the researchers and the participants are blind to group assignments, which allows us to control for both experimenter and participant expectations.
A well-known example of the power of expectations is the placebo effect. The placebo effect occurs when people’s expectations or beliefs influence their experience in a given situation. In other words, simply expecting something to happen can actually make it happen. As a result, we might use a placebo control, where the only difference between the experimental condition and the control condition is the critical treatment. In medical research, a placebo is a type of medication that looks like the real drug but is actually chemically inert, sometimes referred to as a “sugar pill.” The placebo control is necessarily followed by a single/double-blind procedure. If participants know whether they have received the drug, we will not be able to tell whether the effects were due to expectations about drug efficacy or to the actual drug. Similarly, if the researchers know which participants are receiving the drug, they may treat participants differently, which will alter the way participants respond.

Researchers may manipulate independent variables between subjects or within subjects. In a between-subject design, participants are randomly assigned to one of the conditions. This way, we can assume the experimental group and the control group are equivalent prior to experimental manipulation. Alternatively, we may ask each participant to fulfill all the conditions. This is called a within-subject design. For example, suppose that you are preparing for an exam and want to find out which method leads to a better recall: A, reading the material aloud by yourself or B, listening to someone read it to you. To compare these two methods, you can memorise a short essay using Method A and take a test on it; then, memorise another short essay using Method B, and test it. Within-subject designs are less affected by individual differences among participants because the participants are compared to themselves. In addition, fewer participants are required because each participant will provide data for all the conditions. However, if researchers use within-subject design, they must control the possible confounding variables by counterbalancing the sequence of conditions. For example, half of participants first experience Treatment A and then Treatment B, while the other half experience Treatment B first and then Treatment A. In many cases, within-subject design is not feasible. Take our Bobo doll study for instance. Once the children learn how to play with the doll aggressively, can they unlearn the behaviour?
In contrast to correlational research, experimental designs have two very nice features. For one, they guarantee that the independent variable occurs prior to the measurement of the dependent variable. This eliminates the possibility of reverse causation. Second, the influence of confounding variables is controlled, and thus eliminates the possibility that the confound caused the results, not the independent variable.
Despite the advantage of determining causation, experiments do have limitations. One is that they are often conducted in laboratory situations rather than in the everyday lives of people. Therefore, we do not know whether results that we find in a laboratory setting will necessarily hold up in everyday life. Often researchers are forced to balance the need for experimental control with the use of laboratory conditions that can somewhat mimic real life. Additionally, it is very important to understand that a large proportion of psychology research is not experimental for a variety of practical and ethical reasons. For example, examining the effect of eating on development can’t be tested in a lab as it would be unethical to have one group eat while another group doesn’t, and then see the difference present.
Summary
The Table PS.1 summarises the strengths and weaknesses for each type of research.
| Research Design | Advantages | Disadvantages |
|---|---|---|
| Descriptive | Provides a relatively complete picture of what is occurring at a given time. Allows the development of questions for further study. | Does not assess relationships among variables. Cannot be used to draw inferences about cause and effect. |
| Correlational | Allows testing of expected relationships between and among variables and the making of predictions. Can assess these relationships in everyday life events. | Cannot be used to draw inferences about cause and effect. |
| Experimental | Allows conclusions to be drawn about the causal relationships among variables. | Cannot experimentally manipulate many important variables. May be unethical or time-consuming. |
Table adapted from Stangor (2011).
Watch this video: Psychological Research: Crash Course Psychology #2 (11 minutes)
“Psychological Research: Crash Course Psychology #2” video by CrashCourse is licensed under the Standard YouTube licence.
Image Attributions
Figure PS.3. “Gizmodo Survey – Media” by avlxyz is licensed under CC BY-SA 2.0.
Figure PS.4. Credit “paper files”: modification of work by “Newtown graffiti”/Flickr licensed under a CC BY 2.0 license; “computer”: modification of work by INPIVIC Family/Flickr licensed under a CC BY 2.0 license.
Figure PS.5. From Jane Goodall, by M. Neugebauer, n.d. (https://denstoredanske.lex.dk/Jane_Goodall by Michael Neugebauer, courtesy of The Jane Goodall Institute). Public Domain image.
Figure PS.6. Figure 2.12 as found in Psychology 2e by OpenStax is licensed under a CC BY 4.0 license.
Figure PS.7. Original image created for this text and is under a CC BY-NC-SA license.
Figure PS.8. “Bobo doll” by Sémhur, TilmannR is licensed under CC BY-SA 4.0.
Figure PS.9. Bobo Doll Deneyi by Okhanm from Wikimedia Commons, licensed under a CC BY-SA 4.0 license.
Figure PS.10. “Cebocap” from the National Institute of Health, donated by Elaine and Arthur Shapiro, is in the public domain.
To calculate this time, we used a reading speed of 150 words per minute and then added extra time to account for images and videos. This is just to give you a rough idea of the length of the chapter section. How long it will take you to engage with this chapter will vary greatly depending on all sorts of things (the complexity of the content, your ability to focus, etc).
