Chapter 10. Intelligence and Language
Defining and Measuring Intelligence
Dinesh Ramoo
Approximate reading time: 38 minutes
Learning Objectives
By the end of this section, you will be able to:
- Define intelligence and list the different types of intelligences that psychologists study.
- Summarise the characteristics of a scientifically valid intelligence test.
- Describe how IQ is normally distributed.
- Outline the biological and environmental determinants of intelligence.
Psychologists have long debated how best to conceptualise and measure intelligence (Sternberg, 2003a). These questions include how many types of intelligence there are, the role of nature versus nurture in intelligence, how intelligence is represented in the brain, and the meaning of group differences in intelligence.
General versus specific intelligences
Many psychology textbooks suggest that the first intelligence tests were developed in France during the early 20th century. However, the earliest known intelligence tests were actually conducted 3,000 years ago in China, where people wrote essays to determine whether they would be hired as a civil servant (a civil servant is someone appointed to work for any level of government). The tests were later expanded to include problem solving questions similar to some modern-day intelligence tests (Saklofske et al., 2015). It was not until the 20th century, that intelligence testing came to the Western world. In France in 1905, self-trained psychologist, Alfred Binet, and a doctor, Theophile Simon, developed one of the first Western intelligence tests—the Binet-Simon Scale. They hoped that it could be used to identify students who might struggle in school with the aim of providing additional support (Gredler, 2020). Binet conceptualised intelligence as the ability to engage in focused, but flexible thinking, and so the test questions consisted of basic everyday problems designed to evaluate attention, memory, and verbal skills (Guthrie, 1998; National Institutes of Health, 2014). However, Binet warned that this measure could only be considered a test of intelligence if comparisons were made among children from similar backgrounds, because disparities in education or socioeconomic status (SES) would affect the scores (Guthrie, 1998).
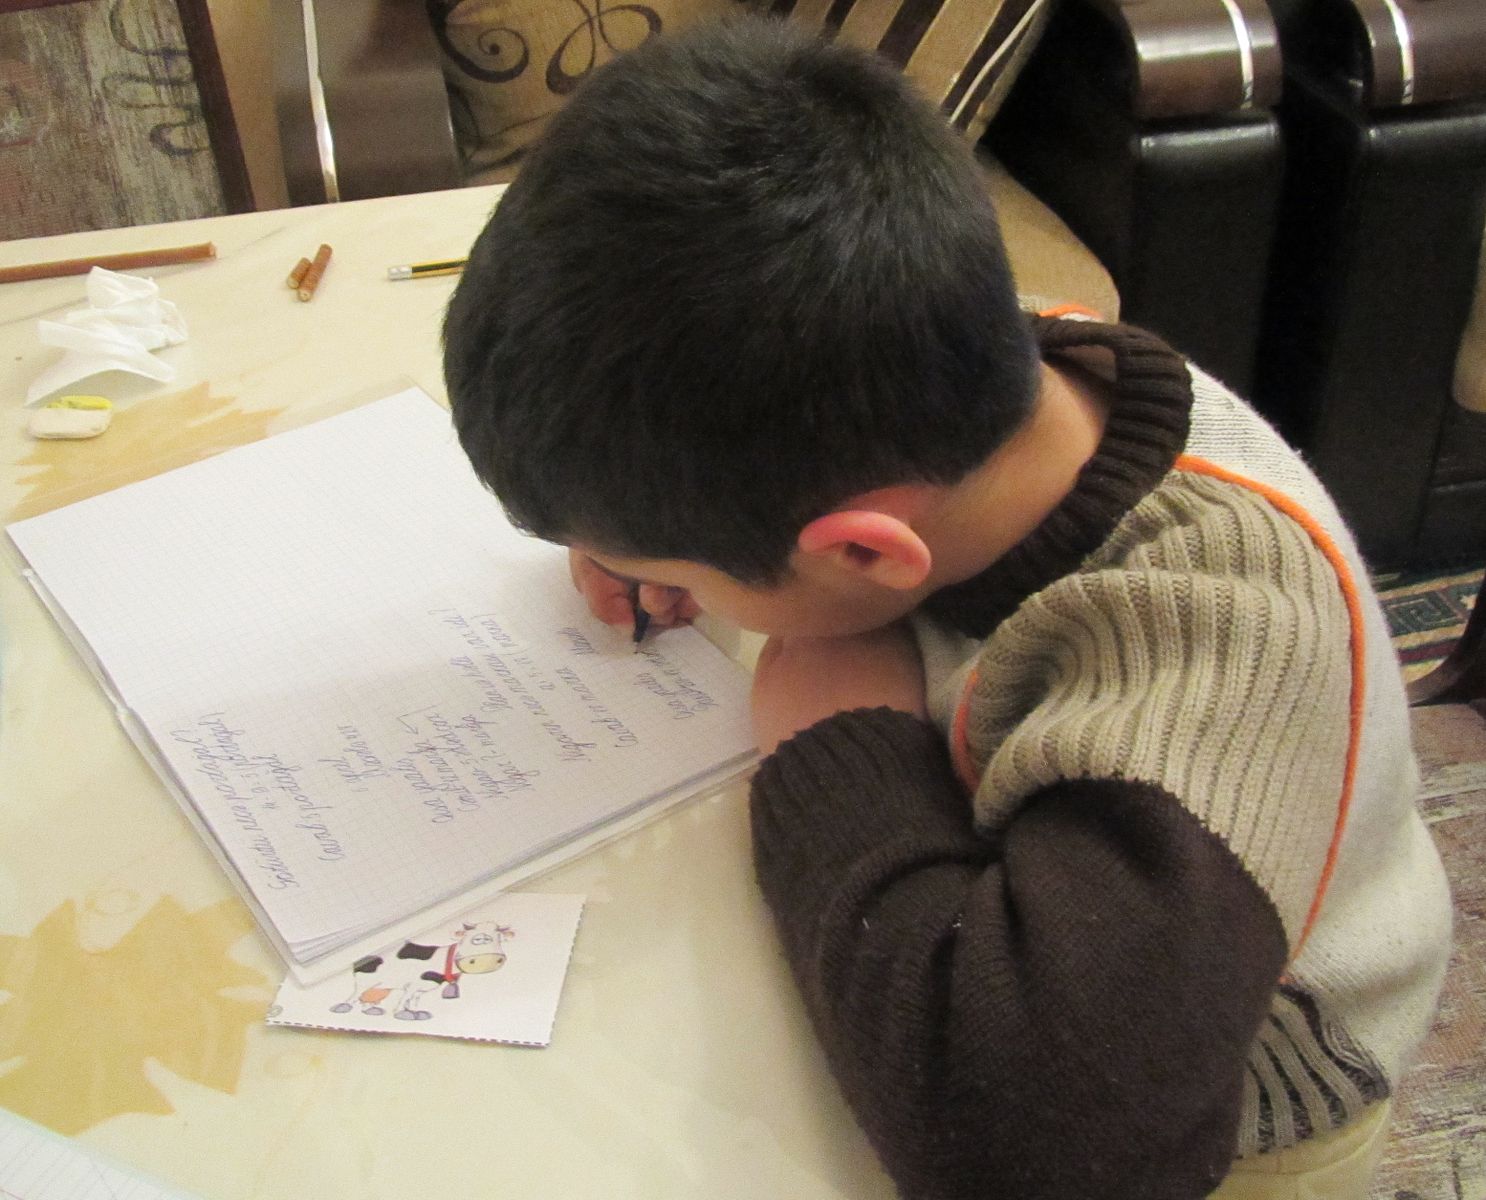
The goal was to help teachers better educate these two groups of students. Binet and Simon developed what most psychologists today regard as the first intelligence test (Figure IL.1), which consisted of a wide variety of questions that included the ability to name objects, define words, draw pictures, complete sentences, compare items, and construct sentences.
Binet and Simon (1915; Siegler, 1992) believed that the questions they asked their students, even though they were on the surface dissimilar, all assessed the basic abilities to understand, reason, and make judgments. It turned out that the correlations among these different types of measures were, in fact, all positive; students who got one item correct were more likely to also get other items correct, even though the questions themselves were very different.
On the basis of these results, psychologist Charles Spearman (1863–1945) hypothesized that there must be a single underlying construct that all of these items measure. Spearman called the construct that the different abilities and skills measured on intelligence tests that they have in common the general intelligence factor (g). Virtually all psychologists now believe that there is a generalised intelligence factor, g, that relates to abstract thinking and that includes the abilities to acquire knowledge, to reason abstractly, to adapt to novel situations, and to benefit from instruction and experience (Gottfredson, 1997; Sternberg, 2003a). People with higher general intelligence learn faster. This may be due to the fact that g is a combination of a number of specific abilities (s). These specific abilities include working memory,recall, and encoding abilities.
Soon after Binet and Simon introduced their test, American psychologist Lewis Terman (1877–1956) developed an American version of Binet’s test that became known as the Stanford-Binet Intelligence Test. The Stanford-Binet is a measure of general intelligence made up of a wide variety of tasks including vocabulary, memory for pictures, naming of familiar objects, repeating sentences, and following commands.
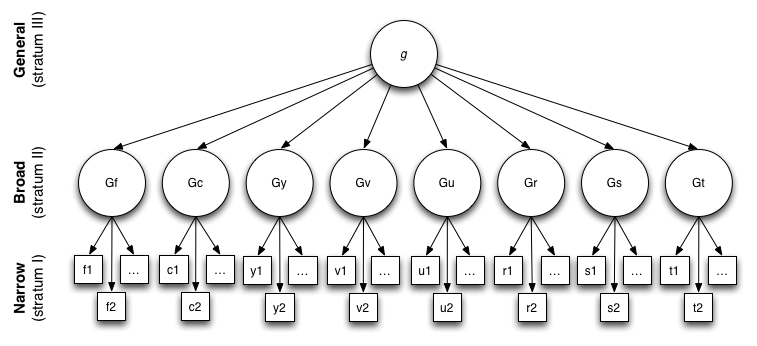
Although there is general agreement among psychologists that g exists, there is also evidence for specific intelligence (s), which is a measure of specific skills in narrow domains. One empirical result in support of the idea of s comes from intelligence tests themselves. Although the different types of questions do correlate with each other, some items correlate more highly with each other than do other items; they form clusters or clumps of intelligences. As seen in Figure IL.2, Carroll (1993) argued for three levels for cognition: narrow abilities, broad abilities, and general abilities. The last level refers to the general intelligence factor or g. If we are going to use levels to align with the figure, we need to also include examples of narrow abilities.
Broad abilities include:
-
- General memory and learning (Gy)
- Comprehension-Knowledge (Gc): the breadth and depth of one’s acquired knowledge.
- Fluid intelligence (Gf): the ability to reason and solve problems using new information.
- Crystalized intelligence: the ability to solve problems using past experience.
- Quantitative knowledge (Gq): the ability to comprehend quantitative concepts and manipulate quantitative knowledge (Flanagan et al., 2007). Quantitative knowledge includes numerical abilities such as addition and multiplication.
- Reading & Writing Ability (Grw): the ability to read and write.
- Short-Term Memory (Gsm): the ability to hold information temporarily in short-term memory.
- Broad Retrieval Ability (Gr): the ability to store information and retrieve it.
- Broad Visual Perception (Gv): the ability to perceive, analyze, synthesize, and think with visual information.
- Broad Auditory Processing (Gu): the ability to analyze, synthesize, and discriminate auditory information.
- Broad cognitive Speed (Gs): the ability to perform cognitive tasks quickly.
Other researchers have proposed even more types of intelligences. Louis Thurstone (1938) proposed that there were seven clusters of primary mental abilities, made up of word fluency, verbal comprehension, spatial ability, perceptual speed, numerical ability, inductive reasoning, and memory. However, even these dimensions tend to be at least somewhat correlated, showing again the importance of g.
One advocate of the idea of multiple intelligences is the psychologist Robert Sternberg, who proposed a triarchic theory of intelligence, focusing on three types of intelligence, and that people may display analytical intelligence, creative intelligence, and practical intelligence. Sternberg (1985, 2003b) argued that traditional intelligence tests assess analytical intelligence, the ability to answer problems with a single right answer, but that they do not assess creativity well, like the ability to adapt to new situations and create new ideas, or practicality, like the ability to write good memos or to effectively delegate responsibility.
As Sternberg proposed, research has found that creativity is not highly correlated with analytical intelligence (Furnham & Bachtiar, 2008), and exceptionally creative scientists, artists, mathematicians, and engineers do not score higher on intelligence than do their less creative peers (Simonton, 2000). Furthermore, the brain areas that are associated with convergent thinking, which is thinking that is directed toward finding the correct answer to a given problem, are different from those associated with divergent thinking (Tarasova, Volf, & Razoumnikova, 2010), which is the ability to generate many different ideas for or solutions to a single problem (Figure IL.3). On the other hand, being creative often takes some of the basic abilities measured by g, including the abilities to learn from experience, to remember information, and to think abstractly (Bink & Marsh, 2000).
The triarchic theory of intelligence has been criticized for lacking empirical support (Gottfredson, 2003). Sternberg’s assertion that existing intelligence tests fail to measure practical intelligence has also been questioned. Given that high IQ predicts higher income and career potential, it may be argued that it includes what is called “street smarts” or practical intelligence. Executive functioning may better account for some kinds of creative intelligence such as divergent thinking and that this may be separate from analytical thinking (Nusbaum, 2011).

Studies of creative people suggest at least five components that are likely to be important for creativity:
- Expertise — Creative people have carefully studied and know a lot about the topic that they are working in. Creativity comes with a lot of hard work (Ericsson, 1998; Weisberg, 2006).
- Imaginative thinking — Creative people often view a problem in a visual way, allowing them to see it from a new and different point of view.
- Risk taking — Creative people are willing to take on new but potentially risky approaches.
- Intrinsic interest — Creative people tend to work on projects because they love doing them, not because they are paid for them. In fact, research has found that people who are paid to be creative are often less creative than those who are not (Hennessey & Amabile, 2010).
- Working in a creative environment — Creativity is in part a social phenomenon. Dean Simonton (1992) found that the most creative people were supported, aided, and challenged by other people working on similar projects.
The last aspect of the triarchic model, practical intelligence, refers primarily to intelligence that cannot be gained from books or formal learning. Practical intelligence represents a type of common sense that is learned from life experiences. Although a number of tests have been devised to measure practical intelligence (Sternberg, Wagner, & Okagaki, 1993; Wagner & Sternberg, 1985), research has not found much evidence that practical intelligence is distinct from g or that it is predictive of success at any particular tasks (Gottfredson, 2003). Practical intelligence may include, at least in part, certain abilities that help people perform well at specific jobs, and these abilities may not always be highly correlated with general intelligence (Sternberg, Wagner, & Okagaki, 1993). On the other hand, these abilities or skills are very specific to particular occupations and thus do not seem to represent the broader idea of intelligence.
Another supporter of the idea of multiple intelligences is the psychologist Howard Gardner. Gardner (1983, 1999) argued that it would be evolutionarily functional for different people to have different talents and skills. Additionally, Gardner proposed that there are eight intelligences that can be differentiated from each other, as seen in the table below. Gardner noted that some evidence for multiple intelligences comes from the abilities of “autistic savants,” people who may score low on intelligence tests overall but who nevertheless may have exceptional skills in a given domain, such as math, music, art, or in being able to recite statistics in a given sport (Treffert & Wallace, 2004). Zohar (1997) suggested that there may be a 9th intelligence called “spiritual intelligence”. Gardener (2000) did not include this in his list of multiple intelligences due to a lack of quantifiable data while acknowledging that “existential intelligence” might be an option (Allen & Shearer, 2013). This intelligence has been hypothesized to include self-awareness, being a visionary, showing compassion, and sense of purpose (Zohar, 2000).
| Intelligence | Description |
|---|---|
| Linguistic |
The ability to speak and write well
|
| Logico-mathematical | The ability to use logic and mathematical skills to solve problems |
| Spatial | The ability to think and reason about objects in three dimensions |
| Musical | The ability to perform and enjoy music |
| Kinesthetic (body) | The ability to move the body in sports, dance, or other physical activities |
| Interpersonal | The ability to understand and interact effectively with others |
| Intrapersonal | The ability to have insight into the self |
| Naturalistic | The ability to recognise, identify, and understand animals, plants, and other living things |
Table adapted from Gardner (1999).
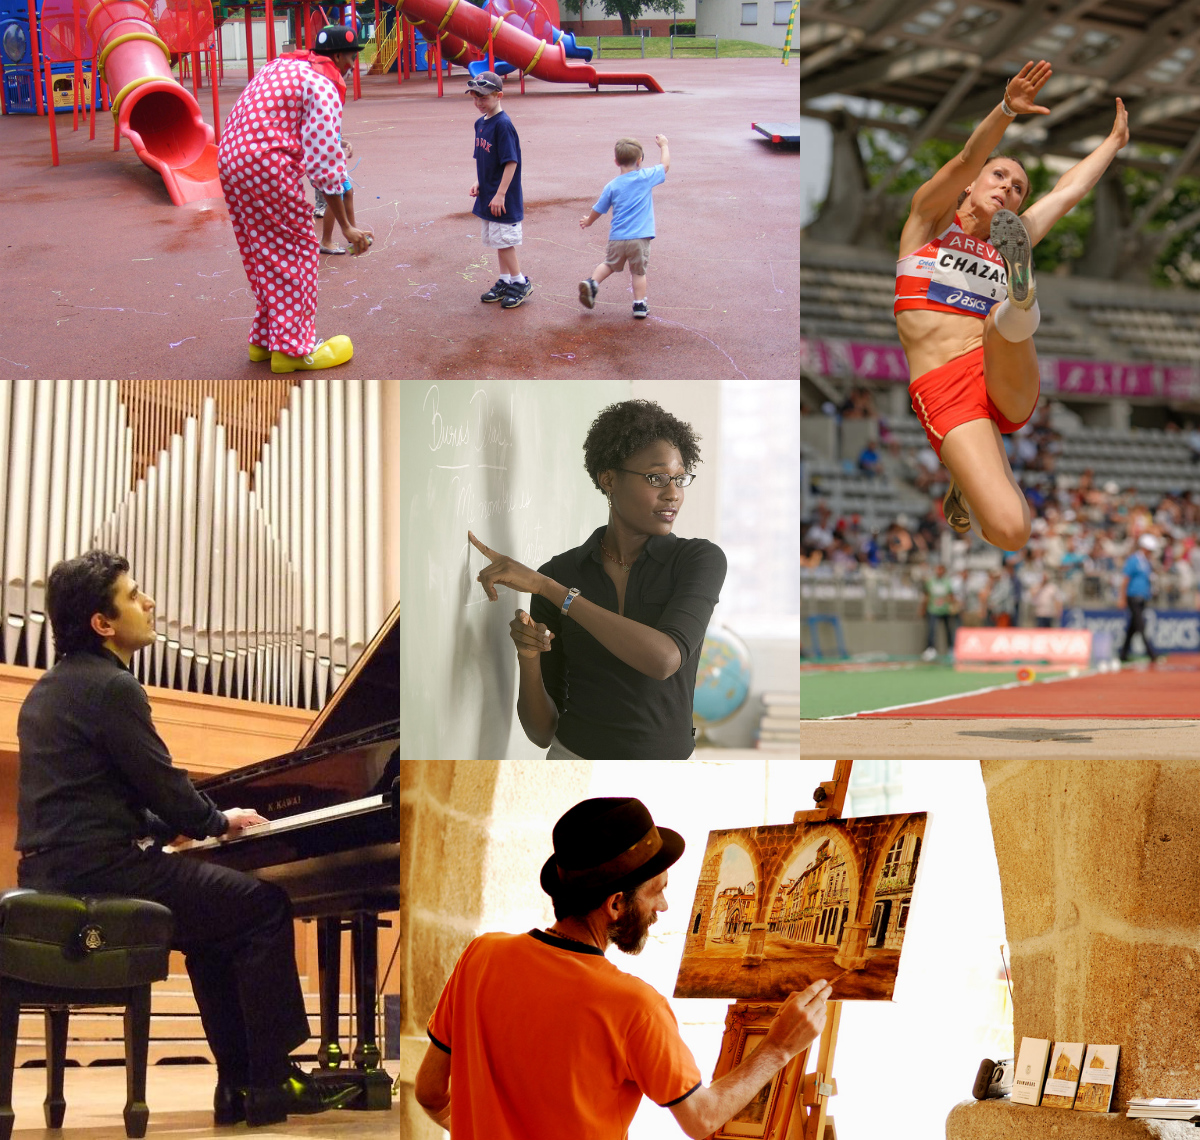
The idea of multiple intelligences has been influential in the field of education, and teachers have used these ideas to try to teach differently to different students (Figure IL.4). For instance, to teach math problems to students who have particularly good kinesthetic intelligence, a teacher might encourage the students to move their bodies or hands according to the numbers. On the other hand, some have argued that these intelligences sometimes seem more like abilities or talents rather than real intelligence, and there is no clear conclusion about how many intelligences there are. Are sense of humour, artistic skills, dramatic skills, and so forth also separate intelligences? Furthermore, and again demonstrating the underlying power of a single intelligence, the many different intelligences are in fact correlated and thus represent, in part, the general intelligence factor (Brody, 2003).
In addition, there is limited empirical evidence for multiple intelligences. (Visser et al., 2006). Gottfredson (2006) shows that the empirical support for multiple intelligences is weak while IQ appears to predict numerous life outcomes.
Measuring intelligence: Standardization and the intelligence quotient
The goal of most intelligence tests is to measure g, the general intelligence factor. Good intelligence tests are reliable, meaning that they are consistent over time, and also demonstrate construct validity, meaning that they actually measure intelligence rather than something else. Because intelligence is such an important individual difference dimension, psychologists have invested substantial effort in creating and improving measures of intelligence, and these tests are now some of the most accurate of all psychological tests. In fact, the ability to accurately assess intelligence is one of the most important contributions of psychology to everyday life. Numerous statistical procedures that are used today come from the early attempts to study intelligence and measure it accurately. While these early intelligence tests may not have been accurate and have often contributed to negative group stereotypes, the statistical and experimental procedures that they helped to establish are of use today.
Intelligence changes with age. A three-year-old who could accurately multiply 183 by 39 would certainly be intelligent, but a 25-year-old who could not do so would be seen as unintelligent. Thus, understanding intelligence requires that we know the norms or standards in a given population of people at a given age. The standardization of a test involves giving it to a large number of people at different ages and computing the average score on the test at each age level. Once a large enough representative sample of people have been tested, any individual’s score can be compared to norms that are based on the population.
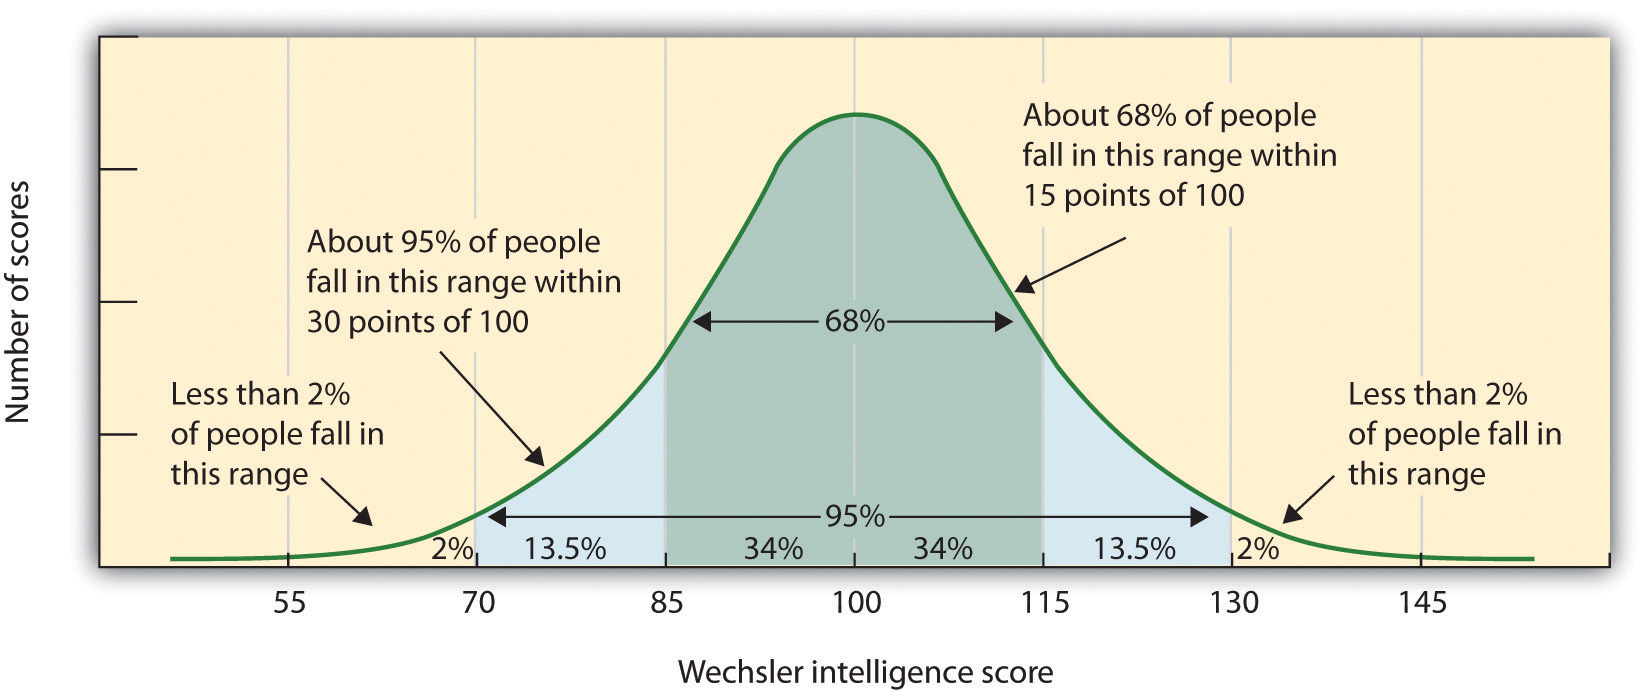
The results of studies assessing the measurement of intelligence show that IQ is distributed in the population in the form of a normal distribution (or bell curve), which is the pattern of scores usually observed in a variable that clusters around its average. In a normal distribution, the bulk of the scores fall toward the middle, with many fewer scores falling at the extremes. The normal distribution of intelligence shows that on IQ tests, as well as on most other measures, the majority of people cluster around the average, where IQ = 100, and fewer are either very intelligent or have intellectual challenges (Figure IL.5). Because the standard deviation of an IQ test is about 15, this means that about 2% of people score above an IQ of 130, often considered the threshold for giftedness, and about the same percentage score below an IQ of 70, often being considered the threshold for intellectual disability.
It is important that intelligence tests be standardized on a regular basis because the overall level of intelligence in a population may change over time. The Flynn effect refers to the observation that scores on intelligence tests worldwide have increased substantially over the past decades (Flynn, 1999). Although the increase varies somewhat from country to country, the average increase is about three intelligence points in IQ test scores every 10 years. There are many explanations for the Flynn effect, including better nutrition, increased access to information, and more familiarity with multiple-choice tests (Neisser, 1998), but whether people are actually getting smarter is debatable (Neisser, 1997). However, there have been some studies that have found a possible end to the progression of the Flynn effect. Studies in Norway (Sundet et al., 2004), Denmark (Teasdale & Owen, 2005), Australia (Cotton et al., 2005) and the United Kingdom (Flynn, 2009) showed a no increase or a slight decrease in IQ scores in recent years (especially since the 1990s). There are no clear explanations for this phenomenon though air pollution has been part of some speculations (Wuebbles et al. 2019).Once the standardization has been accomplished, we have a picture of the average abilities of people at different ages and can calculate a person’s mental age, which is the age at which a person is performing intellectually. If we compare the mental age of a person to the person’s chronological age, the result is the IQ, a measure of intelligence that is adjusted for age. A simple way to calculate IQ is by using the following formula:
[latex]\text{IQ } = \text{ mental age } \div \text{ chronological age } \times 100[/latex]
Thus, a 10-year-old child who does as well as the average 10-year-old child has an IQ of 100 ([latex]10 \div 10 \times 100[/latex]), whereas an eight-year-old child who does as well as the average 10-year-old child would have an IQ of 125 ([latex]10 \div 8 \times 100[/latex]). Most modern intelligence tests are based the relative position of a person’s score among people of the same age, rather than on the basis of this formula, but the idea of an intelligence ratio, or intelligence quotient, provides a good description of the score’s meaning.
A number of scales are based on IQ. The Wechsler Adult lntelligence Scale (WAIS) is the most widely used intelligence test for adults (Watkins, Campbell, Nieberding, & Hallmark, 1995). The current version of the WAIS, the WAIS-IV, was standardized on 2,200 people ranging from 16 to 90 years of age. It consists of 15 different tasks, each designed to assess intelligence, including working memory, arithmetic ability, spatial ability, and general knowledge about the world (Figure IL.6). The WAIS-IV yields scores on four domains: verbal, perceptual, working memory, and processing speed. The reliability of the test is high, more than 95%, and it shows substantial construct validity. The WAIS-IV is correlated highly with other IQ tests such as the Stanford-Binet, as well as with criteria of academic and life success, including grades, measures of work performance, and occupational level. It also shows significant correlations with measures of everyday functioning among the intellectually disabled.
The Wechsler scale has also been adapted for preschool children, in the form of the Wechsler Primary and Preschool Scale of Intelligence (WPPSI-III), and for older children and adolescents, in the form of the Wechsler Intelligence Scale for Children (WISC-IV).
Sample Items from the Wechsler Adult Intelligence Scale[1]
Verbal:
- General information: What day of the year is Canada day?
- Arithmetic reasoning: If eggs cost $6 a dozen, what does 1 egg cost?
- Vocabulary: Tell me the meaning of corrupt.
- Comprehension: Why do people buy fire insurance?
- Digit span:
- Listen carefully, and when I am through, say the numbers right after me.
7 3 4 1 8 6 - Now I am going to say some more numbers, but I want you to say them backward:
3 8 4 1 6
- Listen carefully, and when I am through, say the numbers right after me.
Visual:
- Block design: Using the four blocks, make one just like this.

- Object assembly: If these pieces are put together correctly, they make something. Go ahead and put them together as quickly as you can.

The intelligence tests that you may be most familiar with are aptitude tests, which are designed to measure one’s ability to perform a given task, such as doing well in undergraduate, graduate, or post-graduate training. Canadian post-secondary institutions request official high school transcripts demonstrating minimum grade admission requirements, while most American colleges and universities require students to take the Scholastic Assessment Test (SAT) or the American College Test (ACT). Post-graduate schools in both countries sometimes require the Graduate Record Examination (GRE), Graduate Management Admission Test (GMAT), Medical College Admissions Test (MCAT), or the Law School Admission Test (LSAT). These tests are useful for selecting students because they predict success in the programs that they are designed for, particularly in the first year of the program (Kuncel, Hezlett, & Ones, 2010). These aptitude tests also measure, in part, intelligence. Meredith Frey and Douglas Detterman (2004) found that the SAT correlated highly (i.e., between about r = .7 and r = .8) with standard measures of intelligence.Intelligence tests are also used by industrial and organisational psychologists in the process of personnel selection. Personnel selection is the use of structured tests to select people who are likely to perform well at given jobs (Schmidt & Hunter, 1998). The psychologists begin by conducting a job analysis in which they determine what knowledge, skills, abilities, and personal characteristics (KSAPs) are required for a given job. This is normally accomplished by surveying or interviewing current workers and their supervisors. Based on the results of the job analysis, the psychologists choose selection methods that are most likely to be predictive of job performance. Measures include tests of cognitive and physical ability and job knowledge tests, as well as measures of IQ and personality.
The biology of intelligence
The brain processes underlying intelligence are not completely understood, but current research has focused on four potential factors: brain size, sensory ability, speed and efficiency of neural transmission, and working memory capacity.
There is at least some truth to the idea that smarter people have bigger brains. Studies that have measured brain volume using neuroimaging techniques find that larger brain size is correlated with intelligence (McDaniel, 2005), and intelligence has also been found to be correlated with the number of neurons in the brain and with the thickness of the cortex (Haier, 2004; Shaw et al., 2006). It is important to remember that these correlational findings do not mean that having more brain volume causes higher intelligence. It is possible that growing up in a stimulating environment that rewards thinking and learning may lead to greater brain growth (Garlick, 2003), and it is also possible that a third variable, such as better nutrition, causes both brain volume and intelligence.
Another possibility is that the brains of more intelligent people operate faster or more efficiently than the brains of the less intelligent. Some evidence supporting this idea comes from data showing that people who are more intelligent frequently show less brain activity, suggesting that they need to use less capacity, than those with lower intelligence when they work on a task (Haier, Siegel, Tang, & Abel, 1992), and the brains of more intelligent people also seem to run faster than the brains of the less intelligent. Research has found that the speed with which people can perform simple tasks — such as determining which of two lines is longer or pressing, as quickly as possible, one of eight buttons that is lighted — is predictive of intelligence (Deary, Der, & Ford, 2001). Intelligence scores also correlate at about r = .5 with measures of working memory (Ackerman, Beier, & Boyle, 2005), and working memory is now used as a measure of intelligence on many tests.
Although intelligence is not located in a specific part of the brain, it is more prevalent in some brain areas than others. John Duncan and colleagues (Duncan et al., 2000) administered a variety of intelligence tasks and observed the places in the cortex that were most active. Although different tests created different patterns of activation (Figure IL.7), these activated areas were primarily in the outer parts of the cortex, the area of the brain most involved in planning, executive control, and short-term memory.

Is intelligence nature or nurture?
Intelligence has both genetic and environmental causes, and these have been systematically studied through a large number of twin and adoption studies (Neisser et al., 1996; Plomin, 2003). These studies have found that between 40% and 80% of the variability in IQ is due to differences in genes, meaning that overall, genetics plays a bigger role than environment does in creating IQ differences among individuals (Plomin & Spinath, 2004). The IQs of identical twins correlate very highly, where r = .86, which is much higher than do the scores of fraternal twins who are less genetically similar, where r = .60, and the correlations between the IQs of parents and their biological children, where r = .42, is significantly greater than the correlation between parents and adopted children, where r = .19. The role of genetics gets stronger as children get older. The intelligence of very young children that are less than 3 years old does not predict adult intelligence, but by age 7 it does, and IQ scores remain very stable in adulthood (Deary, Whiteman, Starr, Whalley, & Fox, 2004).
There is also evidence for the role of nurture, indicating that individuals are not born with fixed, unchangeable levels of intelligence. Twins raised together in the same home have more similar IQs than do twins who are raised in different homes, and fraternal twins have more similar IQs than do non-twin siblings, which is likely due to the fact that they are treated more similarly than non-twin siblings are.
The fact that intelligence becomes more stable as we get older provides evidence that early environmental experiences matter more than later ones. Environmental factors also explain a greater proportion of the variance in intelligence for children from lower-class households than they do for children from upper-class households (Turkheimer, Haley, Waldron, D’Onofrio, & Gottesman, 2003). This is because most upper-class households tend to provide a safe, nutritious, and supporting environment for children, whereas these factors are more variable in lower-class households. For example, upper-class households tend to be in areas with more security and police protection. They are also less likely to be in food deserts. Lower income neighbourhoods are more likely to have fewer options for buying food or may be in food deserts where there are no convenient places to buy food within walking distance.
Social and economic deprivation can adversely affect IQ. Children from households in poverty have lower IQs than do children from households with more resources even when other factors such as education, race, and parenting are controlled (Brooks-Gunn & Duncan, 1997). Poverty may lead to diets that are less nourishing or lacking in appropriate vitamins, and poor children may also be more likely to be exposed to toxins such as lead in drinking water, dust, or paint chips (Bellinger & Needleman, 2003). These factors can slow brain development and reduce intelligence.
If impoverished environments can impact intelligence, we might wonder whether enriched environments can improve it. Government-funded after-school programs such as Head Start are designed to help children learn. Head Start is a government initiative in the United States which is aimed at providing early childhood education, nutrition, and other services to low-income families. Research has found that attending such programs may increase intelligence for a short time, but these increases rarely last after the programs end (McLoyd, 1998; Perkins & Grotzer, 1997). Other studies suggest that Head Start and similar programs may improve emotional intelligence and reduce the likelihood that children will drop out of school or be held back a grade (Reynolds, Temple, Robertson, & Mann 2001).
Intelligence is improved by education; the number of years a person has spent in school correlates at about r = .6 with IQ (Ceci, 1991). In part, this correlation may be due to the fact that people with higher IQ scores enjoy taking classes more than people with low IQ scores, and thus they are more likely to stay in school. In large classes, teachers are not able to give enough of their time to students who do not perform well in academic subjects. This in turn leads to the students getting discouraged with school and academia in general. However, education also has a correlational effect on IQ. Comparisons between children who are almost exactly the same age but who just do or just do not make a deadline for entering school in a given school year show that those who enter school a year earlier have higher IQ than those who have to wait until the next year to begin school (Baltes & Reinert, 1969; Ceci & Williams, 1997). Children’s IQs tend to drop significantly during summer vacations (Huttenlocher, Levine, & Vevea, 1998), a finding that suggests that a longer school year, as is used in Europe and East Asia, is beneficial.
It is important to remember that the relative roles of nature and nurture can never be completely separated. A child who has higher than average intelligence will be treated differently than a child who has lower than average intelligence, and these differences in behaviours will likely amplify initial differences. This means that modest genetic differences can be multiplied into big differences over time.
Psychology in Everyday Life
Emotional intelligence
Although most psychologists have considered intelligence a cognitive ability, people also use their emotions to help them solve problems and relate effectively to others. While there are different models of emotional intelligence, the term encompasses the ability to accurately identify, assess, and understand emotions, both of oneself and others, and to effectively regulate one’s own emotions (Ackley, 2016).
The idea of emotional intelligence is seen in Howard Gardner’s interpersonal intelligence (the capacity to understand the emotions, intentions, motivations, and desires of other people) and intrapersonal intelligence (the capacity to understand oneself, including one’s emotions). Public interest in, and research on, emotional intelligence became widely prevalent following the publication of Daniel Goleman’s best-selling book, Working With Emotional Intelligence (1998).
One problem with emotional intelligence tests is that they often do not show a great deal of reliability or construct validity (Føllesdal & Hagtvet, 2009). Although it has been found that people with higher emotional intelligence are also healthier (Martins, Ramalho, & Morin, 2010), findings are mixed about whether emotional intelligence predicts life success, for instance, in job performance (Harms & Credé, 2010). Other researchers have questioned the construct validity of the measures, arguing that emotional intelligence really measures knowledge about what emotions are, but not necessarily how to use those emotions (Brody, 2004). These same researchers claim that emotional intelligence is actually a personality trait, a part of the general intelligence factor, or a skill that can be applied in some specific situations, for instance, academic and work situations (Landy, 2005).
Although measures of the ability to understand, experience, and manage emotions may not predict effective behaviours, another important aspect of emotional intelligence —emotion regulation — does. Emotion regulation refers to the ability to control and productively use one’s emotions. Research has found that people who are less impulsive and better able to override their impulses to seek immediate gratification also have higher cognitive and social intelligence. They have better test scores, are rated by their friends as more socially adept, and cope with frustration and stress better than those with less skill at emotion regulation (Ayduk et al., 2000; Eigsti et al., 2006; Mischel & Ayduk, 2004).
Because emotional intelligence seems so important, many school systems have designed programs to teach it to their students. However, the effectiveness of these programs has not been rigorously tested, and we do not yet know whether emotional intelligence can be taught or if learning it would improve the quality of people’s lives (Mayer & Cobb, 2000). Many businesses and corporations have an interest in emotional intelligence in relation to job performance, leadership, and flexibility (Ackley, 2016).
Image Descriptions
Figure IL.2 Carroll's Three Stratum Model of Human Intelligence image description: It is organised into three categories: General (Stratum III), Broad (Stratum II), and Narrow (Stratum I).
- g - General (Stratum III)
- Gf - Broad (Stratum II)
- f1 - Narrow (Stratum I)
- f2
- f...
- Gc - Broad (Stratum II)
- c1 - Narrow (Stratum I)
- c2
- c...
- Gy - Broad (Stratum II)
- y1 - Narrow (Stratum I)
- y2
- y...
- Gv - Broad (Stratum II)
- v1 - Narrow (Stratum I)
- v2
- v...
- Gu - Broad (Stratum II)
- u1 - Narrow (Stratum I)
- u2
- u...
- Gr - Broad (Stratum II)
- r1 - Narrow (Stratum I)
- r2
- r...
- Gs - Broad (Stratum II)
- s1 - Narrow (Stratum I)
- s2
- s...
- Gt - Broad (Stratum II)
- t1 - Narrow (Stratum I)
- t2
- t... [Return to Figure IL.2]
- Gf - Broad (Stratum II)
Image Attributions
Figure IL.1. Az-Writing Boy E-Citizen by Moonsun1981 is used under a CC BY-SA 3.0 license.
Figure IL.2. From Three-Stratum Theory, by T. Bates, 2013. Carroll's Three Stratum Model of Human Intelligence by is licensed under a CC BY-SA 3.0 license.
Figure IL.3. Wanzikia by Hawyih is in the public domain.
Figure IL.4. Klutz the Clown by Herald Post is used under a CC BY-NC 2.0 license; Women Heptathlon LJ French Athletics Championships 2013 t144221 by Marie-Lan Nguyen is used under a CC BY 3.0 license; Street Painter by Pedro Ribeiro Simões is used under a CC BY 2.0 license; Vardan Mamikonyan Armenian Pianist by Chaojoker is used under a CC BY-SA 3.0 license; Teacher at Chalkboard by cybrarian77 is used under a CC BY-NC 2.0 license.\
Figure IL.5. Figure 5.13 as found in Lifespan Development chapter: Extremes of Intelligence: Intellectual Disability and Giftedness is licensed under a CC BY-NC-SA 4.0 license.
Figure IL.6. Figure 9.1.4 as found in Introduction to Psychology (Libretexts) is shared under a CC BY-NC-SA 3.0 license and was authored, remixed, and/or curated by Anonymous via source content that was edited to the style and standards of the LibreTexts platform.
Figure IL.7. Figure 9.1.5 as found in Introduction to Psychology (Libretexts) is shared under a CC BY-NC-SA 3.0 license and was authored, remixed, and/or curated by Anonymous via source content that was edited to the style and standards of the LibreTexts platform.
- Adapted from Thorndike, R. L., & Hagen, E. P. (1997). Cognitive Abilities Test (Form 5): Research handbook. Chicago, IL: Riverside Publishing. ↵
To calculate this time, we used a reading speed of 150 words per minute and then added extra time to account for images and videos. This is just to give you a rough idea of the length of the chapter section. How long it will take you to engage with this chapter will vary greatly depending on all sorts of things (the complexity of the content, your ability to focus, etc).
