Chapter 5. Sensation and Perception
Psychophysics
Jessica Motherwell McFarlane
Approximate reading time: 35 minutes
Let’s focus on how we see light and hear sound. Both of these come to us in waves, but they are different kinds of waves. Even though they are different, these waves have some things in common that are important for how we see and hear.
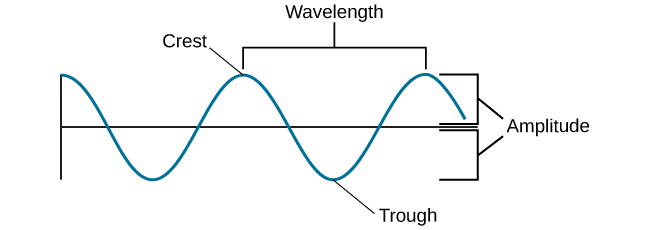
When we talk about waves, we look at two main things: amplitude and wavelength. Amplitude is how high or low the wave goes. Imagine a wave in the ocean: the amplitude is the height from the middle of the wave to the top. Wavelength is how long the wave is from one peak to the next (Figure SP.3).

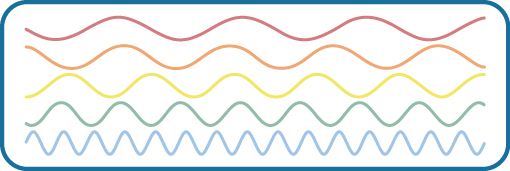
These two things, amplitude and wavelength, help us understand things like how loud a sound is or what colour something is. For example, a loud sound has a high amplitude. The colour red has a long wavelength, while blue has a shorter one (Figure SP.4).

In this section, we’re going to learn more about how waves work and how they affect what we see and hear. Remember, even though this might sound complex, it’s all about understanding the waves that make up the sights and sounds around us.
Sound Waves
The physical properties of sound waves are associated with various aspects of our perception of sound. The frequency of a sound wave is associated with our perception of that sound’s pitch. We measure sound in hertz (Hz), which tell us how many waves pass a point in a second. High-pitched sounds have a lot of waves in a second (high frequency), and low-pitched sounds have fewer (low frequency). In humans, the audible range of sound frequencies is between 20 and 20,000 Hz, with greatest sensitivity to those frequencies that fall in the middle of this range.
Other species show differences in their audible ranges. For instance, chickens have a very limited audible range, from 125 to 2000 Hz. Mice have an audible range from 1000 to 91,000 Hz, and the beluga whale’s audible range is from 1000 to 123,000 Hz. Our pet dogs and cats have audible ranges of about 70–45,000 Hz and 45–64,000 Hz, respectively (Strain, 2003).
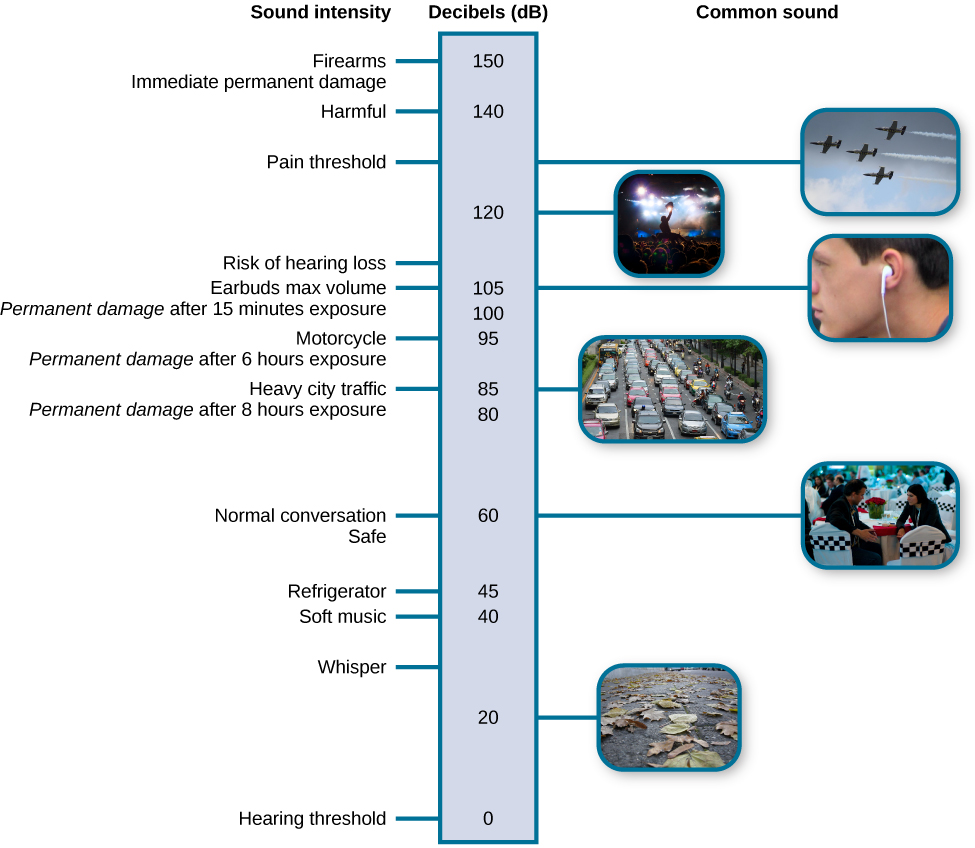
The loudness of a given sound is closely associated with the amplitude of the sound wave. Higher amplitudes are associated with louder sounds. Loudness is measured in terms of decibels (dB), a unit of sound intensity. A typical conversation would correlate with 60 dB; a rock concert might check in at 120 dB (Figure SP.9). A whisper 5 feet away or rustling leaves are at the low end of our hearing range; sounds like a window air conditioner, a normal conversation, and even heavy traffic or a vacuum cleaner are within a tolerable range. However, there is the potential for hearing damage from about 80 dB to 130 dB: These are sounds of a food processor, power lawn mower, heavy truck (25 feet away), subway train (20 feet away), live rock music, and a jackhammer. About one-third of all hearing loss is due to noise exposure, and the louder the sound, the shorter the exposure needed to cause hearing damage (Le, Straatman, Lea, & Westerberg, 2017). Listening to music through earbuds at maximum volume (around 100–105 decibels) can cause noise-induced hearing loss after 15 minutes of exposure. Although listening to music at maximum volume may not seem to cause damage, it increases the risk of age-related hearing loss (Kujawa & Liberman, 2006). The threshold for pain is about 130 dB, which can be seen with a jet plane taking off or a revolver firing at close range (Dunkle, 1982).

Watch this video: Sound: Wavelength, Frequency and Amplitude. (6 minutes)
“Sound: Wavelength, Frequency and Amplitude.” video by Science Sauce is licensed under the Standard YouTube licence.
Of course, different musical instruments can play the same musical note at the same level of loudness, yet they still sound quite different. This is known as the timbre of a sound. Timbre refers to a sound’s purity, and it is affected by the complex interplay of frequency, amplitude, and timing of sound waves. Sound, specifically hearing, will be discussed later in this section.
Light Waves
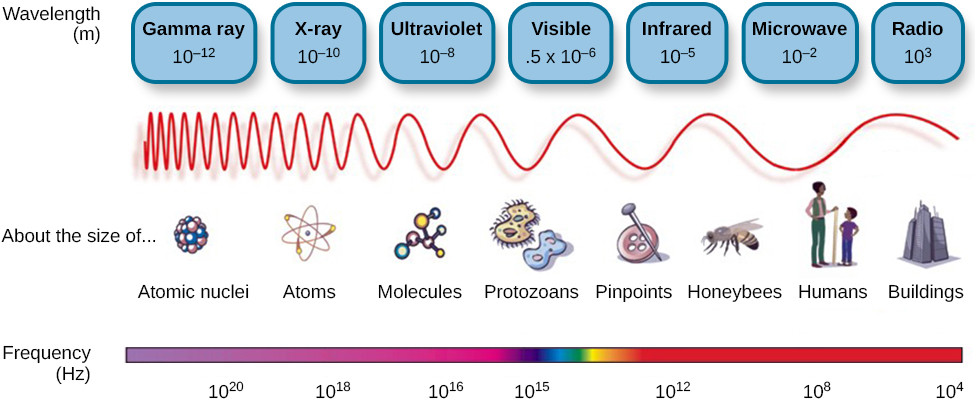
The visible spectrum is the portion of the larger electromagnetic spectrum that we can see. As Figure SP.6 shows, the electromagnetic spectrum encompasses all of the electromagnetic radiation that occurs in our environment and includes gamma rays, x-rays, ultraviolet light, visible light, infrared light, microwaves, and radio waves. The visible spectrum in humans is associated with wavelengths that range from 380 to 740 nm — a very small distance, since a nanometer (nm) is one billionth of a metre. Other species can detect other portions of the electromagnetic spectrum. For instance, honeybees can see light in the ultraviolet range (Wakakuwa, Stavenga, & Arikawa, 2007), and some snakes can detect infrared radiation in addition to more traditional visual light cues (Chen, Deng, Brauth, Ding, & Tang, 2012; Hartline, Kass, & Loop, 1978).

In humans, light wavelength is associated with perception of colour (Figure SAP.11). Within the visible spectrum, our experience of red is associated with longer wavelengths, greens are intermediate, and blues and violets are shorter in wavelength. (An easy way to remember this is the mnemonic ROYGBIV: red, orange, yellow, green, blue, indigo, violet.) The amplitude of light waves is associated with our experience of brightness or intensity of colour, with larger amplitudes appearing brighter. Brighter colours have higher amplitudes.

“Sensation and Perception: Crash Course Psychology #5” video by CrashCourse is licensed under the Standard YouTube licence.
Image Attributions
Figure SP.3. Figure 5.5 as found in Psychology 2e by OpenStax is licensed under a CC BY 4.0 License.
Figure SP.4. Figure 5.6 as found in Psychology 2e by OpenStax is licensed under a CC BY 4.0 License.
Figure SP.5. Figure 5.9 as found in Psychology 2e by OpenStax is licensed under a CC BY 4.0 License and contains modifications of the following works: “planes” by Max Pfandl is licensed under a CC BY 2.0 licence; “crowd” by Christian Holmér is licensed under a CC BY 2.0 licence; “earbuds” by Skinny Guy Lover is in the public domain; “traffic” by islandworks is licensed under a Pixabay license; “talking” by Joi Ito is licensed under a CC BY 2.0 licence; “leaves” by Aurelijus Valeiša is licensed under a CC BY 2.0 licence.
Figure SP.6. Figure 5.7 as found in Psychology 2e by OpenStax is licensed under a CC BY 4.0 License.
Figure SP.7. Figure 5.8 as found in Psychology 2e by OpenStax is licensed under a CC BY 4.0 License and contains modifications of the following works: “Humanly Visible Spectrum” by Johannes Ahlmann is licensed under a CC BY 2.0 licence.
To calculate this time, we used a reading speed of 150 words per minute and then added extra time to account for images and videos. This is just to give you a rough idea of the length of the chapter section. How long it will take you to engage with this chapter will vary greatly depending on all sorts of things (the complexity of the content, your ability to focus, etc).

