9 Climate Change and Human Security
Learning Outcomes & Big Ideas
- Understand the effects that impacts of climate change have on the Earth’s ecosystems, and on human society
- Explain the mechanics of the greenhouse effect, global warming and climate change.
- Identify the origins of major emissions, who the major drivers are and what populations are most affected by climate change impacts.
- Describe examples how climate change affects ecological structures and relationships.
- Explain how climate change poses a serious risk to human security now and in the future.
- Define the concept of climate justice, and explain how it supports the ethical imperative of fighting climate change; differentiate between equity and equality in the context of climate justice.
- Describe examples how fighting climate change can include prevention, mitigation and adaptation.
- Identify personal opportunities to contribute towards addressing the challenges of climate change.
Summary
Since the mid-20th century the Earth has warmed gradually at an increasing rate, largely as a result of greenhouse gas emissions from human activities. The most prominent greenhouse gas is carbon dioxide, the levels of which have been closely monitored and reliably documented. The increased retention of heat is affecting the climate of different regions in different ways, including heat waves, droughts, severe weather events, the loss of polar ice and glaciers, as well as the disruption of regional weather cycles. Additional global effects include the acidification of the oceans, the rise of sea levels, the melting of arctic permafrost and the unpredictable response of major ocean currents. Ecosystems respond to those changes in complex and unpredictable ways, affecting the distribution of species and their interrelationships, as will be explained on examples. Human societies are affected in ways that compromise human security across the four pillars. Sources of insecurity in different pillars can reinforce each other and lead to major regional crises, as in the case of Syria. A major catastrophe is expected for South Asia as their sources of freshwater in the Himalayas are disappearing.
The global distribution of emission levels is very uneven, with per capita levels among the most affluent exceeding those of the poorest by two orders of magnitude. The impacts of climate change on individuals follow an inverse distribution, with the highest impacts disproportionately affecting the world’s poorest. The underlying injustice has incited protests and calls for reform worldwide. However, industrial greenhouse gas emissions are clustered in private and state-run industries that are slow to respond to arguments of climate justice. Major reform strategies involve governments and civil society and focus on mitigation and adaptation. Although they are facing some technological barriers, the most insurmountable obstacles are cultural and political.
Chapter Overview
9.1.1 Climate Change Impacts on Natural Systems
9.1.1.1 Heat Waves and Droughts
9.1.1.2 Precipitation and Storms
9.1.2 Delving Deeper: Climate Change Impacts on Ecosystems
9.1.3 Impacts on Human Society
9.2 Current and Future Risks to Human Security
9.3 Major Culprits and Victims of Climate Change
9.3.2 Climate Justice in Practice
9.4 Barriers to Counteracting Climate Change
9.4.3 Politics, Money and Power
9.5 Achieving Climate Justice as the Way Forward
Extension Activities & Further Research
9.1 Introduction
The Earth’s climate is changing, and it is changing at a rate that has not been seen in millions of years. The cause of this change is the production of anthropogenic greenhouse gas [1] emissions that can be traced back to the mid-20th century and the Industrial Revolution, that brought with it the invention of technology that allowed humans to burn fossil fuels for energy. Since that time, the rate of fossil fuel use has increased, and has allowed great leaps forward in public health, food production, science, and urbanization, in turn contributing to exponential population growth in countries all over the world. Unfortunately, the greenhouse gases (GHGs) produced from burning fossil fuels are disturbing fragile ecological relationships that have evolved over millennia. Part of the solar energy absorbed by the Earth is normally emitted back into space as infrared radiation; now, GHGs in the atmosphere absorb much of that infrared radiation which causes warming. The resulting climate change disturbs the ecology of the planet in manifold ways.
Climate change, or global warming, is a phenomenon that scientists were studying as far back as 1960, when the first models of global climate supported the theory that increasing greenhouse gases were warming the Earth’s climate (Robinson & Robbins, 1968). The causes and impact of global warming were known to scientists, news reporters, and policymakers alike. However, it wasn’t until 1995 that the global community came together to identify strategies to mitigate and adapt to climate change at the first United Nations Framework Convention on Climate Change (UNFCCC) Conference of Parties (COP). Fast forward 19 years later, the 21st Conference of Parties finally achieved a landmark agreement signed by 195 countries to limit the Earth’s warming to “well below 2 degrees Celsius above pre-industrial levels, and to limit the increase to 1.5 degrees Celsius to substantially reduce the risks and effects of climate change” (Rogelj et al., 2016, p. 631). This prescribed limit to warming is based on extensively peer-reviewed climate science by the Intergovernmental Panel for Climate Change (IPCC).
The IPCC is an intergovernmental branch of the United Nations that is responsible for assessing the science of climate change. Its mandate is to provide periodic updates on the science of climate change to help policymakers tackle this multi-sector issue. In 2018, the IPCC published a special report on the impacts of global warming of 1.5°C above pre-industrial levels. Currently, human activities are estimated to have already increased the temperature of the earth 0.8 to 1.2°C above pre-industrial levels. If humans continue to conduct business as usual, the IPCC estimates that we will reach 1.5°C sometime in the next 11 to 33 years (Hoegh-Guldberg et al., 2018). The report’s sobering bottom line tells us that there is a big difference in limiting global warming to 1.5°C compared to 2°C.
| IMPACT | 1.5°C | 2°C | MAGNITUDE of 2 vs. 1°C |
|---|---|---|---|
| Extreme heat: percentage of global population that will be exposed to severe heat at least once every five years | 14% | 37% | 2.6 times worse |
| Sea-ice-free arctic: the minimum number of ice-free summers | once every 100 years | once every 10 years | 10 times worse |
| Sea-level rise: amount of sea level rise by 2100 | 0.04 metres | 0.46 metres | 11.5 times worse |
| Loss of plants: species that lose at least half their range | 8% | 16% | 2 times worse |
| Loss of insects: insects that lose at least half of their range | 6% | 18% | 3 times worse |
| Ecosystems: amount of Earth’s land area where ecosystems will shift to a new biome | 7% | 13% | 1.86 times worse |
| Permafrost: amount of Arctic permafrost that will thaw | 4.8 million km2 | 6.6 million km2 | 1.38 times worse |
| Crop yields: reduction in maize harvests in the tropics | 3% | 7% | 2.3 times worse |
| Coral reefs: further decline | 70 to 90% | 99% | about 1.2 times worse |
| Fisheries: decline in fish stock | 1.5 million tonnes | 3 million tonnes | 2 times worse |
As Table 9.1 shows, global warming has impacts on everything from nutrient and geological cycles, to oceanic currents and atmospheric jet streams, to biodiversity and food production and supply. These multiple impacts present a great threat to human security.
This chapter first explores the primary impacts of climate change on the natural world. Next, the chapter explores the continuous drivers of climate change and frames climate change, in both its causes and its impacts, as an issue of social injustice and inequity. Further, this chapter will look at the climate justice social movement and its aims, and how the various climate justice campaigns around the world are at once targeting the reduction of greenhouse gas emissions as well as the underlying political systems that enable fossil fuel extraction and use and championing the just representation and consideration of those underrepresented communities on the front lines of climate disasters. We will end the chapter by drawing on the connections between the need for climate justice in reducing present and future risks to human security, in upholding democracy, a secure food supply and maintaining public health.
9.1.1 Climate Change Impacts on Natural Systems
The effects of climate change on natural systems include major changes in regional weather patterns, ocean acidification, sea level rise, and melting of glaciers and polar ice caps. Within and besides these major categories of impacts, there are many other effects on our natural world and the organisms that live in it. This section will look at the major climate change effects on Earth, and give brief examples of the impacts seen on humans and ‘nature.’ The next section will delve deeper into climate change impacts on ecosystems, giving an example of how one climate change impact can cause a domino effect that will be felt by the intimately interconnected species, nutrients, and habitats in a biome. Following this, detailed examples of impacts on human society will be discussed.
Climate change has major effects on the Earth’s overall temperature, the ocean, Earth’s biogeochemical cycles, and cloud formation. These effects translate further into major changes in weather such as increased variability and unpredictability of rainfall, increased intensity and frequency of heat waves, droughts, and extreme events such as hurricanes. Further, the increased overall temperature of the Earth induces accelerated melting of the polar ice caps and other large bodies of ice, creating sea level rise and threatening fresh water supplies. Finally, the increased levels of carbon dioxide in Earth’s atmosphere and oceans mean that there are greater levels of hydrogen ions in the ocean, causing ocean acidification.
Sometimes climate change can reinforce itself, which manifests as accelerating change. This is dangerous as it reduces our response time. For example, the albedo effect describes the accelerating warming of polar regions; as their cover of snow and ice disappears those regions no longer reflect sunlight but absorb more of it, warming up even more. To accelerate the process even more, the warming of arctic climates causes the melting and breakdown of permafrost soil, which liberates methane (a very potent GHG), and causes even more warming.
9.1.1.1 Heat Waves and Droughts
The rising temperature caused by climate change increases evaporation in some areas, which results in more storms and higher precipitation in other areas. This intensified water cycle means certain parts of the world are experiencing greater than average rainfall while other areas are experiencing greater than average periods of drought. On average, dry areas will become drier, while wet areas will become wetter (Field, 2014).
In those areas that are already dry, heat waves and droughts are occurring more frequently and with greater intensity. Seasonal temperature averages are breaking records in cities, states, and countries all over the world. Along with the increase in average temperature, prolonged periods of heat are impacting ecosystems and humans. Sustained levels of heat waves in the ocean can have negative consequences such as loss of kelp forests, coral reef decimation, and loss of marine invertebrates (Smale et. al., 2019). In cities, the consequences of increased intensity and frequency of heat waves include greater number of hospitalizations due to heat stress, and a greater number of deaths due to heat exhaustion and heat stroke. The IPCC Special Report on an increase of 1.5° C states that there are “lower risks projected at 1.5 degrees Celsius than at 2 degrees Celsius for heat-related morbidity and mortality.” (Hoegh-Guldberg et al., 2018, p. 11) Heat waves are particularly hard on the senior population, and the effects of heat waves are exacerbated in urban centers, where average temperatures are several degrees higher than in the rural areas surrounding cities (Hoegh-Guldberg et al., 2018).
An increase in global temperature can disturb fragile biological relationships that are much older than the human species. Studies showed that the mountain pine beetle’s range in the Pacific Northwest of Canada has grown considerably as temperatures warm, as the beetle can now survive in a hospitable environment that was previously inhabitable (Sambaraju et al., 2019). In addition, a longer summer season in the Pacific Northwest has made it easier for the mountain pine beetle to cause damage to larger swaths of forest. Making matters worse, the frequency and intensity of droughts are a stressor to trees’ defensive mechanisms, allowing the pine beetle to be more successful in its attack, decreasing the tree’s chances at survival. Further, greater swaths of damaged trees can act as kindling to wildfires, adding dangerous fodder to a dry, hot environment that is already ideal for the spread of fires.
Another ecological effect of increased surface temperatures in world oceans is the bleaching of coral reefs. Australia’s Great Barrier Reef, purported as the largest living organism in the world, (2,2500 km long) is dying from the effects of climate change and industrial sediments.[3]
9.1.1.2 Precipitation and Storms
As noted above, recent years have seen a major increase in frequency and intensity of rainfall and storms in certain parts of the world (Hoegh-Guldberg et al., 2018). The warmer temperatures caused by climate change increased the intensity of the water cycle, and generally, rainfall will increase in areas that are already experiencing higher than average levels of rainfall, but precipitation will generally decline in subtropical regions.
The melting of ice caps and the warming of surface water are likely to affect the major ocean currents that determine regional weather cycles. All of the major currents are connected into a coherent global system (the ‘Global Conveyor Belt’), which means that changes to currents in one region could affect other regions far away (World Ocean Review, 2010). Evidence is mounting that such changes are imminent (Editor, 2018)). Examples that raise particular concerns are:
- The climate of Europe is determined by the Gulf Stream delivering warm waters from the Caribbean. Increased input of freshwater from the melting of the Greenland Ice Shelf could disrupt this mechanism which would change the climate of Europe to resemble that of Labrador.
- Agriculture in the Indian subcontinent and parts of South East Asia depends largely on the annual Monsoon rains. Those depend in turn on ocean currents and prevailing winds, which are interdependent. A failure of the Monsoon would amount to a catastrophe of unprecedented proportions.
- Of similar importance to the climate of Mesoamerica is the El Ninjo-La Ninja system.
In addition, most climate models predict increased intensity of rainfall nearly everywhere when it does occur (Pfahl et al., 2017). Scientists are still in the process of analyzing the complicated relationship between climate change and precipitation in order to better understand patterns and gather forecasts, but there is consensus that “risks from heavy precipitation events are projected to be higher at 2 degrees Celsius compared to 1.5 degrees Celsius of global warming … in regions including several northern hemisphere high-latitude and high-elevation regions, eastern Asia, and eastern North America” (Hoegh-Guldberg et al., 2018). Table 9.1 showed the overall extent of the differences.
Recent modeled projections show a likely increase in occurrence of high intensity tropical storm hurricanes, with a possible decrease in overall frequency of storms (Pachauri et al., 2014). These more intense storms are very likely to be accompanied by higher than usual volumes of rain. In addition, climate models predict an increase of 2-11% in wind speed by the year 2100 (Knutson et al., 2010). In 2017, Hurricane Harvey broke the record for most rainfall in any tropical hurricane system, with some areas receiving 91 or more centimetres of rain, totalling over 152 centimetres of rain over the duration of the storm. Its highest wind intensity on land was 177 km per hour. At least 68 people died from the direct effect of the storm, and the economic devastation to homes and infrastructure was second only to Hurricane Katrina (National Oceanic and Atmospheric Centre, 2018).
9.1.1.3 Sea Level Rise
Another major impact of the increased global temperature of climate change is sea level rise. It is caused by a combination of the melting of the polar ice caps, the warming of the ocean causing thermal expansion, and a reduced amount of liquid water storage on land (Hoegh-Guldberg et al., 2018). Global mean sea level rise (GMSLR) has occurred naturally in the past but it was slower. The rate of GMSLR has more than doubled from the period of 1901-1990, to 1993-2010 (Church et al., 2013) from 1.5 mm per year to 3.2 mm per year. The GMSLR rate of increase in the 21st century is projected to exceed that of 3.2 mm, in all Representative Concentration Pathways (RCP). RCPs represent possible future scenarios of anthropogenic greenhouse gas emissions of varying concentrations in the atmosphere (Van Vurren et al., 2011). The pathways show different rates and magnitudes of climate change, and is a standard set of scenarios that allows scientists to assess risks associated with each. “The goal of working with scenarios is not to predict the future but to better understand uncertainties and alternative futures, in order to consider how robust different decisions or options may be under a wide range of possible futures.” (IPCC, 2019).
For RCP 2.6, considered the world’s best case scenario for limiting greenhouse gas emissions, projected GMSLR is between 0.28 to 0.61 meters by 2100. For RCP 8.5, the “worst case” scenario for limiting anthropogenic climate change, GMSLR could be between 0.53 meters to 0.98 meters by 2100 (Church et al., 2013). Almost all major coastal cities would be affected, with over 570 low-lying coastal cities inundated by at least half a meter in sea level rise by 2050 (C40 Network, 2019). The impact on megacities will be discussed in section 9.1.3. If crucial ‘tipping points’ in emissions are transgressed, a self-reinforcing ‘runaway’ greenhouse effect might ensue. The consequence would be a scenario called Hothouse Earth, which involves all ice disappearing and sea levels rising by 10–60 metres (Steffen et al., 2018).
9.1.1.4 Ocean Acidification
The increased concentration of carbon dioxide in our atmosphere translates to an increase in carbon dioxide concentration in our oceans (as approximately a third of atmospheric CO2 is absorbed by the ocean) (Gruber et al., 2019), leading to a lower pH of the ocean. Ocean acidity as expressed by hydrogen ion concentration, has increased by 26% since 1850, a rate of change that is tenfold the rate of change from any time in the last 55 million years (Doney et al., 2009). As the oceans become more acidic, carbonate ions are not as freely available, making it difficult for organisms to produce calcium carbonate that make up shells and skeletons. This can have a cascading effect of other unwanted impacts on marine ecosystems, fisheries, aquaculture, and tourism. There is also a possibility that higher levels of carbon dioxide in the oceans may benefit photosynthetic organisms like algae and kelp (Britton et al., 2016), which could be desirable with kelp forests but disastrous with algal blooms. The impacts of ocean acidification are explained in closer detail in the next section.
9.1.2 Delving Deeper: Climate Change Impacts on Ecosystems
The primary driver of climate change is the emission of greenhouse gases, which can have many unintended impacts on the Earth’s natural processes, as detailed in the previous section. This section will delve deeper into climate change impacts, and look at how the changes in Earth’s natural processes can impact an ecosystem by threatening the species that call it home, and interrupting fragile ecosystem services.
Ecosystems encompass all living organisms within a particular area, and the non-living things with which they interact. For example, a forest ecosystem includes the living trees, mosses, microbes, deer, birds, and insects that call it home, as well as the air, soil, lakes, rocks, and sunlight within it. Together, each organism and non-living substance are part of a coexisting community that is itself made of countless interdependent relationships. Many of these relationships are developed over such long periods of time, that they have come to rely on the specific habits of species, or the specific timeline and pattern of a nutrient cycle.
For example, the Pacific Northwest coastal ecosystem is home to oysters of many different species. Each species has adapted to thrive in the cold waters off the western coast of North America, which welcome a periodic upwelling of nutrient-dense waters from the deep ocean (Kämpf & Chapman, 2016). However, ocean acidification due to climate change is threatening the continued survival of oyster species. The increased acidity of the ocean affects the Pacific Northwest oyster species in two major ways. First, the lower pH wears at a young oyster’s shell, which is made up of calcium carbonate. Calcium carbonate, when interacting with a low pH solution, slowly dissolves as free hydrogen ions work to break calcium carbonate molecules apart. Another way a low pH ocean can interfere with oyster shells is by binding with free carbonate ions in the ocean, and making them less abundant in the environment for an oyster to use to build its shell. This is particularly stressful for young oysters, as their life cycle requires them to build up 90% of their body weight as shell within the first few days of life. Further, more carbon dioxide in the oceans can spell trouble for oyster reproduction. A recent study on Sydney rock oysters found the ratio of females to males in oyster populations could be affected by increased levels of carbon dioxide in the ocean (Boulais et al., 2017), where ocean acidification was found to increase the ratio of females to males by 16%. This could have negative implications for successful reproduction of oyster populations in light of an increasingly acidic ocean.
Oysters also provide important ecosystem services to their surrounding environment and the organisms living in it. Oysters feed by filtering their surrounding water and taking up phytoplankton or algae biomass through their gills. Inadvertently, this process helps improve the water quality by removing organic and inorganic particles. The inorganic particles that the oysters are unable to absorb are packaged into bundles and released as pseudofeces, which are then deposited into the lowest level of the ocean substrate, where it poses little to no harm to the ocean ecosystem. The loss of oyster reefs from ocean acidification could impact the quality of water in these coastal marine ecosystems, the effects of which are not yet fully understood.
Oyster reefs also provide a habitat for other organisms such as barnacles, mussels, and anemones. The hard reefs formed by oysters’ shells and the surrounding substrate allows these animals to attach to a secure and sheltered structure. Oyster reefs also provide hiding spots for prey seeking refuge, which in turn draw larger predators to reefs, creating a dynamic, thriving environment. Other oyster reef ecosystem services include the provision of a spawning area for species of fish such as oyster gobies and blennies, who lay their eggs in dead oyster shells. A reduction in oyster reef substrate would pose a problem to species that rely on reefs for habitat, reproduction, and shelter. As a keystone species, fluctuation in oyster populations will have a substantial effect on a large number of other organisms.
Finally, oyster reefs serve as breakwaters that can protect nearby shorelines from erosion, and are being used and considered as a tool in adapting to sea level rise. New York City’s Billion Oyster Project is an oyster reef restoration project, that aims to educate the public on the importance of oysters as a keystone species, an “ecosystem engineer,” and collects oyster shells from restaurants to return to the ocean as a building block of new oyster shells, and reefs (Billion Oyster Project, 2019).
We have used the example of the coastal marine ecosystem of oyster reefs as an example of how the impacts climate change can wreak havoc on ecology, and, in turn, the disrupt the role that ecology plays in bolstering resilience to climate impacts. This is only one example, and there are many other climate change impacts that can have trickle down effects through Earth’s ecosystems.
9.1.3 Impacts on Human Society
Climate change impacts, including the impacts on ecosystems, threaten human society in many ways. This section will broadly review the effects of climate change on human society. Human societies are deeply embedded into natural ecosystems and are dependent on them for sources of food, potable water, shelter, waste processing, raw materials and more. Humans are undeniably reliant on these ‘ecosystem services’ provided by nature, but for the greater part of modern society’s existence, there has been little to no thought on ensuring these ecosystem services can be sustained for future generations. Our rate of resource extraction has exacted an insurmountable cost to the planet (further discussed in Chapter 12).
We will use the example of Mumbai, India, as a case study of climate change impact on human society, and how one climate change impact can create another unexpected, and often undesired, consequence (see Figure 9.1).
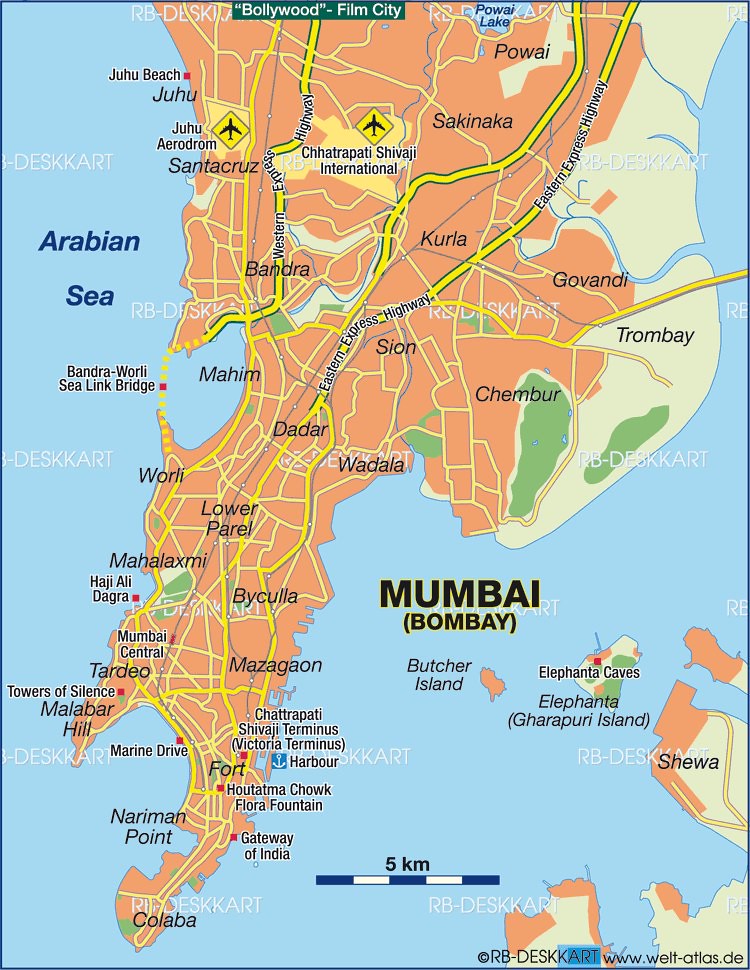
While climate change impacts will be felt all over the world, some areas will feel the impacts more severely in terms of intensity, frequency, and number of people affected. The climate change impact of sea level rise incurs major economic costs. One study projects the accumulated total cost of global sea level rise to be $14 trillion USD by 2100 (Jevrejeva et al., 2018). While some areas are more affected than others, cities in Asia will disproportionately bear a greater burden of impact, with 38% of the cities most at risk for sea level rise located on the Asian continent. Scientists estimate that the ten cities with the highest proportion of population exposed to sea level rise impact will be Mumbai, Guangzhou, Shanghai, Miami, Ho Chi Minh City, Kolkata, Greater New York, Osaka-Kobe, Alexandria, and New Orleans (Nicholls et al., 2008). These cities have high exposure levels because they are densely populated, situated close to sea level and represent major industrial and financial hubs.
Climate change is expected to wreak havoc on human society in many ways. Major costs are associated with the displacement of communities, building degradation, flood damage, loss of tourism, and increased mortality. Table 9.2 below depicts estimated costs of various impacts on human society from climate change in Mumbai.
| TYPE OF IMPACT | TYPE OF COSTS/PERIOD OF IMPACT | COST (millions of US$) |
|---|---|---|
| Dislocation due to extreme events of flooding of low-lying areas every five years until 2050[5] | Cumulative costs from 2005–2050 | 0.57 |
| Material damage to low-lying areas due to extreme events every five years until 2050[6] | Cumulative costs from 2005–2050 | 8.962 |
| Mortality costs due to extreme events of flooding every five years until 2020[7] | Cumulative costs from 2005–2050 | 4.263 |
| Disability-adjusted life years (DALYs) lost due to diseases like marlaria, diarrhoea and leptospirosis[8] | Cumulative costs from 2005–2050 | 4.406 |
| Building foundation damages due to sea-level rise for 2050[9] | Cost estimate for the year 2050 | 2,097.917 |
| Tourism loss resulting from fewer tourists visiting Mumbai[10] | Cost estimate for the year 2050, as compared with the base year 2005 | 2,743.101 |
The impacts of global warming will cause great disruptions to society, and some foreseeable consequences of these impacts include forced migrations and displacement of populations. Though the UNHCR does not formally recognize environmental refugees, the number of persons that are forcibly displaced due to climate change impacts will soon become too great to ignore, and will exert effects on states and human security.
9.2 Current and Future Risks to Human Security
Having reviewed in depth climate change impacts on natural systems and human systems, this section now links them to the four pillars of human security: military/strategic security of the state, economic security, population health, and environmental integrity.
All four pillars define risks to human security that are related to climate change and its impacts. In fact, specific climate change impacts often exacerbate more than one of these pillars. The IPCC AR5 Scenario (IPCC, 2019, Chapter 12, p. 758) states, “human insecurity almost never has single causes, but instead emerges from the interaction of multiple factors. Climate change is an important factor threatening human security through: 1. undermining livelihoods; 2. compromising culture and identity; 3. increasing migration that people would have rather avoided; and 4. challenging the ability of states to provide the conditions necessary for human security.” These four links between human security and climate change identified by the IPCC fit into the domains outlined by the four pillar model.
The World Health Organization published a report in 2017 that explains how the marginal, often unsanitary living conditions of those displaced, are causing increases in diseases such as acute watery diarrhea, measles outbreaks, and noncommunicable diseases. Other major health impacts include severe depression and anxiety, malnutrition in children and infants, and increased deaths from lack of proper treatment and medicine (WHO, 2017). Such adverse effects on health affect civil society, people’s day-to-day lives, the rule of law, social stability and peace, and the financial security of families. Lately, descriptions of climate trauma have appeared in the literature (Richardson, 2018; Woodbury, 2019) — socio-emotional changes in a person’s psychological health that could have severe consequences for social groups.
An event that figures prominently in recent world history is the Syrian Civil War, which began in 2011 and is ongoing at the time of writing, and the Syrian refugee crisis that followed, which had displaced 5.6 million people by September 2018. This example clearly shows how climate change can pose a threat to human security through undermining livelihoods, compromising culture and identity, increasing migration, and challenging the ability of the state to provide security. It is important to note that the Syrian civil war is an extremely complicated political conflict, and the facts presented here serve only to demonstrate the role that climate change played in exacerbating the situation, not in causing the war.
Many scholars saw Syria’s water shortage as a major tipping point in the war, due to the climate change impact of intense drought. Water has always been a sought after resource in Syria, a country considered to be highly water scarce (Guppy & Anderson, 2017). Its water sources such as the Euphrates River and the Yarmouk River, are sources of tension due to management disputes between the countries that share them (Gleick, 2014). From 2006 to 2011, the country experienced a period of extreme drought that made a precarious situation more dire. Agricultural yields dropped, prompting analysts to call it an agricultural failure. Between 2006 and 2011, the United Nations found 75% of farmers’ crops failed and 85% of livestock died from thirst or hunger. Syria’s current drought situation is even more dire than when the war began. In 2016, grain yields dropped to 50% of the yield in 2011. This caused major economic instability for millions of Syrians (FAO, 2016). The combination of water shortage, loss of crops and livestock, and financial hardship catalyzed a mass migration of people from rural areas to urban areas like Homs and Damascus. This put cities under greater stress, with people vying for jobs, food and shelter. This contributed to the social unrest and dissatisfaction with the Assad regime that was already present. While scholars are careful to attribute cause to effect, and still others posit that the Syrian civil war would have happened regardless of a drought, it is mostly agreed upon that the conditions of drought and water shortage, along with the resulting food shortages, exacerbated existing tensions. (Kelley et al., 2015).
The war has been raging since 2011, and over half a million citizens have died (Human Rights Watch, 2018), and over 13.5 million Syrians are in need of humanitarian assistance (UNHCR & Government of Turkey, 2019). The war has created tension between nation states that disagree on the proper action to be taken, and has created tension within nations that are divided on the acceptance of refugees into their societies.
Notwithstanding these breaches of state security and economic security, the Syrian civil war has had a major effect on population health. Many Syrians still living within the nation’s borders are food insecure. The UN Food and Agricultural Organization (FAO, 2016) reports that there are 6.5 million starving Syrians. The World Health Organization published a report in 2017 that explains how the marginal, often unsanitary living conditions of those displaced, are causing increases in diseases such as acute watery diarrhea, measles outbreaks, and noncommunicable diseases. Other major health impacts include severe depression and anxiety, malnutrition in children and infants, and increased deaths from lack of proper treatment and medicine (WHO, 2017).
9.3 Major Culprits and Victims of Climate Change
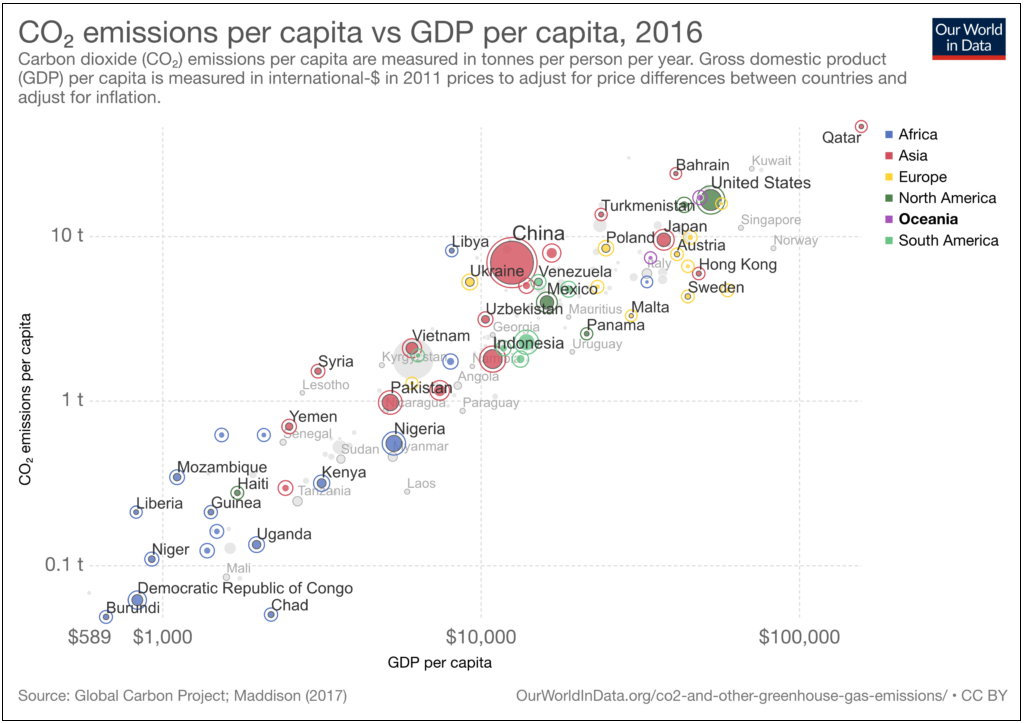
We know greenhouse gas emissions cause climate change, and the major driver for carbon dioxide is the burning of fossil fuels. Other major activities that cause emissions include land use change, agriculture, construction, and the accumulation and production of waste, which also give off the lesser known greenhouse gases methane and nitrous oxide. Extraction and transport of liquefied natural gas causes significant methane emissions, which causes concern because methane is twenty times more powerful than CO2 as a GHG. Emissions are not generated in equal parts from countries around the world. On a global scale, there is a correlation between wealth and higher emissions (Ritchie, 2018). This correlation, shown in Figure 9.2, is seen at the state and city level, as well as on a per capita basis.
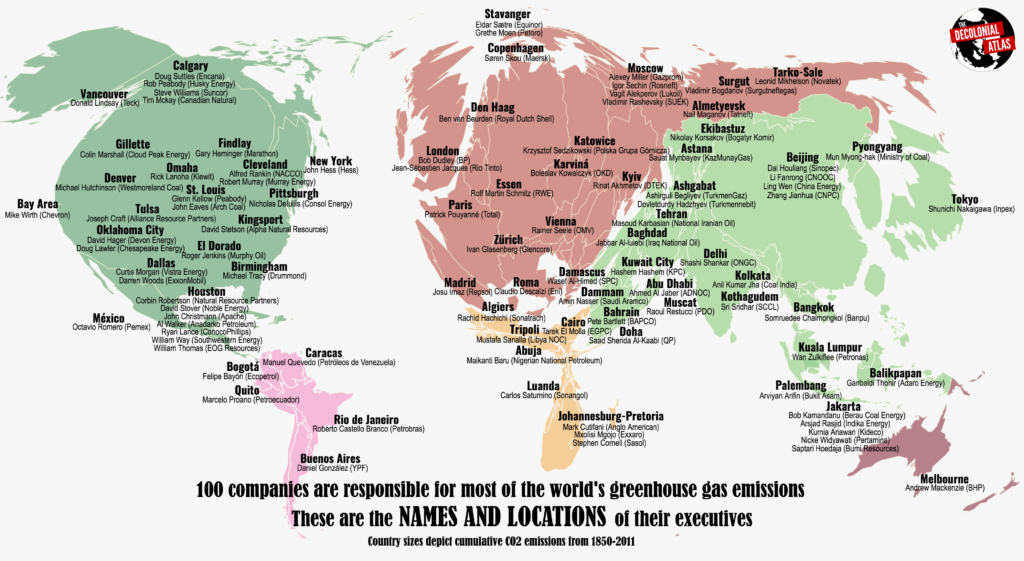
In addition, wealthier and larger companies also generate a disproportionate amount of emissions. The Decolonial Atlas (Engel & Gross, 2019) published the names and locations of the Top 100 people “killing the planet” with the highest emissions of greenhouse gases in the world. To quote the source, “just 100 companies are responsible for more than 70% of the world’s greenhouse gas emissions since 1988. The guys who run those companies — and they are mostly [men] — have gotten rich on the backs of literally all life on earth.” A graphic representation is shown in Figure 9.3.
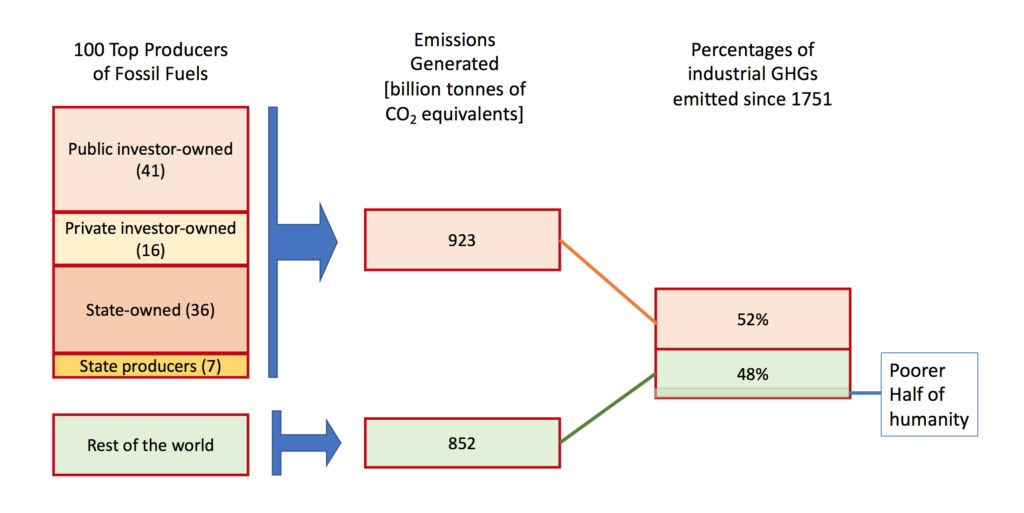
The Carbon Disclosure Project reports on this disproportionality in great detail. In their 2017 report The Carbon Majors Database, its authors show that “over half of global industrial emissions since human-induced climate change was officially recognized can be traced to just 25 corporate and state producing entities” (Griffin, 2017, p. 8). This global corporate hegemony is shown in Figure 9.4. Some of the highest emitting companies include ExxonMobil, Shell, BP, Chevron, and Peabody Energy. Together, these companies made a profit of more than 69 billion dollars in 2018 alone. On the other hand, the world’s poorest 50% of people are responsible for 10% of global emissions (Oxfam, 2015).
In terms of felt impacts, the people and places that bear the greatest burden are those that are vulnerable, populations that are already at risk. It is well-documented that climate change affects all populations and communities across the world, but also that it affects some groups more than others. Poorer populations are not as well equipped to respond to the impacts, and often cannot access the benefits of mitigation and adaptation measures. Other vulnerable populations include the elderly, immigrants, persons with disabilities, children, and people of color. Besides being socioeconomically disenfranchised, these communities tend to live and work in areas and homes that are more exposed to climate hazards. This lack of resilience renders them more exposed to hazards.[11] At-risk populations are also more sensitive to hazards, and have less capacity to adapt to or resist climate hazards. Studies show that these frontline communities are often at a disadvantage when facing climate change impacts because of a lack of resources, less access to benefits or information, as well as structural inequalities, such as racism that is written into legislation or laws. For example, when Hurricane Katrina hit New Orleans, communities of colour were at a disadvantage because the areas they lived in were more exposed to the storm and they had less resources to adapt and respond to the storm. One reason was because these areas had outdated infrastructure from a history of systematic public disinvestment, going all the way back to the practice of “redlining,” the refusal of mortgage loans to communities of color (Mendez et al., 2013). Over time, this contributed to racial segregation where wealthy communities of white Americans live in well-kept neighbourhoods separate from Black communities, who live in less affluent areas that are more rundown and have less access to social services.[12]
The major takeaways from this section are: (a) Greenhouse gas emissions that cause climate change are mostly created by wealthy countries and individuals and (b) the unwanted impacts of climate change are mostly felt by the poor and vulnerable. There is an inherent injustice in climate change, and it has not gone unnoticed by climate action and social justice advocates alike. The result is a global movement of people demanding real action on climate change that uplifts communities that are most vulnerable to climate change. The next section delves deeper into what this means and how people are trying to change it.
9.3.1 Climate Justice
Climate justice is a term coined by activists in the environmental and climate movement who purport that a true climate solution is one that also delivers social justice. Climate justice as a solution to the climate crisis acknowledges the need to deliver equitable measures that are fully accessible by frontline communities and at-risk populations, ensures these vulnerable populations are heard and have a seat at the negotiation table — in that their interests are equally represented, and that these communities can participate in the decision-making processes. Finally, a tenet of climate justice includes the restoration of social and natural systems to the benefit of all populations and future generations. (Parks & Roberts, 2010).
The difference between equity and equality is an important distinction to make when defining climate justice. Both are principles of fairness, but differ in that equity refers to equal access to opportunity and services, whereas equality is the process of treating every person the same. While equality aims to promote fairness, the end result is only ‘fair’ if each person starts from the same place of privilege. For example, a college entrance exam treats every exam taker the same, and allows any high school student to take the exam. However, while it treats every exam taker the same, it does not account for the fact that some students did not have access to a tutor, or a home environment that was conducive to studying, or the money to pay for top of the line high school education that predisposes certain students to a better score, and therefore better chances of doing well on the entrance exam. Further, the students that are primed to do well are then able to get into ‘top’ colleges, and go on to have high paying, desirable jobs. Some colleges are now beginning to understand this inequity in the education system, and are trying to address it through a number of strategies including setting aside a percentage of seats for people from marginalized communities (Bertrand et al., 2010) as well as providing services for these communities throughout their education programmes. In other words, they are trying to develop from the principle of equality towards equity. If the inequities within a system remain unaddressed, often the gap will continue to widen between those who are favoured and those who are not, entrenching those disparities.
Inequities in our education systems can build up over time through structural racism and prejudice. Similar to inequities in the education system, how we respond to climate change can affect whether structural inequities that face marginalized and at-risk communities are further entrenched and whether those who have and those don’t are pushed further apart. In the case of climate change, the injustice is twofold: the wealthy live lives of privilege where increased consumption and frequent travel produce the bulk of greenhouse gases globally, and the poor bear the brunt of the climate change impacts. To further unpack this injustice, fossil fuel companies continue to make immense profits that benefit a small percentage of people in the world at the expense of the many, and at particular expense of vulnerable populations such as people of color and other marginalized communities. Moreover, in many countries fossil fuel production and consumption are still subsidised from public funds.
Climate justice theory posits that any transition to a post-carbon economy must be cognisant of the inherent inequities in climate change, aim to rectify these inequities and refrain from exacerbating them.
9.3.2 Climate Justice in Practice
While the concept of climate justice is relatively new, there are already concrete examples of policy and programmes designed with climate justice as a framework or objective. At the level of a municipality, the District of Columbia’s clean energy plan outlines an entire chapter on “An Equitable Energy Transformation,” and puts forth a framework that takes into account both an equitable process of policy development, as well as an analysis of each proposed policy against risks or barriers to equity in order to design an outcome that uplifts at-risk populations (DC Department of Energy & Environment, 2018). Other US cities such as Philadelphia and Seattle have also taken steps to integrate climate justice into their climate action plans. The United Nations Human Rights Office of the High Commissioner and the Mary Robinson Foundation co-hosted the Climate Justice Dialogue event in Geneva in 2015, which produced the Geneva Pledge for Human Rights in Climate Action, a voluntary initiative supported by 18 countries around the world to “facilitate the exchange of expertise and best practice between our human rights and climate experts to build our collective capacity to deliver responses to climate change that are good for people and the planet” (CIEL, 2015, p. 1). Currently, over 30 countries are signatories to this pledge.
In addition, the United Nations’ 13th Sustainable Development Goal (SDG #13 includes a target to direct $100 billion dollars in funds annually from developed countries to developing countries to support climate change mitigation efforts (UN, n.d.). This redirection of wealth is a step in the right direction for climate justice.
9.4 Barriers to Counteracting Climate Change
In principle, climate change and its consequences can be counteracted through prevention, mitigation and adaptation. As it stands, opportunities for prevention, although abundant throughout the 20th century, have been largely missed; at this stage we can only prevent the worst any more. This is sometimes included in the area of mitigation, which also means that the impact of climate change is lessened. In contrast, adaptation efforts focus on developing ways to live with the consequences as they occur. As the climate crisis unfolded, the spectrum of most effective countermeasures shifted from prevention towards mitigation and adaptation.
So what are the barriers to mitigating the climate crisis and to adapt to its outcomes? Scientists have shown that the many years of gathered and modeled data make the main answer uncompromisingly clear: stop burning fossil fuels, or anything else. The carbon dioxide that comes from burning fossil fuels makes up the majority of the greenhouse gases that are causing climate change. These emissions come from the major sectors of energy, waste, residential and commercial buildings, industry, transport, and agriculture, land use, and forestry (IPCC, 2014a). Curbing emissions from these sectors will require a mix of top-down governmental pressure, and bottom-up demand from citizens and civil society. Climate change is a problem that does not recognize political or geographical boundaries, and thus presents a unique situation in which cooperation from all sectors, all countries, and all people, is required. It also makes it that much harder to solve. In this section, the major barriers to a climate solution are examined.
9.4.1 Technological Barriers
In order to reduce emissions in all sectors, sources used for energy must be low in emissions, or have no emissions altogether. Thermonuclear energy is generally not considered among these options as it entails its own unique set of environmental problems. That leaves industries in the renewable sector. These renewable energy sources include solar, geothermal, wind, and hydroelectricity. Following this solution, mitigation of emissions from abatement technologies, land use change and agriculture should also be addressed. Because of the pressing nature of climate change, all solutions must be pursued, but solving the climate crisis inexorably requires a global transition to clean, renewable energy use.
The transition to the use of renewable energy will not be simple and will require a coordinated effort between many stakeholders. Take, for example, British Columbia’s major source of heating fuel for residential and commercial properties. Natural gas is supplied by five natural gas thermal plants that extract from four fields (Whiticar, 2017). A transition to a renewable thermal energy supply would require an overhaul or redesign of the distribution infrastructure that is currently in place, whether that is geothermal heating, solar thermal energy, or using electric boilers or heat pumps (Boyle, 2004). In addition, a transition away from natural gas would affect those with a vested interest in the industry – including shareholders, workers, and policymakers. It will require a well thought-out, just, and equitable transition plan that takes into account training for workers in renewable energy jobs, assistance to natural gas companies in the transition, both financially and operationally, to renewable energy technology. The ongoing disputes about pipelines illustrate the difficulties.
The technology required to get the world to 100% renewable energy is already available — and is the focus of a few studies globally.[13] [14] More funding and resources should be devoted to testing this model’s capacity to serve a growing population. In addition, scientists and policymakers alike should continue to conduct research and development to advance to renewable energy infrastructure capabilities (i.e. number of people served, improved storage capacity, etc.)
While there is ample public support for renewable energy technology around the world, cultural resistance still exists in many communities. Many people feel resistant to a renewable energy transition because they fear it will change the way they live, or greatly affect an important socio-cultural practice in their lives. This reluctance is supported by conservative media and opinion engineers that tend to enjoy ample funding and political support. They pervade and partially shape our culture.
9.4.2 Culture and Society
While the environmental movement has certainly picked up steam over the last few years, it has not yet moved into the mainstream. Culturally, there are several reasons people have not integrated sustainable habits into their lifestyles. Culture refers to the socially accepted norms and behaviours people engage in, and differences are found from country to country, region to region — between neighbouring cities, and even down to the level of neighbourhoods. These behaviours and norms include the values, attitudes, beliefs, ideals and priorities that children acquire from an early age.
The most prominent reason humans do not opt to change their habits is the ease of retaining and using longstanding, well-established systems and modes of behaviour (status quo bias). To change that can often be time consuming or costly, and sometimes both. For example, sorting through your garbage bin to separate the various recyclable materials takes more time and energy than just throwing it all ‘away’ in the trash. It is more expensive to buy an electric vehicle than a regular gas-guzzling automobile, and it is costly to install a solar photovoltaic energy system onto the roof of a house. Most urban centers are organized around easy flow of traffic and consumer goods, and it is the path of least resistance for most people.
The infographic in Figure 9.5 depicts some other ways a person can reduce their own contribution to climate change.
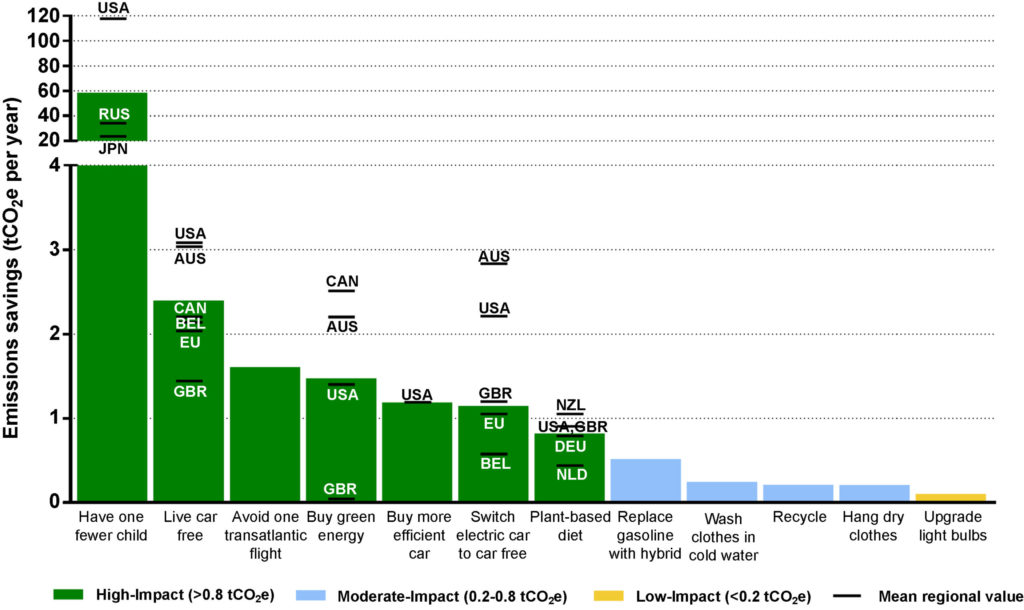
According to Figure 9.2, the top three ways to reduce personal contributions to climate change are: (a) have one fewer child, (b) live car free and (c) avoid one transatlantic flight. Having children is a social and cultural norm in most countries across the globe, and in some places, choosing not to have children can be met with incredulity and disbelief, or worse, criticism. For many, having children and starting a family are major life goals that are equated to success and happiness. Culturally, this is the accepted norm in many countries across the world. The choice to not achieve these normative goals can be alienating and difficult. The second personal choice of living car free is just not feasible for many, especially in North America. Vehicles are the primary mode of transportation for people to get to work or to go on vacation. Cars have, for years, been a symbol of wealth. To many, a car represents freedom and accessibility. Finally, the third choice of avoiding a transatlantic (or equivalent) flight means forgoing a chance to see a loved one across seas, or a sun-drenched vacation after months of hard work. These are choices that are hard to make, and it is much easier for an individual to place greater weight to their immediate enjoyment and pleasure (effectively promoted by ubiquitous advertisements) over the long-term goal of mitigating climate change, an achievement that is not promised or secure, and the rewards of which may never be reaped personally. The change of moral norms is hindered by the fact that ‘carbon solutions’ are still widely perceived as belonging into the domain of ‘environmentalism’; the realisation that carbon mitigation will actually contribute to human security is not yet widespread. This extends even to UNHCR’s refusal to recognise ‘environmental refugees.’
Still, cultural and social norms may not always be the biggest barrier to a renewable energy transition. While these aforementioned barriers to change are real, there is still a strong environmental movement seen across the world advocating and pushing government and corporations for more action on climate change. The school strikes of 2019 and the ‘Extinction Rebellion’ movement impressively demonstrated that. Civil society has a part to play in influencing the market toward greater supply of renewable energy and sustainable products as well as pressuring governments to introduce regulations and legislation that will institute new, sustainable ways of living, and usher in new sociocultural systems. So why has change not occurred to the point where global emissions of GHGs are reduced?
Is the biggest barrier economic? Will the renewable energy transition simply cost too much for the global economic system to bear? The answer, gleaned from many economic and scientific studies, is simply no. On the contrary — it will save us enormous costs down the track (IRENA, 2019).
The renewable energy transition is fundamentally, at its core, a political struggle between current dominant systems of power and privilege and those advocating for new energy systems and a more secure future for all. To understand this conflation of energy and power, the following section will deconstruct the relationship between fossil fuels, money, and political power.
9.4.3 Politics, Money and Power
The world primarily runs on fossil fuels, and it has done so since the Industrial Revolution from approximately 1760. This energy revolution allowed massive leaps forward in technological, economic, and social development. Since then, total global fossil fuel consumption has increased exponentially (see Chapter 3).
During the early age of the Industrial Revolution through to the early 2000s, developed countries like the United Kingdom produced vast amounts of fossil fuel energy, a rate that has slowed in recent years (Tiseo, 2018). The United Kingdom has amassed the wealth and ability to invest in renewable energy technology, and reduce its fossil fuel production as well as its consumption. On the other hand, developing countries like China have seen an explosive increase in rate fossil fuel energy production and consumption. In all, production of all types of fossil fuel energy including coal, oil, and natural gas, has continued to increase globally (Ritchie & Roser, 2019).
The lack of political will is the primary reason why fossil fuel production and consumption have not slowed. While the IPCC, UNEP, and other major world organizations, have called on governments from around the world to limit and decrease fossil fuel production, to place sanctions or a moratorium on explorative drilling for fossil fuels, many countries, states, and cities, are still subsidizing and incentivizing the continued production of fossil fuels. Regimes for emissions trading are taking hold but their benefits accrue too slowly. The failure of governments to act manifests in many ways, including the distortion and obfuscation of evidence that climate change is caused by humans, and the continued subsidization of fossil fuel industries and outright refusal to invest in renewable energy technology.
The fossil fuel industry’s political ties are defined by the grassroots climate activism organization 350.org as a cultivation of “sponsorship relationships.”[15] Fossil fuels have a long history of close political ties to capital, not in the least because of its inherent physical power as an energy resource, and also because it is a source of immense profit and political power. Aside from the often bloody battle for rights to ownership and extraction (Auzanneau, 2018), many human rights violations and atrocities have been supported by partnerships with or directly funded by oil companies (Silverstein, 2014). Often, the extraction of fossil fuels in developing countries profits the company and corrupt politicians while leaving the nation’s citizens impoverished, and decimating the land and its ecosystems. The amassment of wealth in fossil fuel extraction and production over many decades has allowed some people to become very powerful. Jane Mayer documents clearly in her 2016 book “Dark Money,” the rise of the conservative Tea Party in the United States of America, with the systematic funding by billionaires with fortunes steeped in oil, coal, and gas. In this book, Mayer (2016) documents the funding of neoliberal, free market economic ideology in the political arena by billionaires like the Koch brothers and other oil magnates. These powerhouse businessmen have for years set up right wing think tanks, schools and non-profit foundations that either directly preach neoliberal thought or fund its dissemination. This co-option of education, media, and popular culture, makes its way into policy in the form of deregulation. This term is misleading because it does not mean a complete lack of government regulation, but rather it is a set of policies that protect the rights of big business and give free rein to corporations and businesses, leaving little protection for citizens. It is co-option of government by big business, big money, and big oil, to have social and political license to continue to profit from fossil fuel extraction and production. It proceeded in the shadow created by a massive and well-coordinated public relations campaign that obfuscated scientific findings about climate change and financed deceptive efforts to promote false ‘skepticism’, using the same tactics (and specialists) that were employed by the tobacco lobby before (Oreskes & Conway, 2010). A recent analysis indicated that climate ‘contrarians’ (i.e. deniers) enjoy a 49% higher media visibility compared to expert scientists (Petersen et al., 2019).
9.5 Achieving Climate Justice as the Way Forward
This chapter delved into the main drivers of climate change, its impacts, and the primary victims of these impacts. Getting to the heart of why there is still no real progress made in tackling climate change reveals a power imbalance, perpetuated by the wealthy who have made fortunes in dealing fossil fuel energy, and who still hold immense power over politicians, the media and public opinion, and even some science and academic institutions. This power imbalance allows a wealthy few the ability to sow seeds of doubt that pit conservatives against progressives, and to sway government officials in their favour — to perpetuate the status quo. In this imbalance of power that gives corporations more space than citizens at the table to negotiate on behalf of their own profit creates a political system that is no longer democratic. It is often aggravated by undemocratic electoral systems.
Invoking arguments of justice as a way forward to achieve climate security frames the conversation in a way that recognizes that there is inequity in the drivers of climate change, and so any solution should address that inequity and attempt to rectify it. In the allocation of burden as well as benefits, climate justice in practice will aim to uplift the marginalized and make the worst polluters pay their fair share in the transition to renewable energy infrastructure. The restoration of a just process is also necessary, so that corporations with huge pockets cannot co-opt the media and spin a self-serving public narrative nor lobby or bribe the government over the best interests of the public and nature. Finally, framing the climate change conversation in terms of justice acknowledges that a harm to vulnerable and frontline populations, and to the human species at large, has been committed and should be rectified.
The IPCC’s report published in 2018 gives the global community just short of 11 years to limit global warming to 1.5°C (Hoegh-Guldberg et al., 2018). It is unlikely that a consensus will be reached within this short period of time on which effective precautionary measures should be taken. In fact, no matter what mitigation strategies are taken, climate change is already happening, and the current changes to global natural processes could activate feedback processes that accelerate warming far into the future and push Earth into a ‘hothouse’ state — where glaciers are all gone and the Earth’s sea level has risen 100 metres, and extreme conditions are pervasive all over the world.
Continued inaction at this late stage cannot be condoned. The movement advocating for climate justice now spans the globe, with climate rallies and school strikes becoming commonplace and occurring frequently, led by the young Greta Thunberg. Divestment from fossil fuel is steadily increasing. Even some politicians are embracing ideas that were once considered fringe, such as US Representative Alexandria Ocasio-Cortez’s inclusion of an ambitious stimulus package that at once addresses climate change as well as economic inequality in her platform — in other words, it strives to achieve climate justice.[16] While the world has a long way to go, these steps toward real action are promising.
Resources and References
Review
Key Points
- Greenhouse gases have played an important role in the regulation of the Earth’s climate since the planet developed an atmosphere. However, the sudden increase of anthropogenic emissions during the Anthropocene is disrupting that regulation.
- Besides the general increase of average surface temperatures, global warming is causing complex patterns of climate change that vary among regions and latitudes. In addition, the world’s oceans are becoming more acidic, sea levels are rising, permafrost is melting and ocean currents may change.
- The effects of climate change on natural systems affects the ranges of species and generally reduces biodiversity. The changes are occurring faster than natural systems could adapt.
- The effects of climate change on human security operate partly through those biotic effects and partly they arise from severe weather, droughts, crop failures and the displacement of ever larger populations. Especially threatening are the inundation of densely populated coastal plains and shortages of fresh water.
- Those impacts are affecting the world’s poorest most severely, while the levels of GHG emissions are highest with developed countries.
- Climate change can be addressed in principle by prevention, mitigation and adaptation. Apart from preventing the worst outcomes, the emphasis now lies on mitigating its impacts and adapting to those impacts that have become inevitable. The goal is to maximize human security in equitable and just ways.
- Barriers to effective countermeasures are technological, cultural and political. Other sources of human insecurity such as overconsumption, overpopulation, industrial growth, militarization and economic inequity render those countermeasures more difficult to achieve.
Extension Activities & Further Research
- Who are the victims of climate change? While this chapter focused on human inequities, can you think of others?
- While the harm of climate change is undeniable, whether it constitutes an injustice is a matter of personal ethics. Where do you stand on that? Would you extend your interpretation of justice to include nonhumans, ecosystems and the biosphere?
- Identify the major issues and challenges that characterise British Columbia’s transition towards climate neutrality. In what ways are you contributing personally to the problems and to the solutions?
- Explore the interactive presentation of the ‘Global Conveyor Belt.’ Speculate how it is likely to affect the climate of your home region, and how that climate might change if the currents change.
List of Terms
See Glossary for full list of terms and definitions.
- abatement technologies
- climate justice
- divestment
- equity and equality
- Hothouse Earth scenario
- keystone species
- marginalized communities
- mitigation and adaptation
- resilience
- SDG #13
- status quo bias
Suggested Reading
Engel, J., & Gross, D. (2019). The decolonial atlas. https://decolonialatlas.wordpress.com
Levin, K. (2018, October 7) Half a degree and a world apart: The difference in climate impacts between 1.5°C and 2°C of warming. World Resources Institute. Retrieved August 28, 2019, from https://www.wri.org/blog/2018/10/half-degree-and-world-apart-difference-climate-impacts-between-15-c-and-2-c-warming
Oreskes, N., & Conway, E. M. (2010). Merchants of doubt: How a handful of scientists obscured the truth on issues from tobacco smoke to global warming. Bloomsbury.
Steffen, W., Rockström, J., Richardson, K., Lenton, T. M., Folke, C., Liverman, D., Summerhayes, C. P., Barnosky, A. D., Cornell, S. E., Crucifix, M., Donges, J. F., Fetzer, I., Lade, S. J., Scheffer, M., Winkelmann, R., & Schellnhuber, H. J. (2018). Trajectories of the Earth system in the Anthropocene. Proceedings of the National Academy of Sciences of the United States of America, 115(33), 8252–8259. https://doi.org/10.1073/pnas.1810141115
Wynes, S., & Nicholas, K. A. (2017). The climate mitigation gap: Education and government recommendations miss the most effective individual actions. Environmental Research Letters, 12(7). https://doi.org/10.1088/1748-9326/aa7541
References
Auzanneau, M. (2018). Oil, power, and war: A dark history. Chelsea Green Publishing.
Bertrand, M., Hanna, R., & Mullainathan, S. (2010). Affirmative action in education: Evidence from engineering college admissions in India. Journal of Public Economics, 94(1–2), 16–29. https://doi.org/10.1016/j.jpubeco.2009.11.003
Billion Oyster Project. (2019). Our story. https://billionoysterproject.org/about/our-story/
Boulais, M., Chenevert, K. J., Demey, A. T., Darrow, E. S., Robison, M. R., Roberts, J. P., & Volety, A. (2017). Oyster reproduction is compromised by acidification experienced seasonally in coastal regions. Scientific Reports, 7, Article 13276. https://doi.org/10.1038/s41598-017-13480-3
Boyle, G. (Ed.). (2004). Renewable energy (2nd ed.). Oxford University Press.
Britton, D., Cornwall, C. E., Revill, A. T., Hurd, C. L., & Johnson, C. R. (2016). Ocean acidification reverses the positive effects of seawater pH fluctuations on growth and photosynthesis of the habitat-forming kelp, Ecklonia radiata. Scientific Reports, 6, Article 26036. https://doi.org/10.1038/srep26036
C40 Cities. (n.d.). Staying afloat: The urban response to sea level rise. https://www.c40.org/other/the-future-we-don-t-want-staying-afloat-the-urban-response-to-sea-level-rise
Church, J. A., Clark, P. U., Cazenave, A., Gregory, J. M., Jevrejeva, S., Levermann, A., Merrifield, M. A., Milne, G. A., Nerem, R. S., Nunn, P. D., Payne, A. J., Pfeffer, W. T., Stammer, D., & Unnikrishnan, A. S. (2013). Sea level change. In T. F. Stocker, D. Qin, G.-K. Plattner, M. Tignor, S. K. Allen, J. Boschung, A. Nauels, Y. Xia, V. Bex, & P. M. Midgley (Eds.), Climate change 2013: The physical science basis. Contribution of working group I to the fifth assessment report of the Intergovernmental Panel on Climate Change (pp. 1137–1216). Cambridge University Press. https://doi.org/10.1017/CBO9781107415324.026
DC Department of Energy & Environment. (2018). Clean energy DC: The District of Columbia climate and energy action plan. https://doee.dc.gov/cleanenergydc
Doney, S. C., Fabry, V. J., Feely, R. A., & Kleypas, J. A. (2009). Ocean acidification: The other CO2 problem. Annual Review of Marine Science, 1, 169–192. https://doi.org/10.1146/annurev.marine.010908.163834
Engel, J., & Gross, D. (2019). The decolonial atlas. https://decolonialatlas.wordpress.com
Food and Agriculture Organization of the United Nations. (2016). FAO response to the Syria crisis: A call for increased support in agriculture. http://www.fao.org/fileadmin/user_upload/rne/docs/FAO_RSC_2016_EN.pdf
Ge, M., & Friedrich, J. (2020, February 6). 4 Charts explain greenhouse gas emissions by countries and sectors. World Resources Institute. https://www.wri.org/blog/2020/02/greenhouse-gas-emissions-by-country-sector
Giroux, H. A. (2010). The media and Hurricane Katrina: Floating bodies and disposable populations. In G. Martin, D. Houston, P. McLaren, & J. Suoranta (Eds.), The havoc of capitalism: Publics, pedagogies and environmental crisis (pp. 29–51). Brill.
Gleick, P. H. (2014). Water, drought, climate change, and conflict in Syria. Weather, Climate, and Society, 6(3), 331–340. https://doi.org/10.1175/WCAS-D-13-00059.1
Griffin, P. (2017). The Carbon Majors Database: CDP Carbon Majors Report 2017. Carbon Disclosure Project Worldwide. http://www.indiaenvironmentportal.org.in/files/file/Carbon-Majors-Report-2017.pdf
Gruber, N., Clement, D., Carter, B. R., Feely, R. A., van Heuven, S., Hoppema, M., Ishii, M., Key, R. M., Kozyr, A., Lauvset, S. K., Lo Monaco, C., Mathis, J. T., Murata, A., Olsen, A., Perez, F. F., Sabine, C. L., Tanhua, T., & Wanninkhof, R. (2019). The oceanic sink for anthropogenic CO2 from 1994 to 2007. Science, 363(6432), 1193–1199. https://doi.org/10.1126/science.aau5153
Guppy, L., & Anderson, K. (2017). Global water crisis: The facts. Institute for Water, Environment and Health, United Nations University. https://inweh.unu.edu/global-water-crisis-the-facts/
Hoegh-Guldberg, O., Jacob, D., Taylor, M., Bindi, M., Brown, S., Camilloni, I., Diedhiou, A., Djalante, R., Ebi, K. L., Engelbrecht, F., Guiot, J., Hijioka, Y., Mehrotra, S., Payne, A., Seneviratne, S. I., Thomas, A., Warren, R., & Zhou, G. (2018). Impacts of 1.5°C global warming on natural and human systems. In Global warming of 1.5°C: An IPCC Special Report (ch. 3). IPCC. https://www.ipcc.ch/sr15/
Human Rights & Climate Change Working Group. (n.d.). Promoting the Geneva Pledge for Human Rights in Climate Action. https://climaterights.org/our-work/unfccc/geneva-pledge/
Human Rights Watch. (2019). World report 2019: Syria. https://www.hrw.org/world-report/2019/country-chapters/syria
Intergovernmental Panel on Climate Change. (2014a). Climate change 2014: Impacts, adaptation, and vulnerability – Part B: Regional aspects. Contribution of working group II to the fifth assessment report of the IPCC. Cambridge University Press. https://www.ipcc.ch/site/assets/uploads/2018/02/WGIIAR5-PartB_FINAL.pdf
IPCC. (2014b). Climate change 2014: Synthesis report. Contribution of working groups I, II and III to the fifth assessment report of the IPCC. https://www.ipcc.ch/site/assets/uploads/2018/05/SYR_AR5_FINAL_full_wcover.pdf
IPCC. (2014c). Climate change 2014 synthesis report: Summary for policymakers. https://www.ipcc.ch/site/assets/uploads/2018/02/AR5_SYR_FINAL_SPM.pdf
IPCC. (2019, November 4). Scenario process for AR5. https://sedac.ciesin.columbia.edu/ddc/ar5_scenario_process/scenario_background.html
International Renewable Energy Agency. (2019). Global energy transformation: A roadmap to 2050. https://www.irena.org/publications/2019/Apr/Global-energy-transformation-A-roadmap-to-2050-2019Edition
Jevrejeva, S., Jackson, L. P., Grinsted, A., Lincke, D., & Marzeion, B. (2018). Flood damage costs under the sea level rise with warming of 1.5°C and 2°C. Environmental Research Letters, 13(7), Article 074014. https://doi.org/10.1088/1748-9326/aacc76
Kämpf, J., & Chapman, P. (2016). The functioning of coastal upwelling systems. In J. Kämpf & P. Chapman, Upwelling systems of the world: A scientific journey to the most productive marine ecosystems (pp. 31–65). Springer, Cham. https://doi.org/10.1007/978-3-319-42524-5_2
Kelley, C. P, Mohtadi, S., Cane, M. A., Seager, R., & Kushnir, Y. (2015). Climate change in the Fertile Crescent and implications of the recent Syrian drought. Proceedings of the National Academy of Sciences of the United States of America, 112(11), 3241–3246. https://doi.org/10.1073/pnas.1421533112
Knutson, T. R., McBride, J. L., Chan, J., Emanuel, K., Holland, G., Landsea, C., Held, I., Kossin, J. P., Srivastava, A. K., & Sugi, M. (2010). Tropical cyclones and climate change. Nature Geoscience, 3(3), 157–163. https://doi.org/10.1038/ngeo779
Kumar, R., Jawale, P., & Tandon, S. (2008). Economic impact of climate change on Mumbai, India. Regional Health Forum, 12(1), 38–42. World Health Organization, Regional Office for South-East Asia. https://apps.who.int/iris/handle/10665/205777
Levin, K. (2018, October 7) Half a degree and a world apart: The difference in climate impacts between 1.5°C and 2°C of warming. World Resources Institute. Retrieved August 28, 2019, from https://www.wri.org/blog/2018/10/half-degree-and-world-apart-difference-climate-impacts-between-15-c-and-2-c-warming
Mayer, J. (2017). Dark money: The hidden history of the billionaires behind the rise of the radical right. Anchor Books.
Mendez, D. D., Hogan, V. K., & Culhane, J. F. (2014). Institutional racism, neighborhood factors, stress, and preterm birth. Ethnicity & Health, 19(5), 479–499. https://doi.org/10.1080/13557858.2013.846300
National Hurricane Center. (2018, January 26). Costliest U.S. tropical cyclones tables updated [Press release]. https://www.nhc.noaa.gov/news/UpdatedCostliest.pdf
National Ocean Service. (n.d.). The global conveyor belt. https://oceanservice.noaa.gov/education/tutorial_currents/05conveyor2.html
Nicholls, R. J., Hanson, S., Herweijer, C., Patmore, N., Hallegatte, S., Corfee-Morlot, J., Château, J., & Muir-Wood, R. (2008). Ranking port cities with high exposure and vulnerability to climate extremes (OECD Environment Working Papers No. 1). Organisation for Economic Co-operation and Development. https://doi.org/10.1787/011766488208
Ocean circulation is changing, and we need to know why [Editorial]. (2018). Nature, 556(7700), 149. https://doi.org/
Oreskes, N., & Conway, E. M. (2010). Merchants of doubt: How a handful of scientists obscured the truth on issues from tobacco smoke to global warming. Bloomsbury Press.
Oxfam. (2015, December 2). Extreme carbon inequality: Why the Paris climate deal must put the poorest, lowest emitting and most vulnerable people first [Media briefing]. https://www-cdn.oxfam.org/s3fs-public/file_attachments/mb-extreme-carbon-inequality-021215-en.pdf
Parks, B. C., & Roberts, J. T. (2010). Climate change, social theory and justice. Theory, Culture & Society, 27(2–3), 134–166. https://doi.org/10.1177/0263276409359018
Petersen, A. M., Vincent, E. M., Westerling, A. L. (2019). Discrepancy in scientific authority and media visibility of climate change scientists and contrarians. Nature Communications, 10, Article 3502. https://doi.org/10.1038/s41467-019-09959-4
Pfahl, S., O’Gorman, P. A., & Fischer, E. M. (2017). Understanding the regional pattern of projected future changes in extreme precipitation. Nature Climate Change, 7(6), 423–427. https://doi.org/10.1038/nclimate3287
Richardson, M. (2018). Climate trauma, or the affects of the catastrophe to come. Environmental Humanities, 10(1), 1–19. https://doi.org/10.1215/22011919-4385444
Ritchie, H. (2017). Fossil fuels. Our World in Data. https://ourworldindata.org/fossil-fuels
Ritchie, H. (2018, October 16). Global inequalities in CO2 emissions. Our World in Data. https://ourworldindata.org/co2-by-income-region
Robinson, E., & Robbins, R. C. (1968). Sources, abundance, and fate of gaseous atmospheric pollutants: Final report and supplement. Stanford Research Institute.
Rogelj, J., den Elzen, M., Höhne, N. Fransen, T., Fekete, H., Winkler, H., Schaeffer, R., Sha, F., Riahi, K., & Meinshausen, M. (2016). Paris Agreement climate proposals need a boost to keep warming well below 2°C. Nature, 534(7609), 631–639. https://doi.org/10.1038/nature18307
Sambaraju, K. R., Carroll, A. L., & Aukema, B. H. (2019). Multiyear weather anomalies associated with range shifts by the mountain pine beetle preceding large epidemics. Forest Ecology and Management, 438, 86–95. https://doi.org/10.1016/j.foreco.2019.02.011
Silverstein, K. (2015). The secret world of oil. Verso Books.
Simonsen, S. H., Biggs, R. (O.)., Schlüter, M., Schoon, M., Bohensky, E., Cundill, G., Dakos, V., Daw, T., Kotschy, K., Leitch, A., Quinlan, A., Peterson, G., & Moberg, F. (n.d.). Applying resilience thinking: Seven principles for building resilience in social-ecological systems [Brochure]. Stockholm Resilience Centre. https://www.stockholmresilience.org/download/18.10119fc11455d3c557d6928/1459560241272/SRC%20Applying%20Resilience%20final.pdf
Smale, D. A., Wernberg, T., Oliver, E. C. J., Thomsen, M., Harvey, B. P., Straub, S. C., Burrows, M. T., Alexander, L. V., Benthuysen, J. A., Donat, M. G., Feng, M., Hobday, A. J., Holbrook, N. J., Perkins-Kirkpatrick, S. E., Scannell, H. A., Gupta, A. S., Payne, B. L., & Moore, P. J. (2019). Marine heatwaves threaten global biodiversity and the provision of ecosystem services. Nature Climate Change, 9(4), 306–312. https://doi.org/10.1038/s41558-019-0412-1
Sönnichsen, N. (2020). Total fossil fuel extraction in the United Kingdom (UK) from 1998 to 2017. Statista. https://www.statista.com/statistics/888014/total-fossil-fuel-extraction-united-kingdom-uk/
Steffen, W., Rockström, J., Richardson, K., Lenton, T. M., Folke, C., Liverman, D., Summerhayes, C. P., Barnosky, A. D., Cornell, S. E., Crucifix, M., Donges, J. F., Fetzer, I., Lade, S. J., Scheffer, M., Winkelmann, R., & Schellnhuber, H. J. (2018). Trajectories of the Earth system in the Anthropocene. Proceedings of the National Academy of Sciences of the United States of America, 115(33), 8252–8259. https://doi.org/10.1073/pnas.1810141115
United Nations. (n.d.). #Envision2030 goal 13: Climate action. https://www.un.org/development/desa/disabilities/envision2030-goal13.html
UN High Commissioner for Refugees. (2019). Syria regional refugee response. Refugees Operational Data Portal. https://data2.unhcr.org/en/situations/syria#_ga=2.196078885.846482909.1565844576-1392904182.1565844576
van Vuuren, D. P., Edmonds, J., Kainuma, M., Riahi, K., Thomson, A., Hibbard, K., Hurtt, G. C., Kram, T., Krey, V., Lamarque, J.-F., Masui, T., Meinshausen, M., Nakicenovic, N., Smith, S. J., & Rose, S. K. (2011). The representative concentration pathways: An overview. Climate Change, 109(1–2), Article 5. https://doi.org/10.1007/s10584-011-0148-z
Whiticar, M. (2016). B.C. energy maps. EnergyBC. http://www.energybc.ca/index.html
Woodbury, Z. (2019). Climate trauma: Toward a new taxonomy of trauma. Ecopsychology, 11(1), 1–8. https://doi.org/10.1089/eco.2018.0021
World Health Organization. (2017). World health statistics 2017: Monitoring health for the SDGs (Sustainable Development Goals). https://apps.who.int/iris/bitstream/handle/10665/255336/9789241565486-eng.pdf?sequence=1
World Ocean Review. (2010). The great ocean currents: The climate engine. https://worldoceanreview.com/en/wor-1/climate-system/great-ocean-currents/
Wynes, S., & Nicholas, K. A. (2017). The climate mitigation gap: Education and government recommendations miss the most effective individual actions. Environmental Research Letters, 12(7), Article 074024. https://doi.org/10.1088/1748-9326/aa7541
Long Descriptions
Figure 9.2 long description: Scatter plot of CO2 emissions per capita versus GDP per capita in 2016. The subtitle says, “Carbon dioxide (CO2) emissions per capita are measured in tonnes per person per year. Gross domestic product (GDP) per capita is measured in international dollars in 2011 prices to adjust for price differences between countries and adjust for inflation.” On the x-axis is GDP per capita, and on the y-axis is CO2 emissions per capita.
The scatter plot shows the general trend that a country with a larger GDP per capita also has greater CO2 emissions per capita. Most points are bunched closely together on a diagonal that goes from the bottom-left corner to the top-right corner. Data points differ in size, most likely because of population.
Here are some individual data points, with exact figures taken from this interactive version of the CO2 emissions per capita versus GDP per capita scatter plot:
- In the bottom-left corner is Burundi, with a tiny dot representing GDP per capita of 665 international dollars and 0.05 tonnes of CO2 emissions per capita.
- In the middle of the lower end of the pack is Kenya, with a small dot representing a GDP per capita of 3,169 international dollars and 0.35 tonnes of CO2 emissions per capita.
- Closer to the centre is Indonesia, with a mid-sized dot representing a GDP per capita of 10,911 international dollars and 2.14 tonnes of CO2 emissions per capita.
- China, near the centre and above Indonesia, has the largest dot, representing a GDP per capita of 12,569 international dollars and 6.86 tonnes of CO2 emissions per capita.
- The United States, with a relatively large dot close to the top-right corner, has a GDP per capita of 53,015 international dollars and 16.43 tonnes of CO2 emissions per capita.
- Qatar is closest to the top-right corner, with a tiny dot representing a GDP per capita of 156,029 international dollars and 41.23 tonnes of CO2 emissions per capita.
Figure 9.3 long description: Cartogram of carbon emissions with many cities labelled. The caption says, “100 companies are responsible for most of the world’s greenhouse gas emissions. These are the names and locations of their executives. Country sizes depict cumulative CO2 emissions from 1850–2011.” Beneath each labelled city are the names and companies of the executives who live there.
The cities with the most executives from top-polluting companies are Houston (seven), Jakarta (five), Calgary (four), Moscow (four), Beijing (four), and Johannesburg-Pretoria (three). Many of the companies whose executives are shown on the map produce oil or energy. Executives are depicted in every corner of the world. Some of the most distorted countries are the United States, Germany, the United Kingdom, South Africa, Japan, and South Korea.
Figure 9.4 long description: Breakdown of the sources of greenhouse gas emissions since 1751.
This chart shows that 52 per cent of industrial green house gases emitted since 1751 have come from 100 producers of fossil fuels. Out of those 100 top producers, 41 are public investor–owned, 16 are private investor–owned, 36 are state-owned, and seven are state producers. Those 100 entities have generated 923 billion tonnes of CO2 equivalents.
The other 48 per cent of industrial greenhouse gases emitted since 1751 have come from the rest of the world, totalling 852 billion tonnes of CO2 equivalents. Just a sliver of that 48 per cent (perhaps 5 per cent) of emissions have come from the poorer half of humanity.
Figure 9.5 long description: Bar graph depicting the emissions savings of certain personal choices, measured in tonnes of carbon dioxide equivalents (tCO2e) per year. Actions are coded as high impact (saving more than 0.8 tCO2e), moderate impact (saving 0.2 to 0.8 tCO2e), and low impact (saving less than 0.2 tCO2e). Where information is available, the average impact of personal choices in particular countries is indicated.
The action with the highest impact by far is choosing to have one fewer child, which saves an average of 58.6 tCO2e per year and an average of 117.7 tCO2e per year in the United States. Other high-impact personal choices include the choice to live car free, avoid one transatlantic flight, buy green energy, buy a more efficient car, switch from an electric car to a car-free lifestyle, and to adopt a plant-based diet, all of which save between 0.8 and 2.4 tCO2e per year on average.
Some actions have greater impact in particular countries. For example, living car free saves an average of 3.08 and 3.04 tCO2e per year in the United States and Australia, respectively, compared to 2.4 tCO2e per year on average around the world. Buying green energy in Canada and Australia saves an average of 2.51 and 2.2 tCO2e per year, respectively, compared to 1.5 tCO2e per year on average around the world.
Moderate-impact actions include the choice to replace a gasoline-powered car with a hybrid, wash clothes in cold water, recycle, and hang clothes to dry, all of which save between 0.2 and 0.8 tCO2e per year on average.
The one low-impact action depicted is the choice to upgrade light bulbs, which saves an average of 0.10 tCO2e per year.
Media Attributions
- Figure 9.1 © 2015 Nathan Hughes Hamilton is licensed under a CC BY (Attribution) license
- Figure 9.2 © 2017 Hannah Ritchie and Max Roser is licensed under a CC BY-NC-SA (Attribution NonCommercial ShareAlike) license
- Figure 9.3 © 2019 Jordan Engel is licensed under Decolonial Media License 0.1
- Figure 9.4 © 2020 Alex Lautensach is licensed under a CC BY-NC-SA (Attribution NonCommercial ShareAlike) license
- Figure 9.5 © 2017 Seth Wynes & Kimberly A. Nicholas is licensed under a CC BY (Attribution) license
- The major greenhouse gases include water vapour, carbon dioxide, methane, nitrous oxide and ozone. Problematic is not their natural production (which has long kept our planet hospitable) but their excessive, anthropogenic emission in recent decades, including synthetic GHGs such as chlorofluorocarbons and hydrofluorocarbons. ↵
- Data sources: Ge & Friedrich, 2020; Levin, 2018. ↵
- See Climate change has caused an 89% decrease in new coral in the Great Barrier Reef, study finds. ↵
- Data source: Kumar et al., 2008 ↵
- The costs of work disruption and material damage, as well as mortality costs (loss of earnings) have been computed on the basis of a conservative approach wherein it has been assumed that flooding would be limited to five days in a year and also that the frequency of such extreme occurrences shall be once every five years. The computation has been limited to the year 2050. It also conservatively assumes that the population in these areas will not change, though it would change depending upon the local government policy of development relevant to the time frame up to 2050. Population figures have been taken from the census for locations shown in Figure 9.1 based on the area and density of population. ↵
- See Footnote #5. ↵
- See Footnote #5. ↵
- Increase in the incidence of malaria, diarrhoea and leptospirosis would result in loss of income due to non-working days and deaths. Losses have been computed using Disability-adjusted life years (DALYs) for all the major illnesses likely to impact the population. Incidence of all these illnesses will increase steadily with increase in income loss; a sharp increase is likely from 2045 to 2055. By 2050 the cumulative income loss due to malaria, diarrhoea and leptospirosis, calculated on the basis of DALYs will be 155 597 and 2401 crores [1 crore = 100,000], respectively. The calculation of DALYs is based on the World Health Organization (WHO) guidelines 8 and 9, and income levels prevalent for Mumbai. ↵
- Due to sea-level rise there will be loss of coastal area and ingress of sea water. Assuming that sea water penetrates 200 m inland, calculations have been made showing the monetary loss due to buildings getting affected in the region near the shore. The current loss has been computed on the basis of the present value of buildings. This is based on the assumption that buildings along the coastline located within 200 m from the shore will get affected due to rise in the sea level and ingress of sea water. ↵
- Calculations are based on Tourism Statistics of India10. Future costs have been calculated using the average gross domestic product (GDP) growth rate of India. It also takes the current rates of 6% and 13% increase respectively in domestic and foreign tourism per year into account. ↵
- In the context of environmental challenges to social-ecological systems, resilience is defined by the Stockholm Resilience Centre as “the capacity of a system, be it an individual, a forest, a city or an economy, to deal with change and continue to develop. It is about how humans and nature can use shocks and disturbances like a financial crisis or climate change to spur renewal and innovative thinking.” (https://www.stockholmresilience.org/research/research-news/2015-02-19-what-is-resilience.html accessed 2 Aug 2019; See also Simonsen et al., 2014) ↵
- See also Giroux, H.A., 2010. “The Media and Hurricane Katrina: Floating Bodies and Disposable Populations”, pp. 29–51. ↵
- See Ram M., D. Bogdanov, A. Aghahosseini, A.S. Oyewo, A. Gulagi, M. Child, H-J. Fell & C. Breyer. Global Energy System Based on 100% Renewable Energy – Power Sector. Study by Lappeenranta University of Technology and Energy Watch Group, Lappeenranta, Berlin, November 2017. ↵
- See Jacobson, M.Z., M.A. Delucchi, Z.A. Bauer, S.C. Goodman, W.E. Chapman, M.A. Cameron, … & J.R. Erwin. 2017. 100% clean and renewable wind, water, and sunlight all-sector energy roadmaps for 139 countries of the world. Joule 1(1): 108-121. ↵
- See About fossil free divestment by the 350.org website. ↵
- See and download the US Congress resolution Recognizing the duty of the Federal Government to create a Green New Deal. ↵
Applying the principles of justice (distributive, procedural, punitive, restorative, intergenerational) to address the inequities between culprits and victims of climate change (Chapter 9).
This scenario is based on a global runaway greenhouse effect that may well render the planet uninhabitable to all but microorganisms. The planet Venus is thought to have undergone such a process (Chapter 9).
A keystone species plays a crucial role in how a particular ecosystem functions without which the ecosystem would collapse into a fundamentally different form or cease to exist (Chapter 9).
Strategies for addressing climate change based on the assumption that some climate change is now inevitably taking its course. Mitigation focuses on lessening the impacts while adaptation focuses on learning to live with them (Chapter 9).
The capacity of a system to cope with change, shocks and disturbances and continue to develop; the ability of a system to deal with disturbance while reorganizing so as to maintain the same overall structure, function and feedbacks (Chapter 9, Chapter 11).
Equity refers to equal access to opportunity and services according to individual needs, whereas equality is the principle of treating every person the same. Only the former takes into account differences in opportunity (Chapter 9).
Communities or groups that exhibit significantly lower socioeconomic status, political representation, cultural status or other forms of empowerment than the rest of their social environment (Chapter 9).
The thirteenth of the United Nations Sustainable Development Goals which aims to mobilize US $100 billion annually by 2020 to decrease the global carbon footprint and to promote climate change (Chapter 9).
Technologies that reduce emissions or that decrease their harmfulness by changing their chemical composition (Chapter 9).
A bias in perception or in preferences that favours those conditions that one has become accustomed to; it is seen with individuals, groups and entire cultures (Chapter 9).
The movement of invested funds away from a specific industry or business (Chapter 9).
