Tools for Spatial Data Collection and Utilization
Geographic Information
Geographic information is the collection of information about places and events that occur on the Earth’s surface. Geographic information science (GIScience) is the study of organizations and tools associated with the process of collecting and disseminating geographic information. GIScience research includes topics that relate to cartography, remote sensing, photogrammetry, web mapping and spatial data organization. Digital data management of spatial information is also associated with GIScience.
As we have seen throughout this book, there are a wide range of ways in which GIScience can help solve real-world problems. In this section, a range of tools associated with the collection and distribution of spatial data are presented as well as recommendations for further reading.
Geographic Information Systems (GIS)
Geographic information systems (GIS) are systems for input, storage, manipulation, summarizing, editing, querying and visualizing geographic information. (Read more in Longley, Goodchild, Maguire, & Rhind, 2005).
Surveying
Surveying is the science of accurate measurement of natural and humanmade features on the Earth. Data collected by surveyors are then used to create highly precise maps. Surveyors calculate the precise position of points, distances and angles through geometry.
Remote Sensing
Remote sensing is the use of satellites orbiting the Earth to capture information of the surface and atmosphere. Satellites vary in spatial and spectral resolution. These signals are then transmitted to receiving stations on Earth where they can be transformed and distributed as digital images to be analyzed. Through the use of remote sensing, applying specific calculations to images can help spatial information analyst identify and classify features on a landscape such as changes in snowmelt and identifying the location of seasponges[1] without physically setting foot in that region. Remote sensing can be used to sense changes in ground cover, locate the presence of surficial minerals and identify the location of different types of vegetation. Both the Government of British Columbia[2] and the Government of Canada[3] extensively utilize remote sensing.
Maps
Maps are mathematical representations of Earth and the Earth’s surface. They can be used for geospatial data storage, spatial exploratory functions and as an analytical tool. Maps are a medium for visual communication of geospatial information relationships and depict human perception of the world. They can be used as spatial decision-making tools. For further study on maps, try the map reading skills crash course at http://www.wikihow.com/Read-a-Map
Cartography
Cartography is the design, construction and evaluation of maps. When designed well, maps can be powerful communication tools. The practice of cartography may require the knowledge of graphic design, computer science, mathematics, statistics, psychology and, most certainly, geography. The purpose of a map is to reduce the complexity of the real world to communicate a specific idea. A map should be quickly and easily interpreted by the viewer. All maps must include a legend to inform the user what is being represented, a north arrow or compass to orient the user and a scale bar to to reveal the dimensions being represented on the map. Cartographic principles are in place to guide cartographers. (Read more in Slocum, McMaster, Kessler, & Howard, 2009.)
Geovisualization
Geovisualization is the display of geospatial information to be explored interactively in an effort to facilitate the process of hypothesis formation and knowledge construction (Dodge, McDerby, & Turner, 2008; Dykes, MacEachren, & Kraak, 2005; Kraak & MacEachren, 2005; MacEachren & Kraak, 2001). Data exploration is an individual activity in which unknown spatial patterns are revealed in an interactive environment (Slocum, McMaster, Kessler, & Howard, 2009). A major difference between static cartography and geovisualization is interaction, and with geovisualizations it is possible that some information may go unnoticed without that interaction. Geovisualizations make it possible to provide more than one view (through multimedia, or another map, or tables or graphics). Geovisuazliations allow users to interact with data drawing their own conclusions and making them feel like they have made a new discovery.
There are a wide varity of software packages available to create maps and geovisaulziations. A few software packages currently available and widely used are:
- QGIS, a free and open source software (FOSS), meaning that it is free of charge and the code is made publicly available to be manipulated and improved. Additional tools and plug-ins are constantly being created. QGIS can be run on Mac or PC. http://www.qgis.org/en/site/
- ArcGIS, a proprietary software and industry standard
Increasingly, anyone with Internet access can utilize simple GIS capabilities through online mapping platforms such as a digital earth. Digital globes or web maps are interactive digital representations of the Earth’s surface. Applications associated with Web maps include information systems used for online travel and hotel bookings, finding restaurants and getting directions to a desired location. Application programming interface (API) make it possible to harness information from online resources such as social media outlets and other data repositories that can then be collected and integrated with a map.
Digital Globes
Digital globes are three-dimensional representations of the Earth in high-resolution format. The aim of a globe is to reduce distortion and reveal spatial relationships between places. Digital globes provide many advantages. The user is able to scale up or down with ease since they are highly interactive. Digital globes are easy to transport since they are accessible on mobile and desktop computers, files can be shared easily and each user can choose a topic of interest to overlay on the globe. As well, they are dynamic and can be outfitted with up-to-date information. Interacting with digital globes is fun because the user can pan and zoom anywhere in the world on the fly.
Popular digital globes that also have an API associated to assist in the creation of “mashups” include:
- Google Earth
- Google Maps: proprietary data sources
- OpenStreetMap: all data have been contributed volunteerarily by citizens uploading and digitizing spatial data
- Yahoo Maps
- MapQuest
Smartphones are pervasive among the general public and can be used to collect all sorts of spatial data. Most smartphones have built-in sensors that are able to document spatial data. Two ways in which you have likely interacted with geospatial technology and geographic information science with a smartphone are through volunteered geographic information and location-based services.
Volunteered Geographic Information (VGI)
Volunteered geographic information (VGI) is information collected by users roving the surface of the Earth. VGI is the contribution of content regarding local activities in various geographic locations around the world that may traditionally go unnoticed by the rest of the world’s media. People now have the ability to share qualitative or quantitative information with an Internet-enabled audience about their experience in a specific place in the world. VGI is typically collected and shared through the use of smartphones. Examples of VGI include checking into a location using Facebook or Foursquare, geotagging a photo and sharing a restaurant review on Yelp. When you use a new application you should be asked “Does this app have permission to use your locational information?” If you answered “yes” for the camera application on your phone, geocoded coordinates will be applied to the metadata associated with the image file so you can then map your photo at a later time, or an application associated with your phone will map your photos for you. This could be considered VGI.
Location-Based Services (LBS)
Location-based services (LBS) are services that offer information about where a location-aware device user is situated (Gartner, Cartwright, & Peterson, 2007; Jiang & Yao, 2007). Examples include popular applications such as Google Maps.
VGI and LBS and the collection of other types of spatial data are not possible without sensors for collecting spatial data.
With the increased computing capabilities and decrease in cost for hardware, collecting spatial data is becoming more and more accessible and feasible for the public. There are several options for collecting your own local spatial data and it can be done with relatively low-cost resources.
Global Positioning System (GPS)
A global positioning system (GPS) is a satellite network that communicates with GPS receivers accessed by mobile users. The GPS receiver needs to connect with four or more satellites orbiting the Earth, as reference to calculate the precise location of the user within a few metres. GPS satellites were launched by the United States military but are also used for civilian use. GPS receivers are widely used in cars and smartphones to provide directions to specific locations. Individual GPS recievers can be purchased and installed on almost anything. Physical geographers and human geographers alike find them valuable for documenting information about place.
Data formats collected by the GPS can be exported from many different file formats to be used in a wide variety of software platforms.
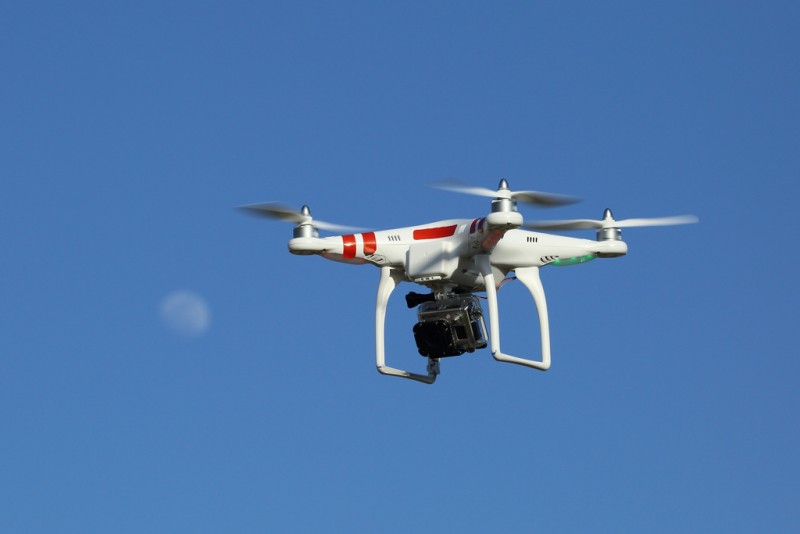
For collecting your own up-to-date aerial photos you can mount cameras and GPS sensors to drones or unmanned aerial vehicle (UAV) ages, or by balloon mapping.
An example of balloon mapping
The interactive aerial map below shows an example of balloon mapping. If you are reading this in print, you can view the map at http://archive.publiclaboratory.org/leaflet/?tms=http://mapknitter.org/tms/ne-false-creek/&lon=-123.1058161843&lat=49.2763304549&zoom=17
If you are interested in trying out balloon or kite mapping yourself, you’ll find some do-it-yourself resources at http://publiclab.org/wiki/balloon-mapping.
Existing Spatial Data Sources
Several government and other organizations often make spatial data publicly available in a variety of formats that are relatively easy for the general public to use through the creation of mash-ups. Mash-ups are web pages that take data from two different sources or sets and put them together. Just two examples of mash-ups include taking data from Vancouver open data and overlaying them on a Google maps.
- Vancouver Open Data in file formats compatible with the Web, Google Maps and Google Earth, ArcGIS and QGIS and several other file formats compatible with accessible software systems. http://vancouver.ca/your-government/open-data-catalogue.aspx
- British Columbia Open Data http://www.data.gov.bc.ca/dbc/geographic/index.page?WT.svl=Breadcrumb
- Canada wide data offered by the Canadian government in file formats compatible with QGIS and ArcGIS. http://geogratis.cgdi.gc.ca/
There are far more available online, and they will change rapidly. There is increasing expectation that data should be made publicly available.
Ethical Considerations
When creating maps and interacting with spatial data, ethical considerations are required. It is important to consider what is and is not being represented on a map, and who and who is not being represented in a data set. Geospatial information is inherently sensitive because it is tied to specific locations and people. When building applications that collect or share personal information, it is important to consider whether the people who are being represented know that their information is being used and how it is being used. Privacy of information laws must be considered. (To read more about the ethical implications of mapping, see Crampton, 2010.)
References
Crampton, J. 2010, Mapping: A Critical Introduction to Cartography and GIS, First edn, Wiley-Blackwell.
Dodge, M., McDerby, M. & Turner, M. 2008, Geographic visualization : concepts, tools and applications, Wiley, Chichester, England ; Hoboken, NJ.
Dykes, J., MacEachren, A.M. & Kraak, M.J. 2005, Exploring geovisualization, 1st edn, Elsevier, Amsterdam.
Elwood, S. & Leszczynski, A. 2013, “New spatial media, new knowledge politics”, Transactions of the Institute of British Geographers, vol. 38, no. 4, pp. 544-559.
Gärtner, G., Cartwright, W. & Peterson, M.P. 2007, Location based services and telecartography, Springer, Berlin.
Jiang, B. & Yao, X. 2007, “Location based services and GIS in perspective” in Location based services and telecartography, eds. G. Gärtner, W. Cartwright & M.P. Peterson, Springer, Berlin, pp. 27.
Kraak, M.J. & MacEachren, A.M. 2005, “Geovisualization and GIScience”, Cartography and Geographic Information Science, vol. 32, no. 2, pp. 67-67.
Leszczynski, A. & Wilson, M.W. 2013, “Theorizing the geoweb”, GeoJournal, .
Longley, P., Goodchild, M., Maguire, D. & Rhind, D. 2005, Geographic Information Systems and Science, John Wiley and Sons, England.
MacEachren, A.M. & Kraak, M.J. 2001, “Research challenges in geovisualization”, Cartography and Geographic Information Science, vol. 28, no. 1, pp. 3-12.
Slocum, T., McMaster, R., Kessler, F. & Howard, H. 2009, Thematic cartography and geographic visualization, 3rd edn, Pearson/Prentice Hall, Upper Saddle River, NJ.
Suggested readings
Cartography. 2005. Deetz C. H. US. Coast and Geodetic Survey. University Press of the Pacific.
Elements of Cartography. 1995. Robinson. A. H. Morrison J. L. Muehrcke P. C. A. Kimerling. J, Guptill. S. C. Wiley.
Making Maps, Second Edition: A Visual Guide to Map Design for GIS. 2011. Krygier. J. and Wood. D., The Guilford Press.
Thematic Cartography and Geovisualization. 2008. Slocum. T. A. McMaster. R. B. Kessler. F. C. and Howard. H. H., Prentice Hall.
- Modeling the Distribution of Geodia Sponges and Sponge Grounds in the Northwest Atlantic http://www.plosone.org/article/info%3Adoi%2F10.1371%2Fjournal.pone.0082306#pone-0082306-g011 ↵
- Examples of how the government of British Columbia uses remote sensing can be found at http://www.for.gov.bc.ca/hts/rs/ ↵
- Examples of how the government of Canada uses remote sensing can be found at http://www.nrcan.gc.ca/forests/remote-sensing/13429 ↵
