Book 6 Review
You will now practice all the skills you learned in Book 6. You can use this as a review for your final test.
If you can’t remember how to do a question, go back to the lesson on this topic to refresh your memory. The unit and topic for where each question came from is listed next to the question.
Unit 1
1-A
- Write the ratios asked for.
- Lillian biked for 6 hours, and covered a total of 45 km. What is the ratio of kilometers to hours?
- Nine hundred cars were lined up at the ferry terminal. 300 hundred cars got on the next sailing. Write a ratio of how many cars were left behind to how many cars got on the first sailing.
1-B
- Simplify these ratios.
- [latex]9:12[/latex]
- [latex]50:5[/latex]
- [latex]56:7[/latex]
- [latex]100:120[/latex]
- Write the following ratios as rates.
- 110 kilometres to 2 hours
- 9 cups of flour to 3 tablespoons of yeast
- 240,000 people to 300 square kilometers
1-C
- Solve these proportions.
- [latex]1:3 = \textit{N}:12[/latex]
- [latex]25:\textit{N} = 20:4[/latex]
- [latex]\textit{N}:49 = 14:98[/latex]
- [latex]4\tfrac{1}{2}:6 = \textit{N}:3.6[/latex]
- The dose for cough syrup is 20 millilitres for each 100 pounds of body weight. How much should be given to a 34 pound child? Round to the nearest millilitre.
Unit 2
2-A
- Write these percents using numerals and the percent sign.
- seventy-two percent
- three-fourths percent
- one hundred two percent
- Write these percents in words.
- [latex]12\%[/latex]
- [latex]\tfrac{1}{5}\%[/latex]
- Change the percents to equivalent decimals.
- [latex]17\%[/latex]
- [latex]98\tfrac{1}{2}\%[/latex]
- [latex]\tfrac{1}{3}\%[/latex]
- Write the decimals as percents.
- [latex]0.45[/latex]
- [latex]4.75[/latex]
- [latex]0.099[/latex]
- Change each percent to an equivalent common fraction. Put the fraction in lowest terms.
- [latex]33\tfrac{1}{3}\%[/latex]
- [latex]14\%[/latex]
- [latex]250\%[/latex]
- Write the percent equivalent
- [latex]\tfrac{1}{5}[/latex]
- [latex]\tfrac{2}{3}[/latex]
- [latex]\tfrac{1}{4}[/latex]
Unit 3
3-A
- Find the answers.(Express percents rounded to the nearest tenth, money to the nearest cent and decimals to the nearest thousandth. Please show all your work. Use proportion.)
- [latex]13\%\text{ of }52 =[/latex]
- [latex]\tfrac{9}{10}\%\text{ of }2,400[/latex] is .
- What is [latex]135\%\text{ of }1,080[/latex]?
- Solve these problems. Be sure to show all your work.
- Marianne is renovating her kitchen, and she is ordering everything from her local hardware store. She is getting a sink for $204.79, a dishwasher for $524.95, a counter for $949.99, flooring for $719.95, and a fridge for $579.49.
- Calculate the HST (12%).
- Calculate the total cost, including the taxes.
- Shane sold a home for $340,500.00 for a client. He earned 6% commission. How much money did Shane make?
- A love seat is originally priced at $904.00, it is offered at 45% off. What is the discount price?
- Calculate the total cost in Canadian dollars of this purchase made in the United States. Assume $1.00 Canadian = $0.92 U.S.
[latex]\text{Clothes} – \text{Total price in }$\text{US} = $317.98[/latex].- Price in Canadian dollars
- Duty at 13.5%
- Total of Canadian value + duty
- HST (12%) on Canadian value + duty
- Total cost in Canadian dollars
- Marianne is renovating her kitchen, and she is ordering everything from her local hardware store. She is getting a sink for $204.79, a dishwasher for $524.95, a counter for $949.99, flooring for $719.95, and a fridge for $579.49.
Unit 4
4-A
- Find the answers.
- 34 is what percent of 85?
- What % of 150 is 114?
- 33⅓% of what number is 60?
- 32 is 20% of what number?
- 75% of what number is 675?
- 3.75 is 1¼% of?
- Solve these problems. Be sure to show all your work.
- A printer is priced at $399. It is marked 30% off.
- What is the sale price of the printer?
- What is the cost of this printer with HST (12%)?
- The Vancouver Fire and Rescue Service has 797 uniformed personnel, about 0.8% are women. About how many women are in uniform in the Vancouver Fire and Rescue Service? Answer to the nearest whole number (since you cannot have a fraction of a person).
- Jake is a computer salesperson. He receives a monthly salary of $1,055 plus 15% on all his sales over $5,500. What was his total monthly earnings if his sales were
$12,400 in one month? - The local ski hill sold 3,800 season’s passes in 2009. The 2010 sales are down 10.5%. Find the number of season’s passes sold in 2010.
- A printer is priced at $399. It is marked 30% off.
Unit 5
5-A
- Line graph.
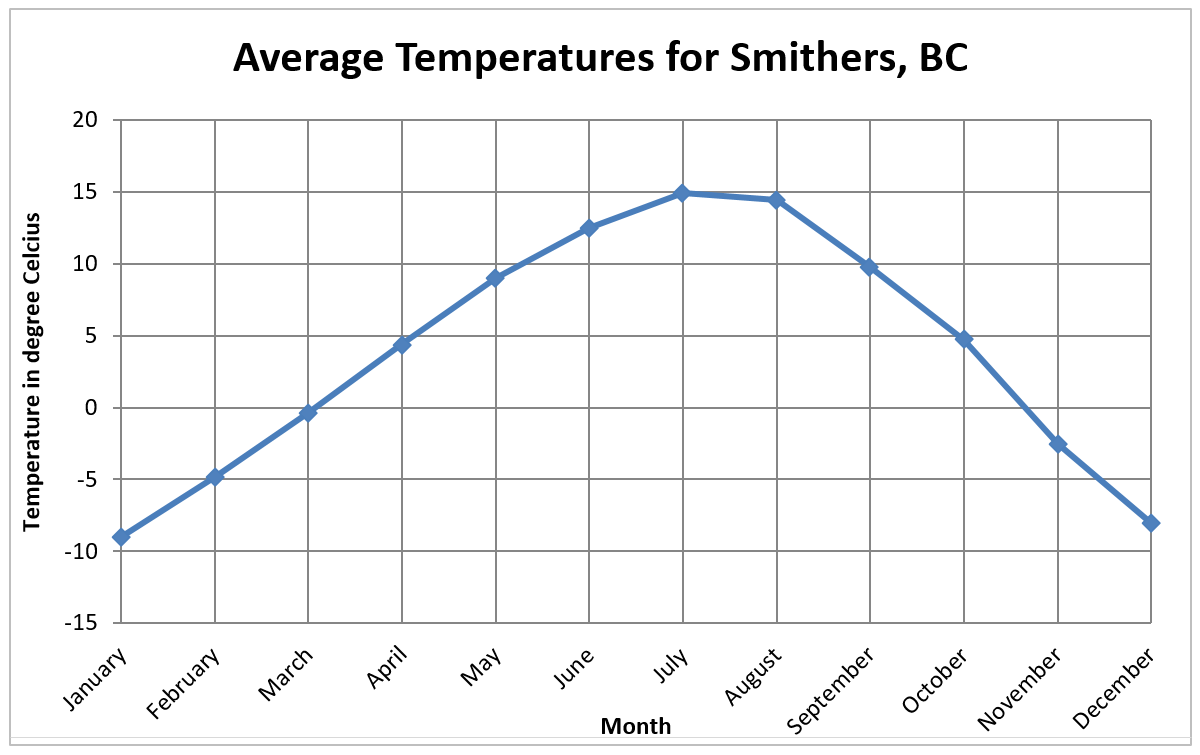
[Image Description] - Which month has the highest temperature in Smithers?
- Which month has the lowest temperature in Smithers?
- Between the months of January to July, is there an increase or decrease in temperature?
- What is the difference between the monthly temperature for August and the monthly temperature for October?
- What is the trend of the temperature in Smithers?
5-B
- Bar graph.
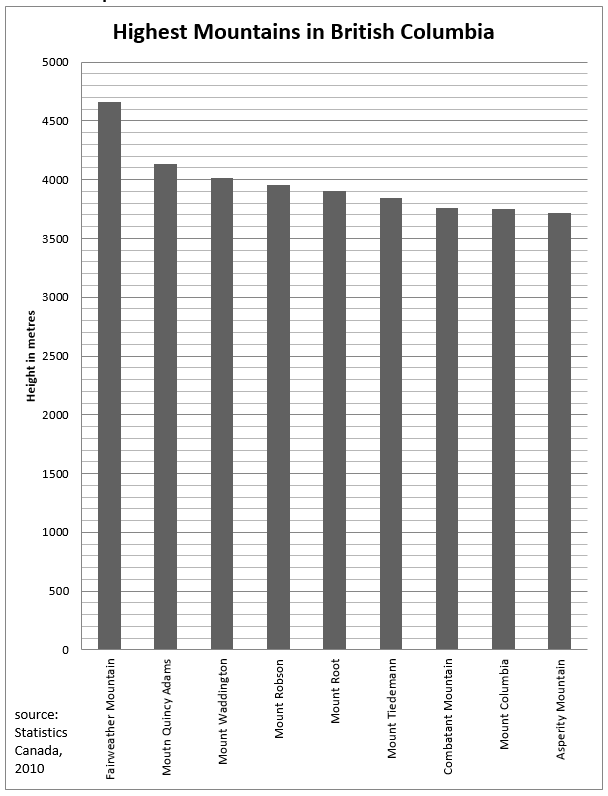
[Image Description] - What is the height of the tallest mountain in BC?
- How many mountains are over 4,000 metres and under 5,000 metres in height?
- Which two mountains in this chart are very similar in height?
- What is the difference (approximately) in height between Fairweather Mountain and Asperity Mountain?
5-C
- Picture graph.
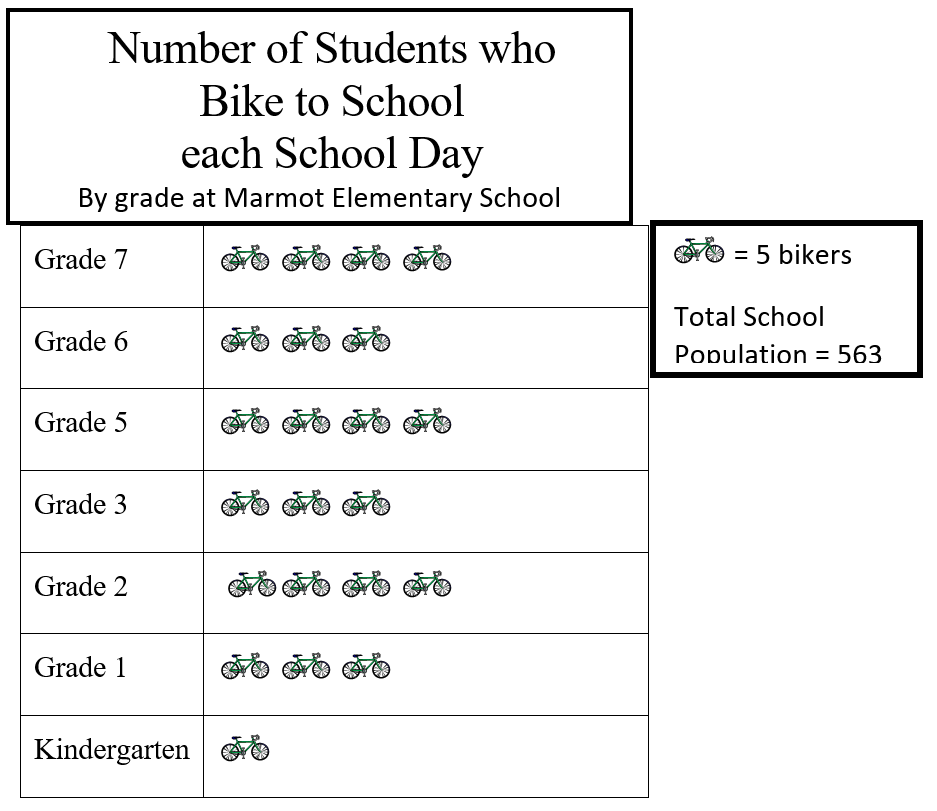
[Image Description] - How many students in grade 2 ride bikes to school?
- Which classes have the most bikers?
- Which class has the least bikers?
- How many more bikers are in grade 7 than kindergarten?
- How many students bike in total?
- What percent of the school bikes each day?
5-D
- Circle graph.
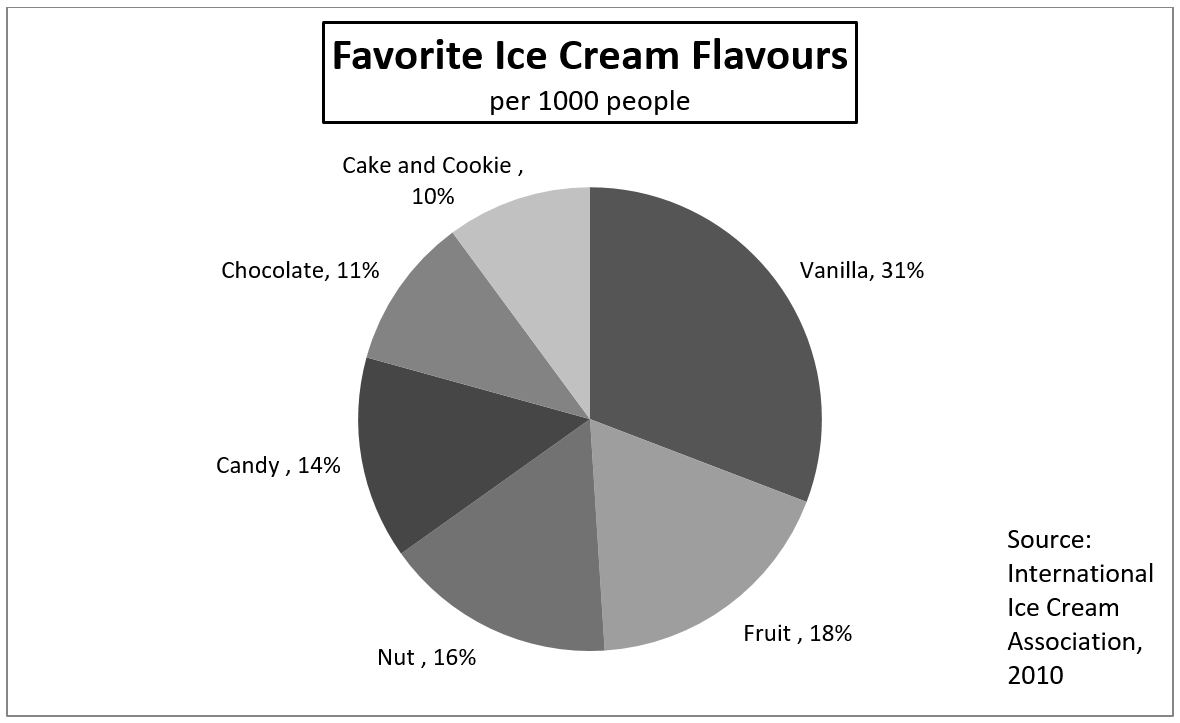
[Image Description] - Which is the most favourite ice cream flavour?
- Which is the least liked ice cream flavour?
- How many people (out of 1,000) like fruit-flavoured ice cream?
- What percentage of people like vanilla over chocolate?
Answers to Book 6 Review
-
- [latex]45:6[/latex]
- [latex]600:300[/latex]
-
- [latex]3:4[/latex]
- [latex]10:1[/latex]
- [latex]8:1[/latex]
- [latex]5:6[/latex]
-
- 55 km/hr or [latex]55 \text{km}:1 \text{hr}[/latex]
- 3 cups of flour to 1 tbsp of yeast
- 800 people to 1 square km
-
- [latex]4[/latex]
- [latex]5[/latex]
- [latex]7[/latex]
- [latex]2.7[/latex]
- [latex]7\text{ mL}[/latex]
-
- [latex]72\%[/latex]
- [latex]\tfrac{3}{4}\%[/latex]
- [latex]102\%[/latex]
-
- Twelve percent
- One-fifth percent
-
- [latex]0.17[/latex]
- [latex]0.985[/latex]
- [latex]0.00\overline{3}[/latex]
-
- [latex]45\%[/latex]
- [latex]475\%[/latex]
- [latex]9.9\%[/latex]
-
- [latex]\tfrac{1}{3}[/latex]
- [latex]\tfrac{7}{50}[/latex]
- [latex]2\tfrac{1}{2}[/latex]
-
- [latex]20\%[/latex]
- [latex]66.\overline{6}\%[/latex] or [latex]66\tfrac{2}{3}\%[/latex]
- [latex]25\%[/latex]
-
- [latex]6.76[/latex]
- [latex]21.6[/latex]
- [latex]1,458[/latex]
-
-
- $357.50
- $3,336.67
- $20,430.00
- $497.20
-
- $345.63
- $46.66
- $392.29
- $47.07
- $439.36
-
-
- [latex]40\%[/latex]
- [latex]76\%[/latex]
- [latex]180[/latex]
- [latex]160[/latex]
- [latex]900[/latex]
- [latex]300[/latex]
-
-
- $279.30
- $312.82
- 6
- $2,090
- 3,401
-
-
- July
- January
- Increase
- Approximately 9 degrees
- The temperature goes up from January to July, and goes down from July to December
-
- Approximately 4,650 metres
- 3
- Combatant Mountain and Mount Columbia
- Approximately 950 metres
-
- 20
- Grades 2, 5, 7
- Kindergarten
- 15
- 110
- Approximately 19.5%
-
- Vanilla
- Cake and cookie
- 180
- 20%
Image Descriptions
Graph 1 (Line Graph)
A line graph displays the average temperature in Smithers, BC each month.
- The horizontal axis lists each month of the calendar year.
- The vertical axis is temperature in degrees Celsius, and contains the numbers -15 to 20 in increments of 5.
The line graph data is represented in the following table:
| Month (Horizontal Axis) | Temperature in Degrees Celsius (Vertical Axis) |
|---|---|
| January | ~−9 |
| February | ~−5 |
| March | ~0 |
| April | ~5 |
| May | ~9 |
| June | ~12.5 |
| July | ~15 |
| August | ~14 |
| September | ~10 |
| October | ~5 |
| November | ~−2.5 |
| December | ~−8 |
Graph 2 (Bar Graph)
A bar graph displays the height of the highest mountains in British Columbia in metres.
- The horizontal axis lists the following mountains: Fairweather Mountain, Mount Quincy Adams, Mount Waddington, Mount Robson, Mount Root, Mount Tiedemann, Combatant Mountain, Mount Columbia, and Asperity Mountain.
- The vertical axis is height in metres, and contains the numbers 5,000 in increments of 100.
The bar graph data is represented in the following table:
| Mountain (Horizontal Axis) | Height in metres (Vertical Axis) |
|---|---|
| Fairweather Mountain | ~4,650 |
| Mount Quincy Adams | ~4,100 |
| Mount Waddington | ~4,000 |
| Mount Robson | ~3,950 |
| Mount Root | ~3,900 |
| Mount Tiedemann | ~3,850 |
| Combatant Mountain | ~3,750 |
| Mount Columbia | ~3,750 |
| Asperity Mountain | ~3,700 |
| Source: Statistics Canada, 2010 | |
Graph 3 (Picture Graph)
A picture graph displays the number of students at Marmot Elementary School who bike to school each day by grade.
- The vertical axis lists the following grades at Marmot Elementary School: Grade 7, Grade 6, Grade 5, Grade 3, Grade 2, Grade 1, and Kindergarten.
- The horizontal axis contains pictures of bicycles, with each bicycle representing 5 bikers according to the legend.
- The total school population is 563 students.
The picture graph data is represented in the following table:
| Grade (Vertical Axis) | Pictures of Bikes (Horizontal Axis) |
|---|---|
| Grade 7 | 4 |
| Grade 6 | 3 |
| Grade 5 | 4 |
| Grade 3 | 3 |
| Grade 2 | 4 |
| Grade 1 | 3 |
| Kindergarten | 1 |
Graph 4 (Circle Graph)
A circle graph displays the favourite ice cream flavours per 1,000 people.
- The entire graph represents all 1,000 people surveyed for their favourite ice cream flavour.
- Each part represents an ice cream flavour and its popularity as a percent of the whole. The flavours are (clockwise from top): Vanilla, Fruit, Nut, Candy, Chocolate, and Cake and Cookie.
The circle graph data is represented in the following table:
| Flavour | Percentage of Total |
|---|---|
| Vanilla | 31% |
| Fruit | 18% |
| Nut | 16% |
| Candy | 14% |
| Chocolate | 11% |
| Cake and Cookie | 10% |
- Source: Internal Ice Cream Association, 2010 ↵
