Unit 5: Statistics
Topic C: Picture Graphs
Picture graphs are similar to bar graphs. Picture graphs show comparisons between quantities. A little picture represents a certain amount. Look for the legend to find out that amount. Picture graphs will give fractions of a picture also. For example, if the picture represents 100 things, half a picture would be 50.
Graph 1
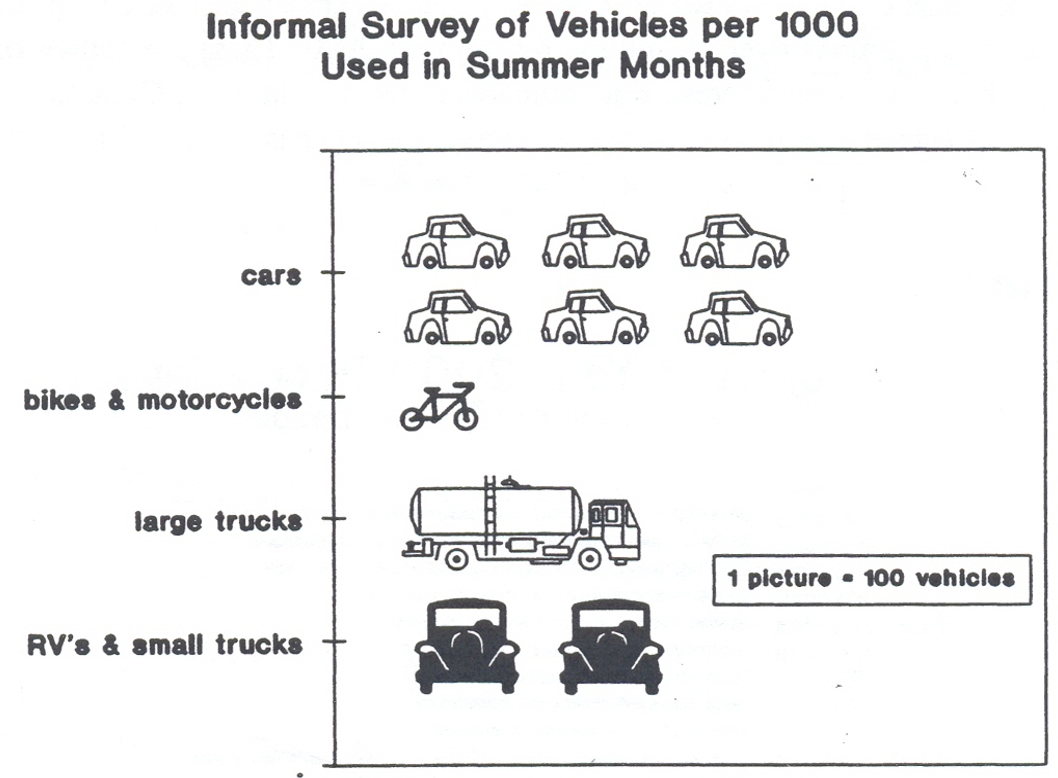
- As a quick first impression when you look at this graph, which type of vehicle is most in use?
- What does each picture represent according to the legend?
- Out of every 1,000 vehicles, how many are:
- cars?
- bikes and motorcycles?
- large trucks?
- RVs and small trucks?
- Look for other examples of picture graphs in the newspaper and in magazines. Television programs often display picture graphs to illustrate statistics.
Answers for Graph 1
- car
- 100 vehicles
-
- 600
- 100
- 100
- 200
Image Descriptions
Graph 1 (Picture Graph)
A picture graph showing the results of an informal survey of vehicles per 1,000 used in summer months.
- The vertical axis is vehicles, and contains the following types of vehicles: cars, bikes & motorcycles, large trucks, and RVs & small trucks.
- The horizontal axis is pictures of vehicles, each of which stands for 100 vehicles of the corresponding type according to the legend.
The picture graph data is represented in the following table:
| Type of Vehicle (Vertical Axis) | Number of Pictures (Horizontal Axis) |
|---|---|
| Cars | 6 |
| Bikes & Motorcycles | 1 |
| Large Trucks | 1 |
| RVs and Small Trucks | 2 |
