Unit 5: Statistics
Introduction and Vocabulary
The word graph comes from a Greek word meaning to write or draw.
Graphs are a special type of drawing or picture showing how numbers relate to each other. Graphs are a convenient way to organize numbers. You may know the old saying, “One picture is worth a thousand words.” Graphs give us a general picture of the information to look at first. The details of the information can then be read from the graph.
In this unit you will practice reading five types of graphs: line graphs, bar graphs, histograms, picture graphs, and circle graphs. You will also learn about reading charts and tables.
Study this vocabulary:
- Axis: An axis is any straight line used for measuring or as a reference. In graphs, we talk about two axes (axes is the plural of axis).
- The horizontal axis goes across the page. (You will learn in later math courses that the horizontal axis is the x-axis.)
- The vertical axis goes up and down the page. (The vertical axis is the y-axis.)
Here is a trick to remember the difference between horizontal and vertical:
-
- The horizon is that line of earth you see as you look out at a view.
- The word horizontal comes from the root word horizon. The horizon goes from left to right, so does the horizontal line in a graph.

- Titles: Titles of a graph give important information about the graph and often tell more about what the scale means.
- Scale: Each axis has a scale. The scale is a series of numbers; beside or below the numbers will be a few words telling what the numbers represent. The numbers we want to place on the graph can be read from the scales. The horizontal scale describes the positions on the horizontal (x) axis. The vertical scale describes the positions on the vertical (y) axis.
- Source: Graphs often give information that has been collected from other reports or publications. The source of the information should be written under the graph. Knowing where the information has come from helps you decide the accuracy of the information in the graph.
- Trend: The trend is the general direction of events, the general idea of changes that are occurring. For example, there is an upward trend in the cost of houses.

Image Descriptions
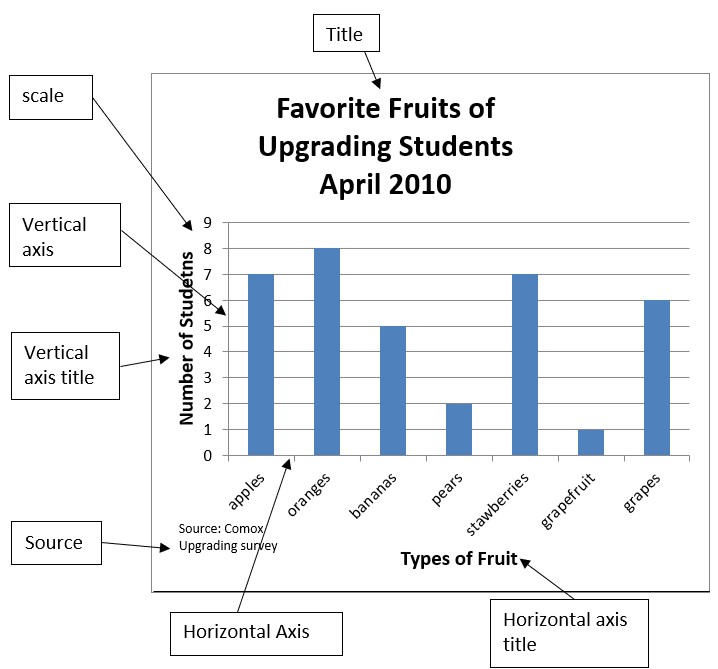
Bar Graph Image: A bar graph showing the favourite fruits of upgrading students. The graph is labelled with the following:
- Title: Favourite Fruits of Upgrading Students April 2010
- Vertical axis title: Number of students
- Vertical axis scale: The numbers 0 to 9
- Horizontal axis title: Types of Fruit
- Horizontal axis: Apples, oranges, bananas, pears, strawberries, grapefruit, grapes
- Source: Comox Upgrading Survey
Image Attributions
- “Row of Trees on the Horizon” by Martin Vorel is licensed under a CC0 Licence.

