2.1 Display Data
The following activities and questions relate to material covered in Chapter 2.1 Display Data in Introductory Business Statistics (OpenStax).
Data sets for the following questions are available in Excel: 2.1 Data Sets [XLSX].
Questions
- The annual Canadian CO2 emissions from 2003 to 2009 are as follows.
Year CO2 Emissions (kt) 2003 553,101 2004 553,358 2005 561,425 2006 571,993 2007 571,846 2008 561,781 2009 532,192 - Organize the data into a line graph.
- Calculate the sample mean.
- The table below is the number of police officers and crime rate (each per 100,000 citizens) in Canada during the period from 2009 to 2019.
Number of police officers and crime rate (each per 100,000 citizens) [1] Year Number of Police Officers Crime Rate 2009 200 6461 2010 203 6159 2011 202 5780 2012 200 5638 2013 197 5206 2014 194 5061 2015 193 5232 2016 191 5297 2017 189 5375 2018 185 5514 2019 183 5874 - Construct a double time series graph using a common x-axis for both sets of data and different y-axes.
- How did variables change for both data sets? Explain.
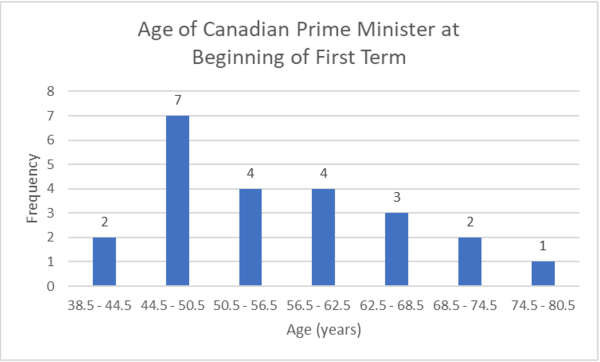
- Construct a histogram of the ages of Prime Ministers at the time of their being sworn into the position by the Governor General using the table below:
Ages of Prime Ministers at the time of being sworn into the position [2] Age of Canadian Prime Minister (yrs.) Frequency 38.5 - 44.5 2 44.5 - 40.5 7 50.5 - 56.5 4 56.5 - 62.5 4 62.5 - 68.5 3 68.5 - 74.5 2 74.5 - 80.5 1 - Assume a sample of 66 people in northern Canada were asked how often they go on vacations a year.
- Create a table with columns for frequency, relative frequency, and cumulative frequency for each number category of vacations taken (i.e., 0, 1, 2…).
- Construct a bar chart/histogram of the data.
- Describe two features of the bar chart.
Solutions
-
- Line graph of Canadian CO2 Emissions from 2003 - 2009:
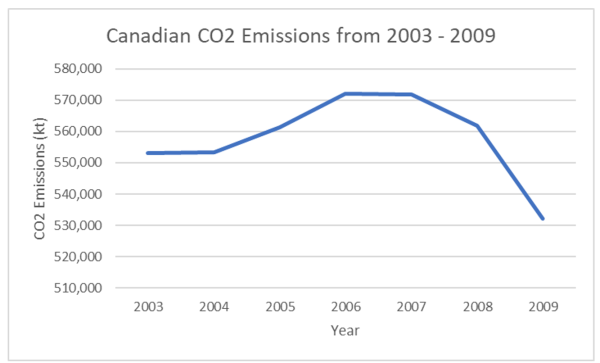
- [latex]\begin{array}{ll}\text{Sample mean}&= \dfrac{553101+553358+561425+571993+571846+561781+532192}{7}\\&= 557,956\text{ kt}\end{array}[/latex]
- Line graph of Canadian CO2 Emissions from 2003 - 2009:
-
- Double time series graph of number of police officers and crime rate in Canada:
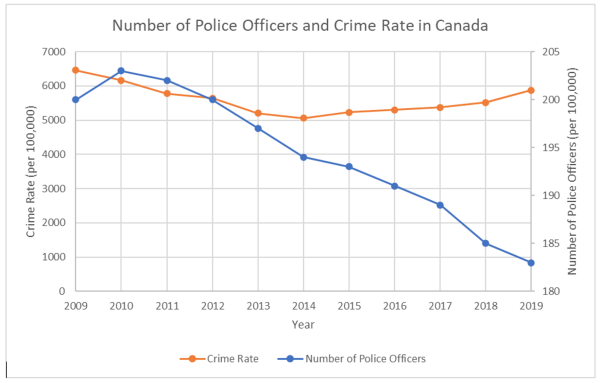
- Crime rate decreased between 2009 and 2014, then increased until 2019. The number of police officers steadily decreased between 2010 and 2019.
- Double time series graph of number of police officers and crime rate in Canada:
- Histogram of age of Canadian Prime Minister at the beginning of their first term:
-
-
Number of Annual Vacations Frequency Relative Frequency 0 2 3.03% 1 6 9.09% 2 11 16.67% 3 27 40.91% 4 12 18.18% 5 8 12.12% - Histogram of Yukoners' Annual Vacations:
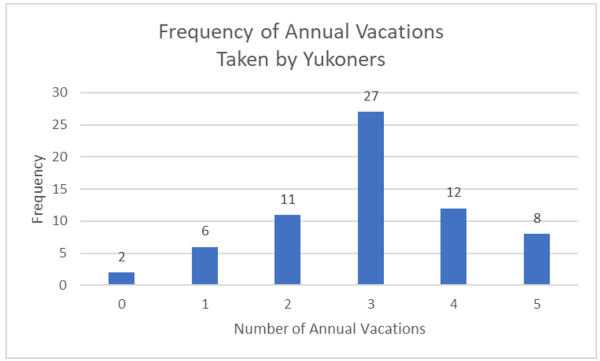
- Yukoners are most likely to take 3 annual vacations. The data is negatively skewed.
-
- Data source: Statistics Canada. (2020). Table 3 Trends in police personnel, Canada, 1962 to 2019. https://www150.statcan.gc.ca/n1/pub/85-002-x/2020001/article/00015/tbl/tbl03-eng.htm. Statistics Canada. (2020). Table 7 Police-reported crime rate, Canada, 2009 to 2019. https://www150.statcan.gc.ca/n1/pub/85-002-x/2020001/article/00010/tbl/tbl07-eng.htm ↵
- Data source: Wikipedia. (n.d.). List of prime ministers of Canada. https://en.wikipedia.org/wiki/List_of_prime_ministers_of_Canada ↵
