2.3 Measures of the Center of the Data
The following activities and questions relate to material covered in Chapter 2.3 Measures of the Center of the Data in Introductory Business Statistics (OpenStax).
Data sets for the following questions are available in Excel: 2.3 Data Sets [XLSX].
Questions
- Eleven selected Northern Canadian Adventure salespersons were asked the number of guests they sold the full package winter adventure to in one week during the pandemic in northern Canada January 2021: four salespeople answered 20 bookings; two salespeople answered 6 bookings; five salespeople answered 11 bookings. What is the sample mean, median and mode?
- Twelve car-selling agencies in northern Canada were asked the number of cars they generally sell in a week. Two of them answered that they generally sell two cars; three of them said that they generally sell three cars; three answered four cars; and the four said that they sell five cars a week. Calculate the sample mean, median, and mode of this data.
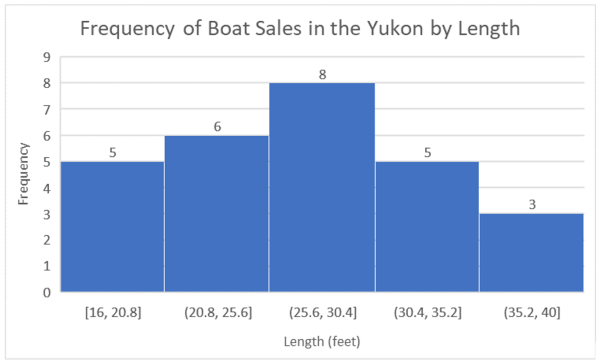
- The following data show the lengths (in feet) of boats that sold in northern British Columbia and Yukon. The data are ordered from smallest to largest: 16; 17; 19; 20; 20; 21; 23; 24; 25; 25; 25; 26; 26; 27; 27; 27; 27; 29; 30; 32; 33; 33; 34; 35; 37; 39; 40.
- What is the sample mean, median and mode?
- Create a histogram to display the data distribution.
- Ten random Yukon University Bachelor of Business Administration students were given a general business-related test during their first year. In their final year, the same students were again tested with the same test. The questionnaire score totaled 100. Both scores listed below:
Student Beginning Score Ending Score 1 61 81 2 62 83 3 67 85 4 68 91 5 68 91 6 68 95 7 72 95 8 73 95 9 74 95 10 79 96 - What is the average improvement?
- Does it matter if the means are subtracted, or the individual values are subtracted?
Solutions
- The sample mean is [latex]\dfrac{(4 × 20) + (2 × 6) + (5 × 11)}{11}=\dfrac{147}{11}[/latex] = 13.36 sales
The median is 11 sales.
The mode is 11 sales. - Sample order: 2 2 3 3 3 4 4 4 5 5 5 5
Sample mean = [latex]\dfrac{2\times2+3\times3+3\times4+4\times5}{12}[/latex]=3.75 car sales
Median = [latex]\dfrac{4+4}{2}[/latex] = 4 car sales
Mode = 5 car sales -
- The sample mean is:
[latex]\dfrac{16 + 17 + 19 + 20 + 20 + 21 + 23 + 24 + 25 + 25 + 25 + 26 + 26 + 27 + 27 + 27 + 27 + 29 + 30 + 32 + 33 + 33 + 34 + 35 + 37 + 39 + 40}{27} = \dfrac{73}{27}[/latex] = 27.3 feet.
The median is 27 feet.
The mode is 27 feet. - Histogram of frequency of boat sales in Yukon
- The sample mean is:
-
- The average beginning score is 69.2% and the average ending score is 90.7%, so the overall average improvement is 21.5%.
- To answer the previous question, it does not matter if the differences are taken after averages or averages are taken after individual differences.
