2.2 Measures of the Location of the Data
The following activities and questions relate to material covered in Chapter 2.2 Measures of the Location of the Data in Introductory Business Statistics (OpenStax).
Data sets for the following questions are available in Excel: 2.2 Data Sets [XLSX].
Questions
- This is a table of monthly ticket sales at the Yukon Beringia Interpretive Centre in 2018.
Monthly Ticket Sales at Yukon Beringia Interpretive Centre [1] Month Beringia 2018 Ticket Sales Relative Frequency Cumulative Frequency January 673 February 814 March 1670 April 1303 May 1347 June 3519 July 4745 August 4065 September 1808 October 1170 November 1475 December 1309 - Complete the table.
- What proportion of 2018 ticket sales were sold in July and August?
- What proportion of ticket sales in the first 8 months of 2018?
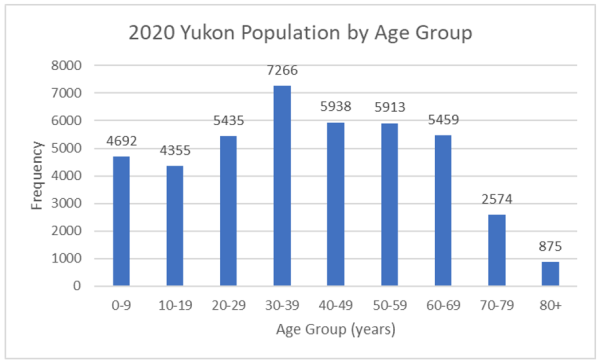
- Use the 2020 Yukon population by age group table below to:
Age Group (yrs.) Frequency Relative Frequency 0-9 4692 10-19 4355 20-29 5435 30-39 7266 40-49 5938 50-59 5913 60-69 5459 70-79 2574 80+ 875 - Create a bar chart.
- Complete the table.
- Which age category has the highest frequency and what proportion of the total population is that category?
- Use 2 sentences to describe features of the bar chart
- Forty randomly selected people in Yellowknife, NWT were asked the number of nights they saw northern lights last year. The results are as follows:
Number of Nights Northern Lights Viewed Frequency Relative Frequency Cumulative Frequency 0 0 1 15 2 10 3 2 4 2 5 2 - Complete the columns of the chart.
- Use a bar chart to graph the frequencies.
- What is the probability someone chosen randomly viewed at least one night of northern lights?
- In a survey collecting data about the salaries earned by recent Yukon University graduates, Christy found that her salary was in the 85th percentile. Should Christy be pleased by this result? Explain.
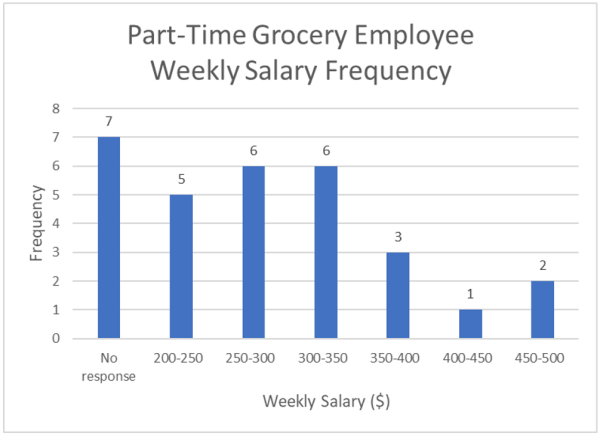
- Thirty part-time grocery clerks who work at grocery store in northern Canada were asked, “What is your average weekly salary?” The results are in the table below.
Weekly Salary ($) Frequency No response 7 200-250 5 350-300 6 300-350 6 350-400 3 400-450 1 450-500 2 - What percentage of the survey did not give an answer?
- What percentage says their weekly salary is from $200.00 to $350.00?
- Construct a bar graph of the data.
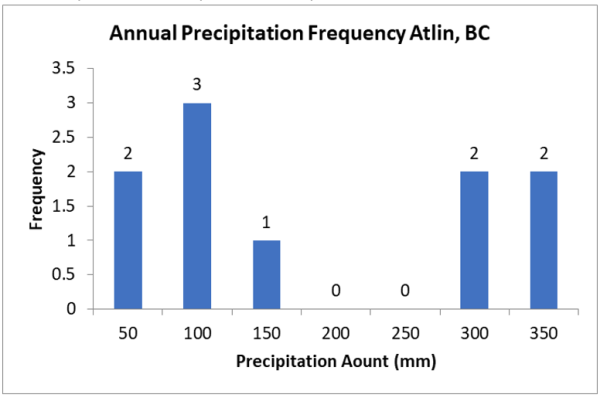
- The annual precipitation in Atlin, BC between 2005 and 2014 is as follows:
Annual Precipitation in Altlin, BC [2] Year Annual Atlin Precip. (mm) 2005 307.3 2006 24.1 2007 50.0 2008 143.8 2009 66.4 2010 54.2 2011 85.9 2012 259.7 2013 330.8 2014 279.4 - Organize the data into a line graph.
- Construct a histogram of the data.
- Calculate the sample mean.
- Find the interquartile range.
Solutions
-
-
Monthly Ticket Sales at Yukon Beringia Interpretive Centre Month Beringia 2018 Ticket Sales Relative Frequency Cumulative Frequency January 673 2.82% 2.82% February 814 3.41% 6.22% March 1670 6.99% 13.21% April 1303 5.45% 18.66% May 1347 5.64% 24.30% June 3519 14.73% 39.02% July 4745 19.86% 58.88% August 4065 17.01% 75.89% September 1808 7.57% 83.45% October 1170 4.90% 88.35% November 1475 6.17% 94.52% December 1309 5.48% 100% - In July and August of 2018, (19.86%+17.01% =) 36.87% of 2018’s tickets were sold.
- In 2018, 75.89% of 2018’s tickets were sold in the first 8 months of the year.
-
-
- Bar chart of 2020 Yukon population by age group
-
Age Group (yrs.) Frequency Relative Frequency 0-9 4692 11.04% 10-19 4355 10.25% 20-29 5435 12.79% 30-39 7266 17.09% 40-49 5938 13.97% 50-59 5913 13.91% 60-69 5459 12.84% 70-79 2574 6.06% 80+ 875 2.06% - The age category with the highest frequency is Yukoners between 30-39 years of age occupying 17.09% of the total Yukon population.
- There is a lower probability of choosing a random Yukoner between 10 and 19 years of age than any other age group. There are almost as many Yukoners between the ages of 0 and 39 as there are Yukoners older than 40 yrs. old.
- Bar chart of 2020 Yukon population by age group
-
-
Number of Nights Northern Lights Viewed Frequency Relative Frequency Cumulative Frequency 0 0 22.50% 22.50% 1 15 37.50% 60.00% 2 10 25.00% 85.00% 3 2 5.00% 90.00% 4 2 5.00% 95.00% 5 2 5.00% 100.00% - Bar chart of the frequency of viewing northern lights.
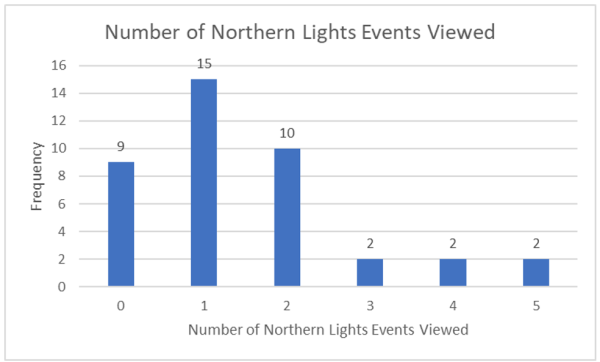
- The probability a randomly chosen person in Yellowknife viewed northern lights last year is 77.5%.
-
- Christy should be pleased considering this means her salary is higher than 85% of people surveyed, or rather it is in the top 15% of people surveyed.
-
- The percentage of people who did not provide a response 7/30 = 0.2333 = 23.33%. 23.37% of grocery clerk refused to give answers.
- 16.67% + 20% + 20% = 56.67%. 56.67% of the grocery clerks says their weekly salary is from $200.00 to $350.00.
- Bar graph of part-time grocery employee weekly salary frequency.
-
- Line graph of annual precipitation in Atlin, BC.
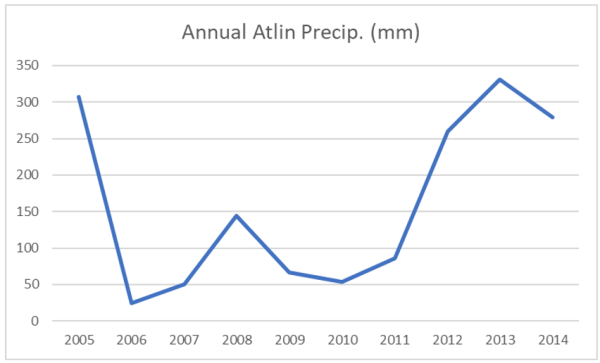
- [latex]\text{Width of bins}= \dfrac{(\text{max }−\text{ min})}{\text{No. of bins}}= \dfrac{(330.80−24.10)}{6} = 51.12[/latex], use 50 mm for the width.
- Sample mean = 160.15 mm
- Interquartile Range = Q3 − Q1 = 286.375mm − 53.075 mm = 233.3 mm
- Line graph of annual precipitation in Atlin, BC.
- Data source: Government of Yukon. (2018). Tourism Yukon 2018 Year-End Report. https://yukon.ca/sites/yukon.ca/files/tc/tc-tourism-yukon-2018-year-end-report.pdf ↵
- Data source: Weather Dashboard for Atlin. (n.d.). Total precipitation - Annual data for Atlin. https://atlin.weatherstats.ca/charts/precipitation-yearly.html ↵
