The Normal Distribution – Excel Tools Instruction
Normal Distribution
- The normal distribution, which is continuous, is the most important of all the probability distributions. Its graph is bellshaped. This bell-shaped curve is used in almost all disciplines. Since it is a continuous distribution, the total area under the curve is one. The parameters of the normal are the mean µ and the standard deviation σ. A special normal distribution, called the standard normal distribution is the distribution of z-scores. Its mean is zero, and its standard deviation is one.
Normal Distribution in Excel
The final exam scores in a statistics class were normally distributed with a mean of 63 and a standard deviation of five.
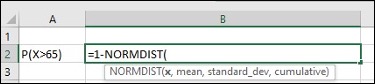
- Find the probability that a randomly selected student scored more than 65 on the exam.
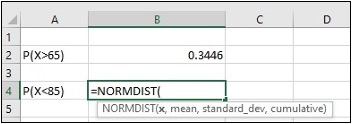
- Find the probability that a randomly selected student scored less than 85.
- Find out what is x, mean, standard deviation for question a and b.
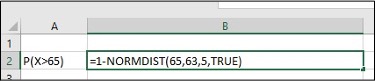
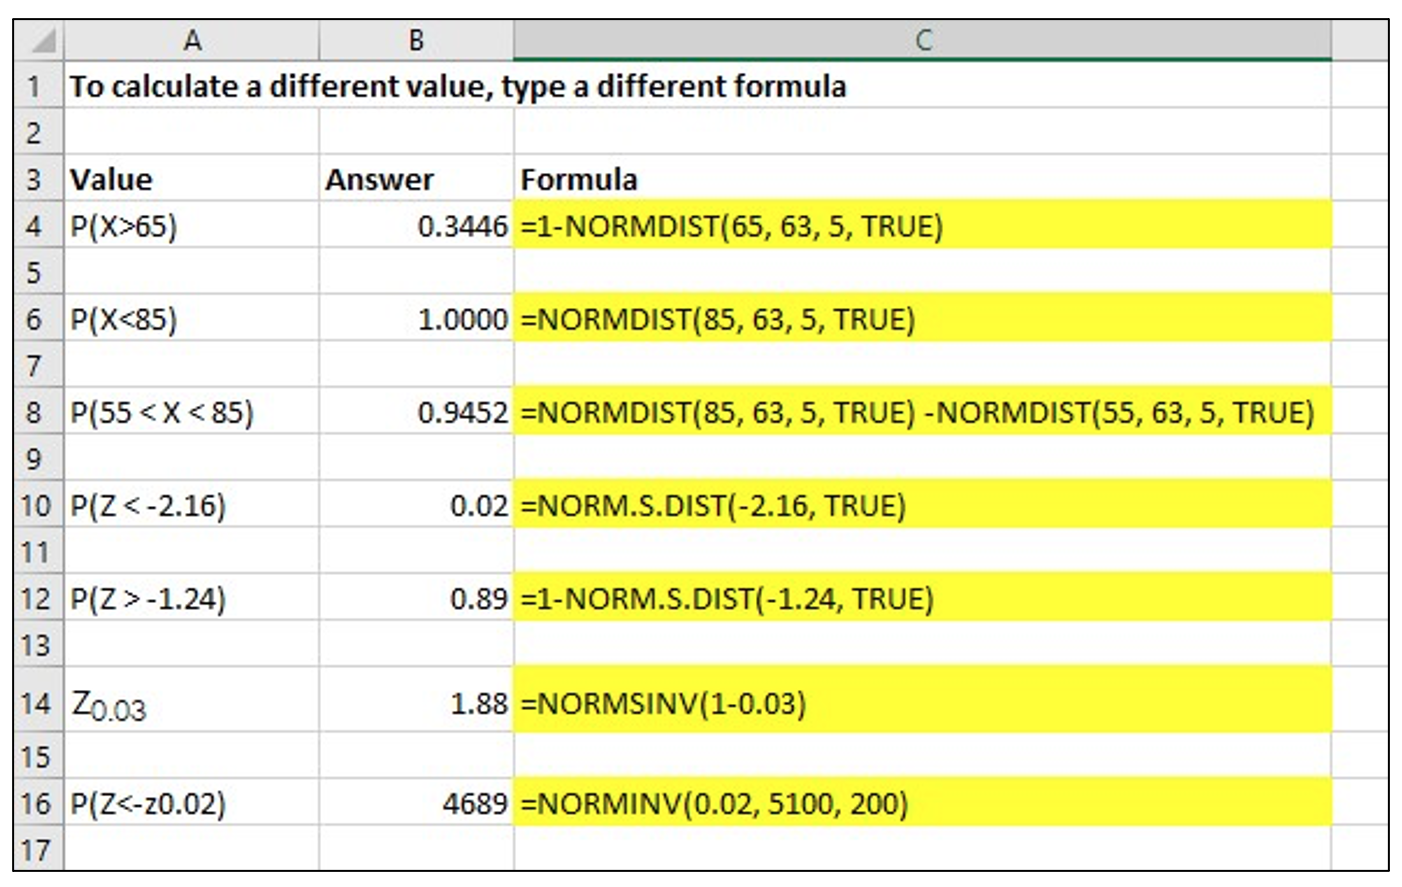
- For question a, to compute cumulative normal probabilities P(X>65)
- Enter P(X>65) in cell A2, enter=1-NORMDIST(65,63,5,TRUE) in cell B2, click Enter
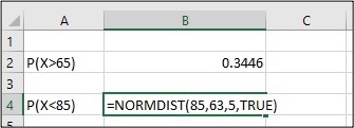
- For question b, to compute cumulative normal probabilities P(X<85)
- Enter P(X<85) in cell A4, enter=NORMDIST(85,63,5,TRUE) in cell B4, click Enter
For a reference to calculate a different value with typing a different formula
Media Attributions
- Screenshots of Excel are used with permission from Microsoft.
