Analyzing and Optimizing Your Digital Marketing Performance
18 Conversion Rate Optimization
Learning Objectives
By the end of this chapter, you should be able to:
- Explain the relationship between conversion rate optimization (CRO) and customer journeys
- Describe the key areas affecting CRO

A/B Testing is a subset of conversion rate optimization. Conversion rate optimization (CRO) is the practice of increasing the percentage of users who perform a desired action. Desired actions can include:
- Purchasing a product or service,
- Clicking ‘add to cart’,
- Signing up for a service or newsletter,
- Filling out a form, or
- Simply clicking on a link.
While A/B testing looks to optimize specific marketing campaigns or activities, conversion rate optimization looks at the entire customer journey and tries to identify areas along the customer journey where optimization can happen.
Sample Scenario

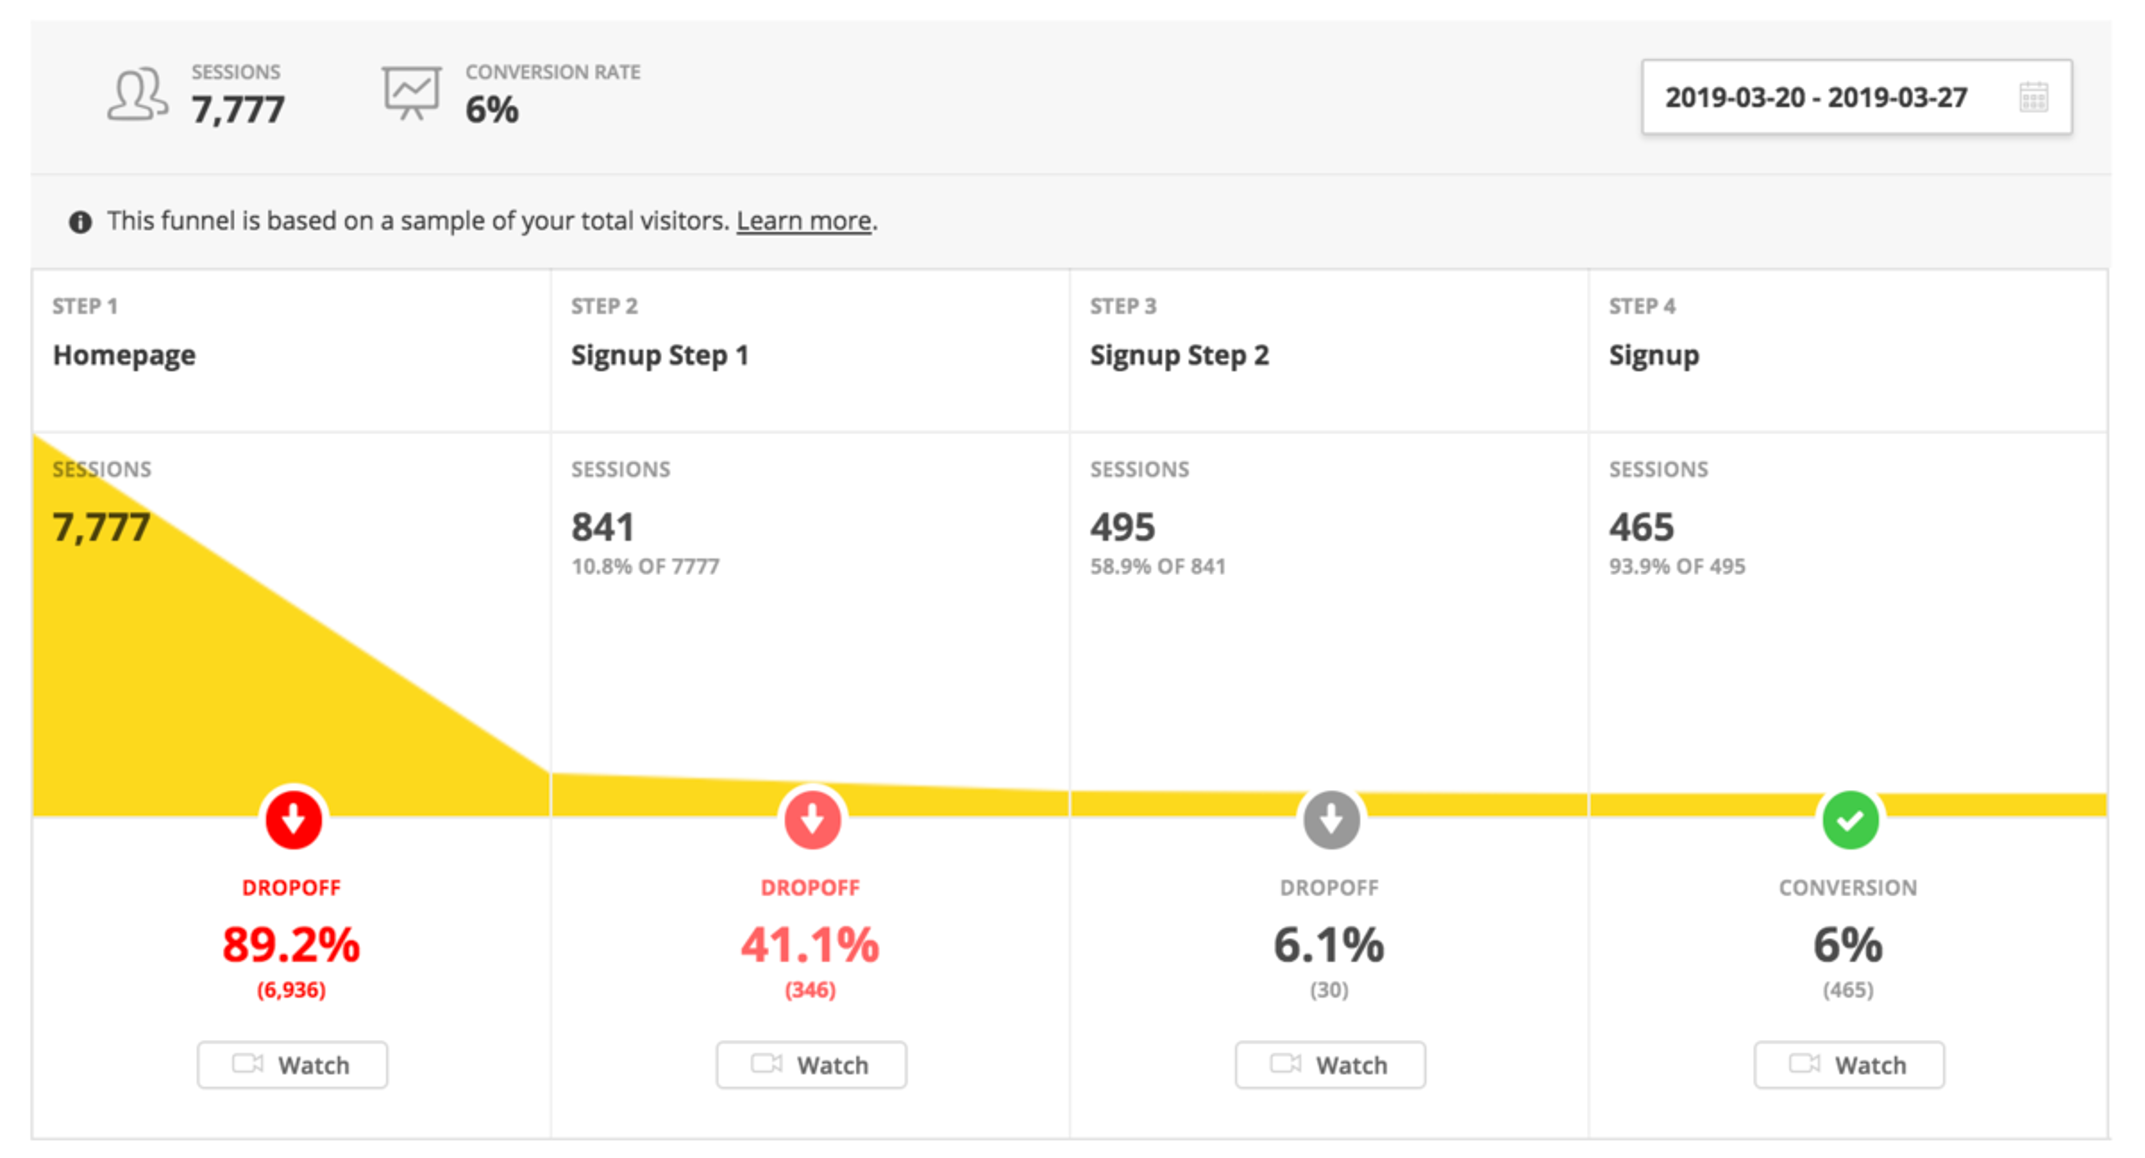
In the customer journey image above, there are two significant drop-offs in Steps 1 and 2. In Step 1, there is a 89.2% drop-off, which means almost 90% of all session are ending after visiting the homepage. From those that remain, 41% drop off in Step 2. This is concerning since there are only 495 sessions left by Step 3, which represents only 6.4% (495/7,777) of all sessions that arrived on the homepage.
As a marketer focused on conversion rate optimization, this would immediately highlight the need to reduce the drop-off rates in Steps 1 and 2 and look at what marketing could do to increase retention from Step 1 through to Step 3.
This might involve reviewing the calls-to-action on the homepage (Step 1) and in the Signup Step 1 (Step 2) or possibly tweaking the marketing activities and campaigns to better qualify those who arrive on the homepage. These tweaks may also require some additional A/B testing. However, the goal of conversion rate optimization is to maximize the number of potential leads that convert.
Generally speaking, there are four key areas that marketers will analyze when engaging in CRO:
- Target Audience
Sometimes the reason for a lack of conversion is that the target audience is not the appropriate one. For example, if you drive lots of traffic to your website via a marketing campaign, but the visitors who end up on your website are not the type of customers interested in your solutions, your conversions may be low. - Content
Alternatively, or maybe additionally, if the content you present does not meet the needs of your target audience, you may see drop-offs, as well. In this case, you may want to conduct some A/B tests to compare different content options. - Landing Pages
As discussed in the Landing Pages chapter, ensure that your landing pages include:- Unique selling propositions
What is unique about your offer?
- Specific customer benefits
Be sure to include the actual benefits to your target audience not just your product or service features.
- Clear calls-to-action
Do your calls-to-action create urgency?
- Appropriate visuals / imagery
Do your visuals support your calls-to-actions, unique selling proposition, and customer benefits? And, if visitors have landed on this page based on an advertisement, make sure that the visuals and content match those in the ad, i.e., what the visitors expect to see and read when they land on your page.
- Social proof and credibility elements
These elements reassure your visitors of your organizational authority and credibility. This might include testimonials, previous client logos, case studies, etc. - Again, in closely reviewing all the above elements, you may choose to conduct A/B tests to better understand which element changes result in higher conversions. For more on high-converting landing pages, here’s a 6.5-minute video, The Anatomy Of A High Converting Landing Page
- Unique selling propositions
- Budget
And, finally, if you are using paid advertising to drive your traffic, your budgets or bidding strategy may not be appropriate for the goals and objectives you seek. Once again, you can experiment with bidding strategies or increase your budget to see if that impacts your overall conversion funnel and attracts your target audience.
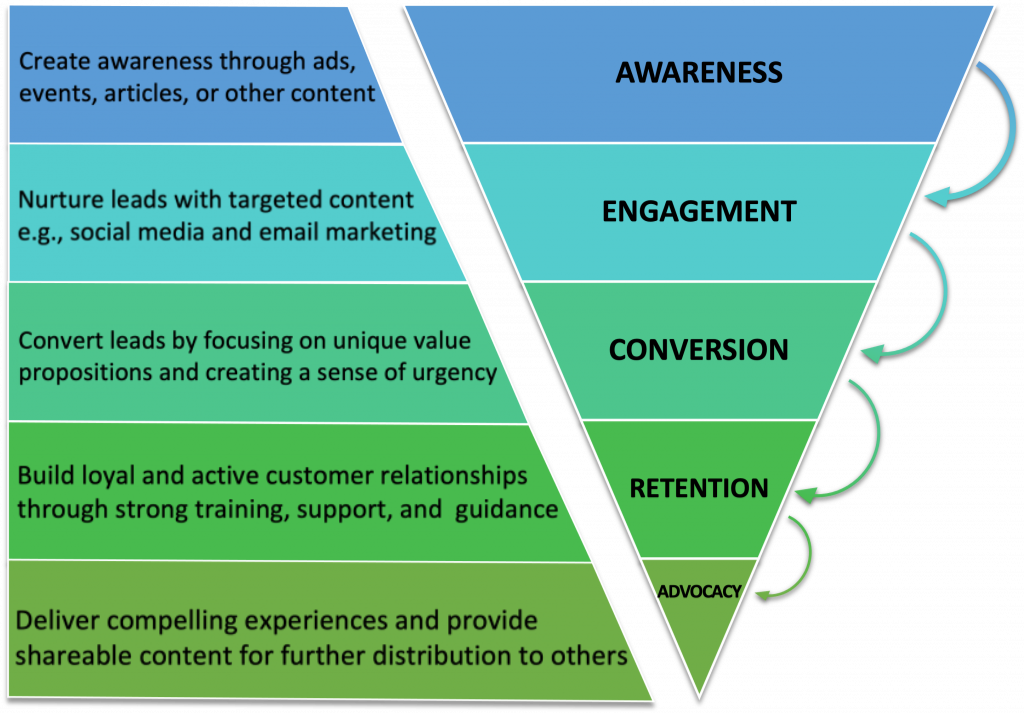
Remember our conversion funnel from the customer journey chapter?

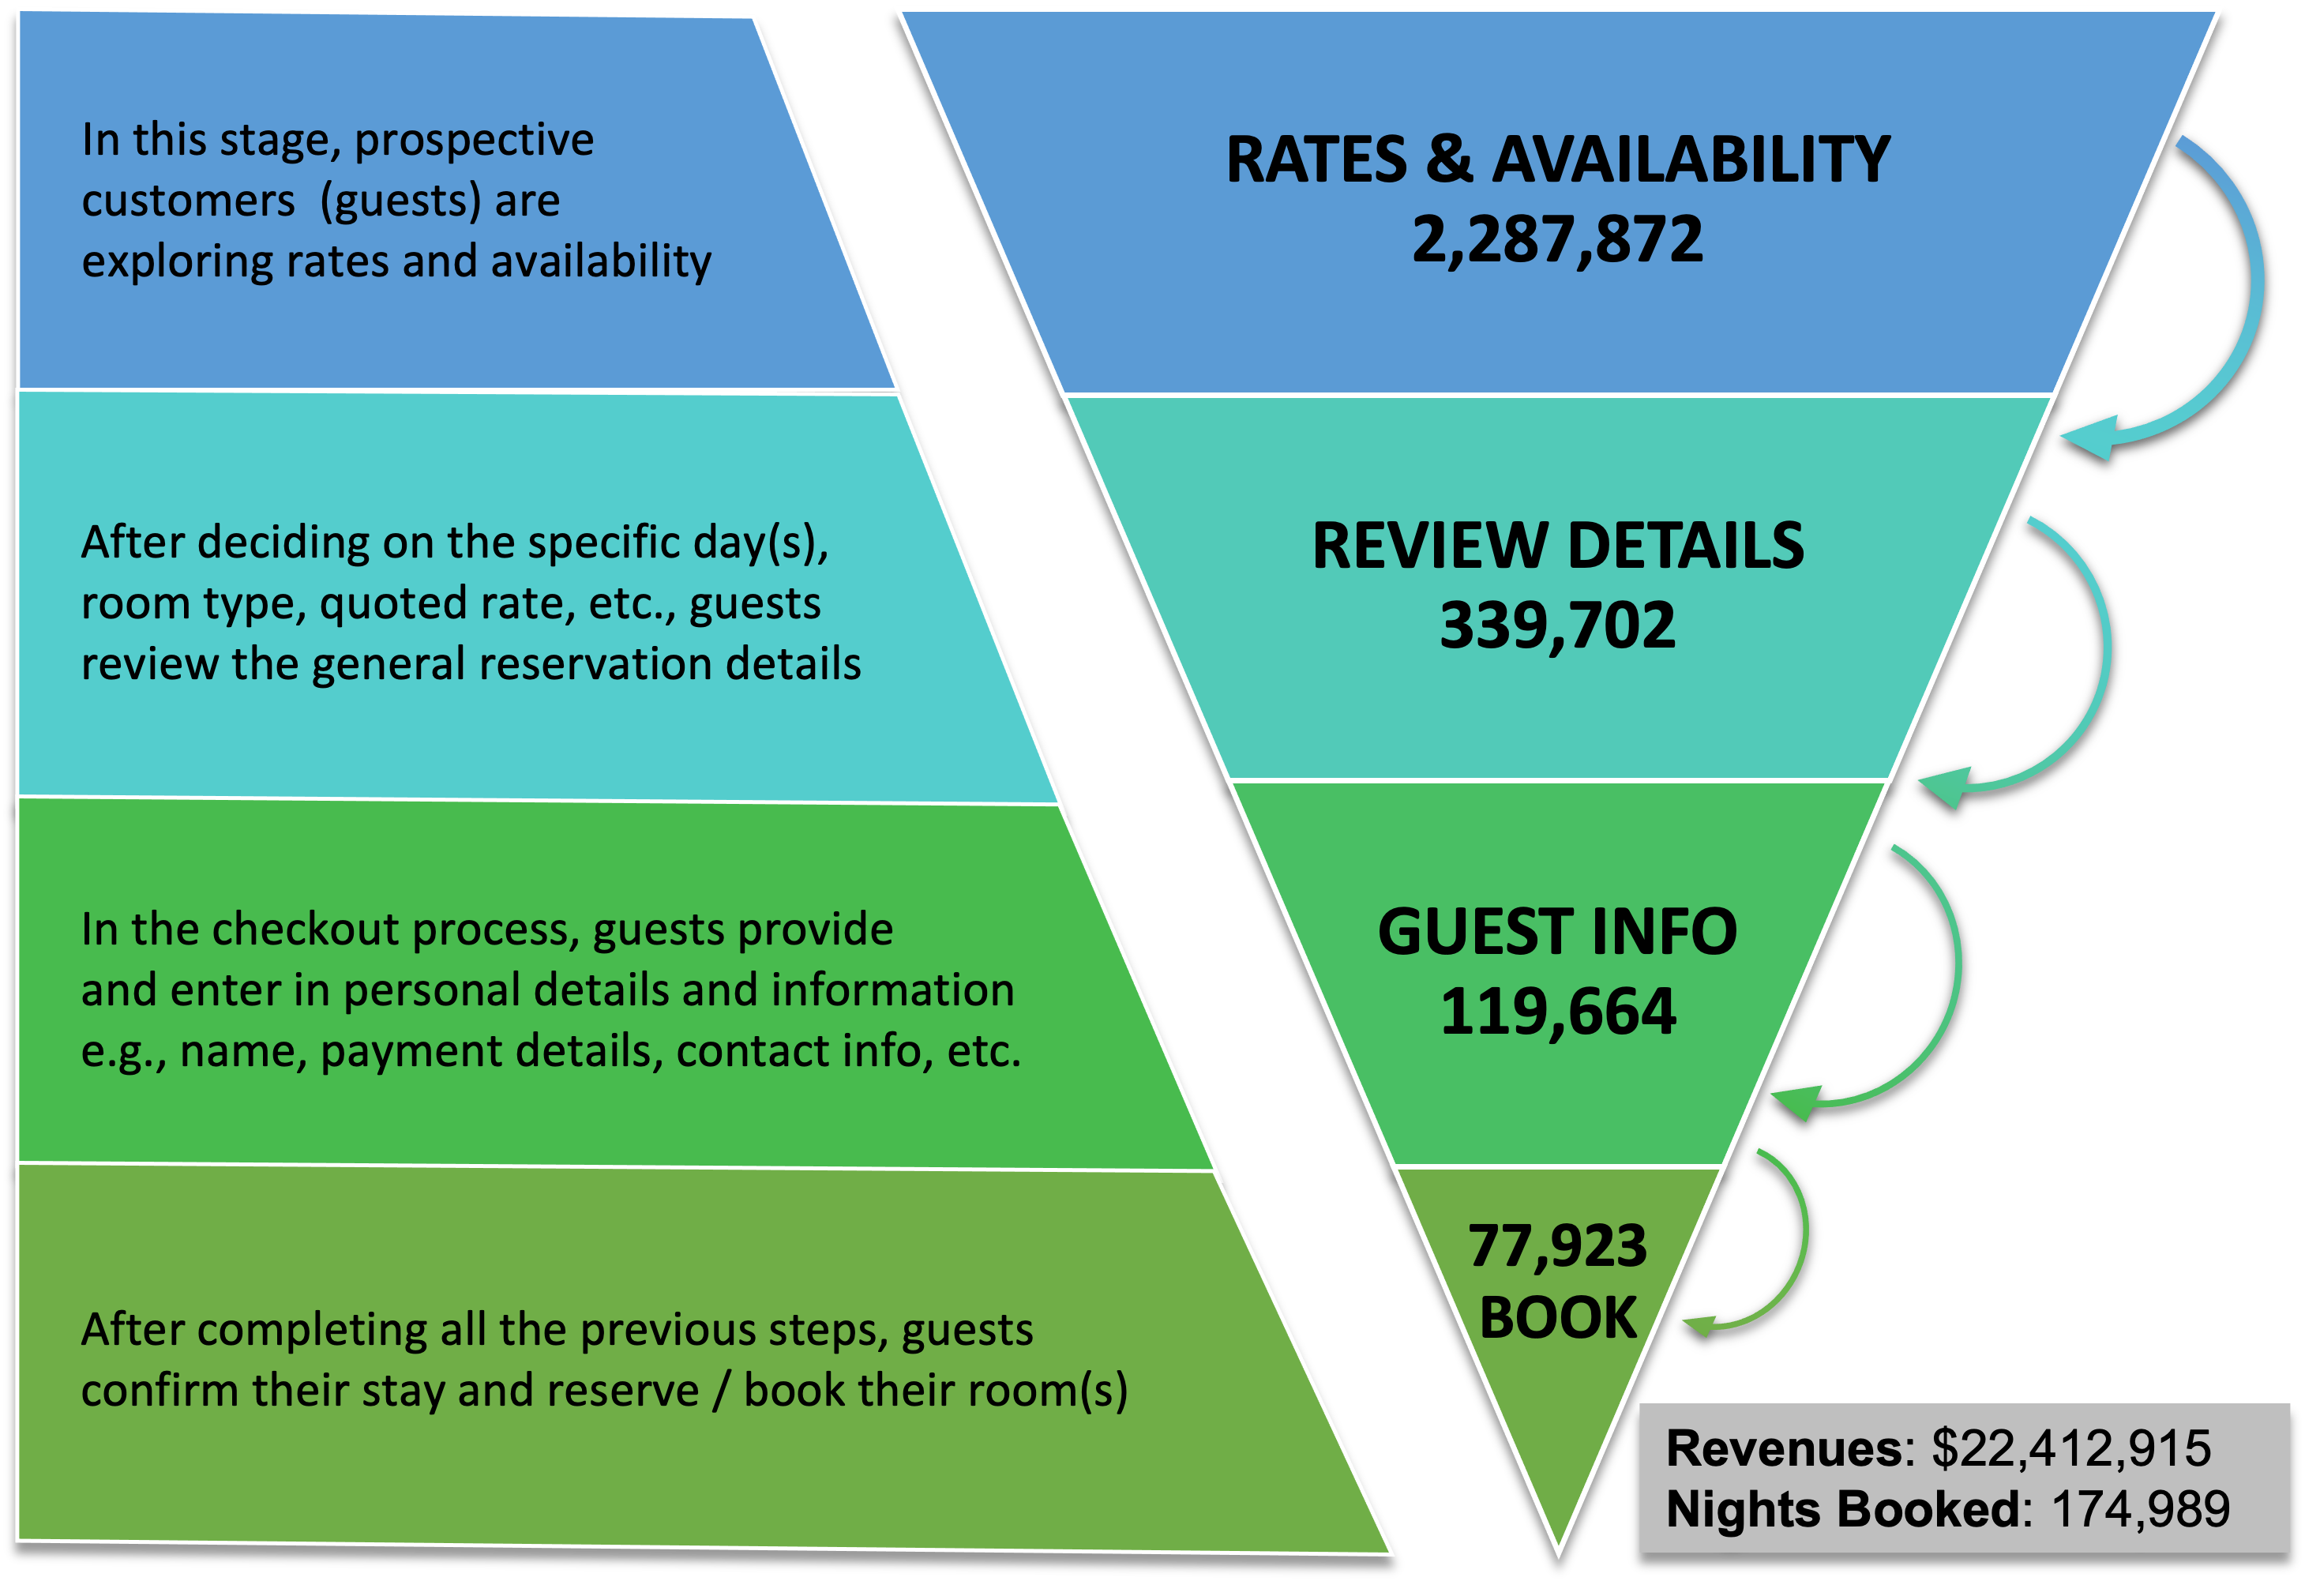
Let’s now review some results from a fictitious hotel and explore how we might optimize those activities:
H5P: Conversion Funnel Calculation & Optimization Exercises

- In each of the above stages, the numbers presented show how many (potential) guests participated in those activities related to that stage. Given the above conversion funnel, what was this hotel’s conversation rate?
- 14.8%
- 65.1%
- 29.4%
- 3.4%
- A micro-conversion rate is the conversion rate between funnel stages. Which of the following options i represents the correct micro-conversion rates for the hotel?
- Review Details: 14.8%
Guest Info: 35.2%
Booked: 65.1% - Review Details: 6.7%
Guest Info: 2.8%
Booked: 1.5% - Review Details: 14.8%
Guest Info: 5.2%
Booked: 3.4% - Review Details: 29.3%
Guest Info: 4.4%
Booked: 1.5%
- Review Details: 14.8%
- If the total number of nights booked (for all reservations) was 174,989 nights, what is the average number of nights per booking / reservation?
- 2.25
- 13.1
- 0.76
- 0.45
- Given that total revenues (for all the reservations) was $22,412,915, what is the average revenue per booking?
- $347.67
- $9.79
- $10.21
- $287.63
- Now, that you understand the basic funnel calculations, let’s look at some optimization scenarios …
The current total revenues are $22,412,915. If traffic increased by 10%, how much total revenue would there be? And, how many more conversions would result?- Revenues: $24,654,206.50 Conversions: 85,715
- Revenues: $2,241,291.50 Conversions: 85,715
- Revenues: $24,654,206.50 Conversions: 7,792
- Revenues: $2,241,291.50 Conversions: 7,792
- And, here’s a slightly more complicated optimization scenario …
If you could increase the percentage of people who arrive at the Review Details step by 20%, what would the conversion rate be?- 4.1%
- 19.1%
- 78.1%
- 3.4%
Conversion rate optimization takes a macro view of your customer journey and where appropriate will drill down and use A/B testing to better understand what needs to be improved and updated. For more details, review this article, Conversion Optimization Made Simple: A Step-by-Step Guide by Neil Patel.
As you can see, there may be many ways to optimize your conversion funnel. As a result, there are also a variety of tools you can use. The tool you require will depend on the area you need to optimize. Here’s a great article that lists 34 CRO tools split up into the following categories:
- Analyzing Your Conversion Funnel
- Testing Your Website / Webpage Loading Speed
- Studying and Mapping User Behaviour
- Surveying Your Customers
- Creating High-Converting Landing Pages
- A/B Testing Your Content
- Starting to Talk To Visitors
- Creating Social Proof
Some of the tools will be the same A/B testing tools in the previous topic. However, others augment and complement those tools and can provide you with additional data and insights around your conversion funnel and optimization opportunities.
Key Takeaways
- Conversion rate optimization looks at the entire customer journey and tries to identify areas along the customer journey where optimization can happen.
- There are four key areas that marketers will analyze when engaging in CRO:
- Target Audiences
- Content
- Landing / Webpages
- (Spending) Budgets
Conversion Rate Optimization – Additional Resources
For more details on conversion rate optimization, please review the following articles:
Media Attribution
- An example of funnel visualization by Hoppertron is licensed under a CC BY-SA 4.0 licence.
- The Anatomy Of A High Converting Landing Page | Conversion Rate Optimization Tips by Neil Patel is licensed under a Standard YouTube License.
- Conversion funnel with descriptions by Rochelle Grayson is licensed under a CC BY 4.0 licence.

