Fundamentals of Digital Marketing
3 Visual Storytelling
Learning Objectives
By the end of this chapter, you should be able to:
- Define visual storytelling
- Explain why visual storytelling is important
![]()
The Importance of Visuals and Why
Now that we’ve discussed how to tell compelling stories, let’s look at visual storytelling and how it has become a critical way stories are told and shared today.
According to Wikipedia,
“Visual storytelling (also visual narrative) is a story told primarily through the use of visual media. The story may be told using still photography, illustration, or video, and can be enhanced with graphics, music, voice and other audio.”
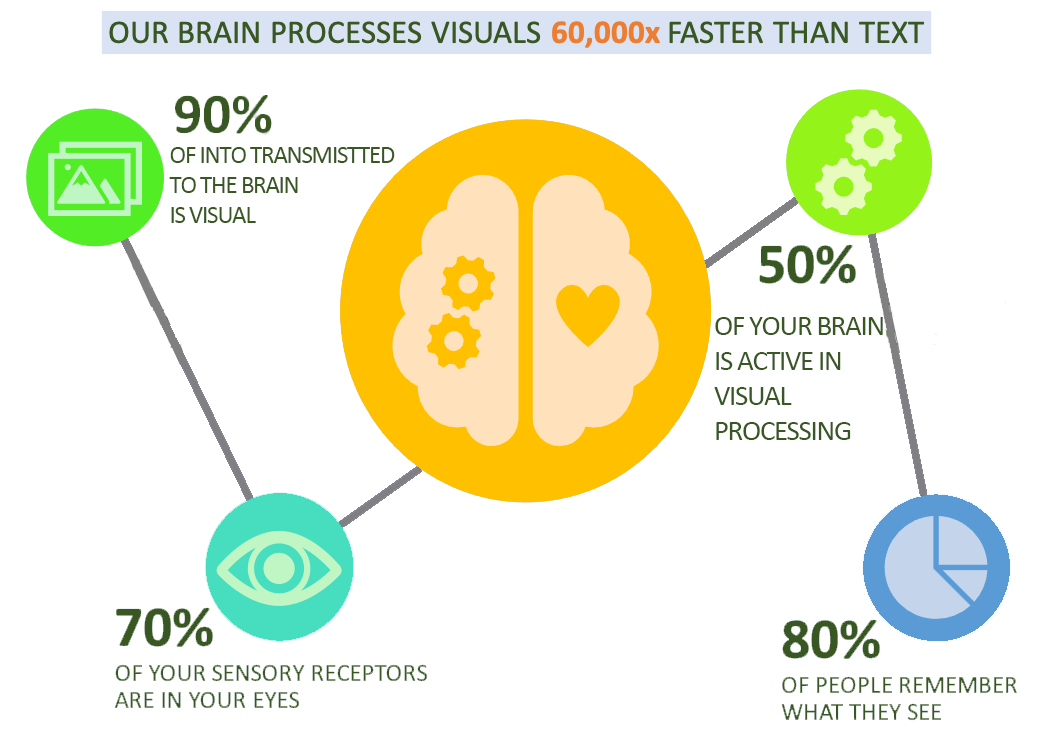
Once of the reasons visual storytelling is so powerful is because our brains are wired “visually”. Here are several mind-boggling statistics that explain why visual storytelling is so critical to the digital world we now live in:
- 90% of information transmitted to the brain is visual[1]
- 50% of your brain is active in visual processing[2]
- 70% of your sensory receptors are in your eyes[3]
- It takes only 13 milliseconds for the human brain to process an image.[4]
- Our brain processes visuals 60,000 times faster than text.[5]
- 80% of people remember what they see, [6] compared to ten percent what they hear and 20 percent of what they read.
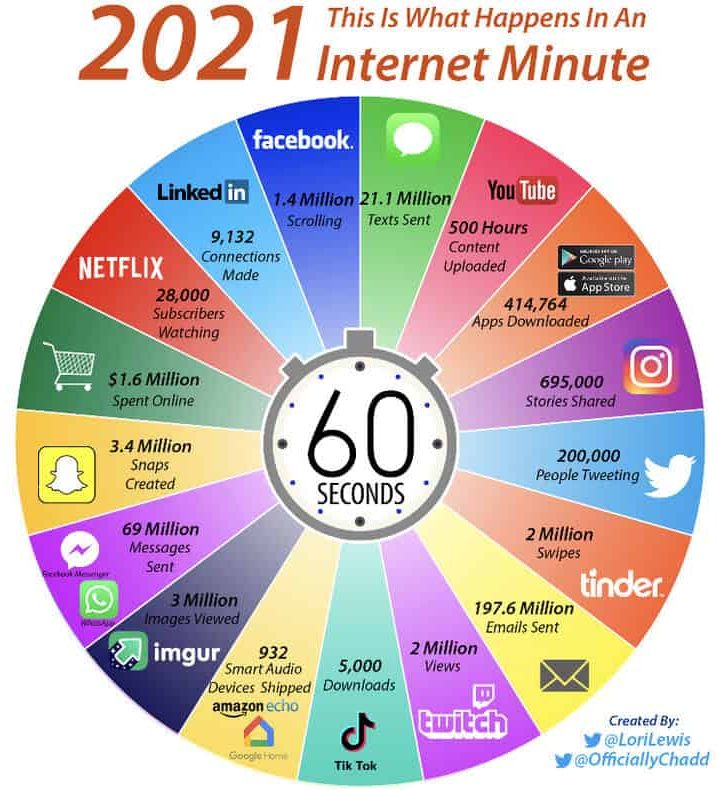
But, what if some of the above information were presented as follows?
 Do you prefer the bullets or the infographic?
In responses to a 2014 survey, 95% of B2B buyers said that they wanted shorter and highly visual content.[7] And, organizations that feature visual content grow traffic 12 times faster than those who don’t.[8]
Also, in comparison, we don’t have much patience for text.
- Most people only read 20-28% of the words on the page.[9]
- 80% of people will watch a video[10] but only 20% of people will read text on a page.
- 55% of website visitors spend less than 15 seconds actively reading.[11]
Unfortunately, we are not great listeners, either. When people hear information, they’re likely to remember only 10% of that information three days later. However, if a relevant image is paired with that same information, people retained 65% of the information[12] three days later.
We also love to consume and share pictures, infographics, and videos:
- More than 100 million photos and videos are posted daily on Instagram.[13]
- Tweets with images receive 150% more retweets[14] than tweets without them.
- On Facebook, photos have an interaction rate of 87%, [15] compared to 4% or less for other types of posts, such as links or text.
- 100 million hours of video are watched every day on Facebook- [16] 85% of them with the sound off.
- 6 billion video ads[17] are watched online each year.
- Posts that include images produce 650% higher engagement[18] than text-only posts.
- People share infographics three times more[19] than any other type of content.
- Using the word “video” in an email subject line[20] boosts open rates by 19% and clickthrough rates by 65%.
And, finally, from an organizational perspective, video drives our purchasing and/or conversion decisions:
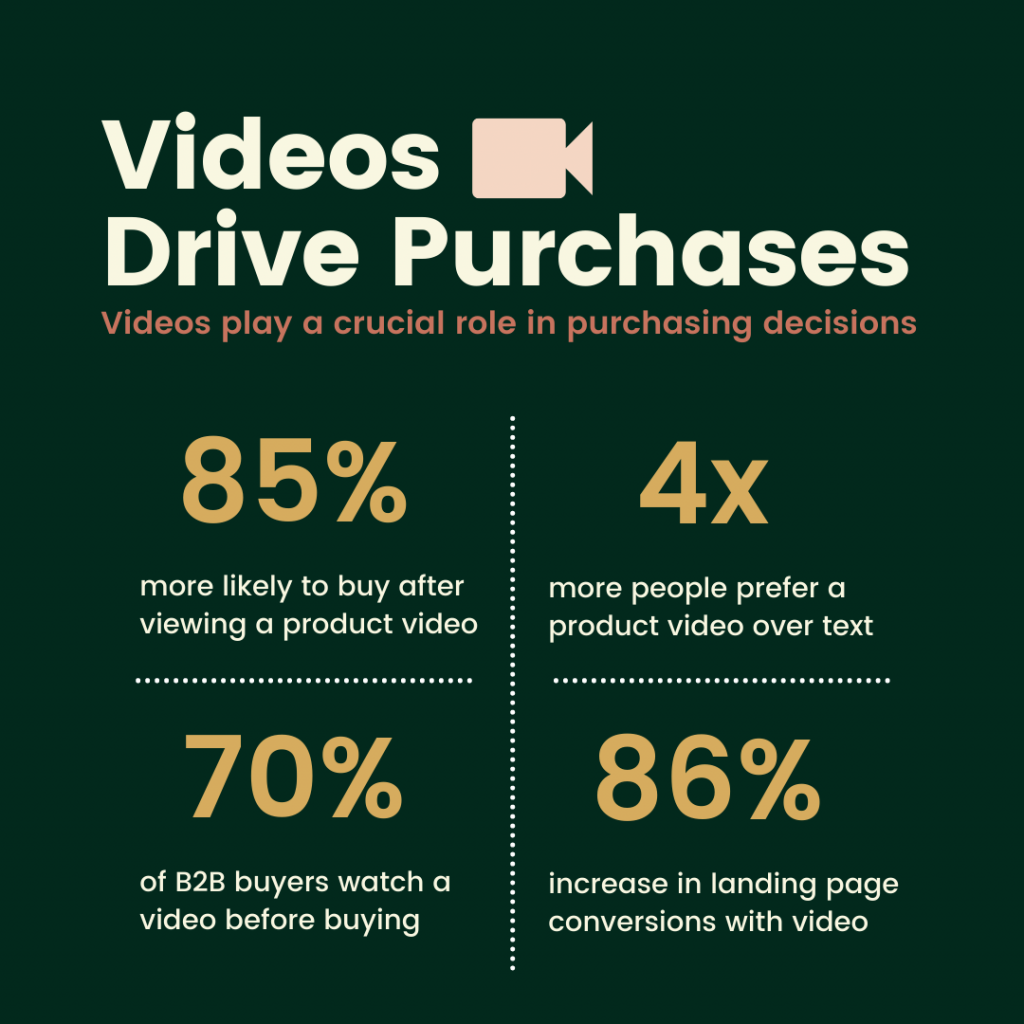
- 70% of B2B buyers and researchers watch a video during their purchase process.[21]
- Four times as many consumers would rather watch a videoabout a product than read about it.[22]
- People are 85 percent more likely to buy a product after viewing a product video.[23]
- Videos on landing pages increase conversions by up to 86%.[24]
Visuals are an important and inherent part of how we process information. And, as marketers with global audiences, relying on universal imagery, instead of specific written languages or words, allows your messages and stories to be much more accessible to a wider audience. So, if you are looking to have the greatest impact, internally or externally, you will need to understand how to present your story and information in a visual way that grabs your audience’s attention and tells a compelling story – which brings us to our next topic: visual language and sketchnoting.
Key Takeaways
Visual storytelling is a compelling way to share your stories and messages. Here are a few key takeaways:
- Our brains are naturally wired to process visual information quicker
- Most people tend to remember visual information better than text or audio information
- We love to consume and share pictures, infographics, and videos
- Videos play an critical role in our purchasing decisions
Exercise
Try your hand at visual storytelling:
- Using some of the statistics presented in this chapter, explore how you might represent them visually.
Media Attributions
- Visually thinking icon by Rochelle Grayson is licensed under a CC BY 4.0 licence.
- The reasons visuals are important by Rochelle Grayson is licensed under a CC BY 4.0 licence.
- What happens in an Internet minute – 2021 © Lori Lewis and Chadd LunaLeKat is for educational, non-commercial use only.
- Videos drives purchases by Rochelle Grayson is licensed under a CC BY 4.0 licence.
- Humans Process Visual Data Better ↵
- How do we transform an ever-changing jumble of visual stimuli into the rich and coherent three-dimensional perception we know as sight? Rochester vision scientists are helping reshape our understanding of how the brain ‘sees.’ ↵
- The Eye and Vision ↵
- What is the Impact of Visual Content Marketing? ↵
- Humans Process Visual Data Better ↵
- 12 Hard Stats That Proof The Power Of Images ↵
- B2B Content Preferences Survey: Buyers Want Short, Visual, Mobile-Optimized Content ↵
- The Rising Power of Visual Content [Infographic] ↵
- The Power of Visual Communication ↵
- Digital Marketing by the Numbers: Stats, Demographics & Fun Facts ↵
- Visual Content Statistics Infographic ↵
- Brain rule rundown ↵
- Instagram by the Numbers: Stats, Demographics & Fun Facts ↵
- Link Tweet with an Image vs. Tweet with Twitter Cards, Does it Matter? ↵
- Six Reasons to Embrace Visual Commerce in 2018 ↵
- 52 Video Marketing Statistics 2022 [Infographic] ↵
- 52 Video Marketing Statistics 2022 [Infographic] ↵
- 16 Visual Content Marketing Statistics That Will Wake You Up ↵
- 15 Visual Content Marketing Statistics That’ll Blow Your Mind ↵
- How to Increase Your Email Open and Click-through Rates ↵
- A Step-by-Step Guide to Develop a Content Marketing Strategy That Converts ↵
- The Rising Power of Visual Content [Infographic] ↵
- 16 Eye-Popping Statistics You Need to Know About Visual Content MarketingVisual content marketing is one big trend you need to embrace. And for good reason. ↵
- 52 Video Marketing Statistics 2022 [Infographic] ↵
