Lab 02: Earth-Sun Relationships and Earth’s Energy Budget
Andrew Perkins
Most of Earth’s energy comes from the sun. This energy is what drives the function of many Earth systems. Understanding how this energy makes its way to the Earth and interacts with the atmosphere and surface is a big part of understanding how the Earth works.
Learning Objectives
After completion of this lab, you will be able to
- Measure how Earth relates to the sun at different times of the year at different latitudes.
- Convert between several common temperature scales.
- Predict how temperature will generally change with latitude.
- Assess how local variables like cloud cover, aspect and surface albedo affect local radiation balance.
Pre-Readings
In order to complete this lab, some background information on Earth-sun relationships, Earth’s energy budget, common temperature scales, albedo, and aspect is required.
Earth-Sun Relationships and Earth’s Energy Budget
Energy Inputs
Earth is dependent on the sun’s energy to support almost all of the systems at work. The actual amount of energy received at the Earth’s surface at any specific location is dependent on three components:
- The solar constant (approximately 1367 watts/m2) is the amount of solar energy received at the top of the atmosphere. This changes slightly with solar output.
- The angle of the suns rays compared to the surface of the Earth. This changes with the seasons.
- Atmospheric composition. The state of the atmosphere – for example, how much water vapour is present above that location – is variable.
We are all aware that the quantity of sunlight varies over time and space. Over a 24-hour period, we know that sunlight is generally strongest around noon and nonexistent during the time of day we call night. Insolation (incoming solar radiation) can be defined as the solar radiation or sunlight that is received by the Earth’s ground surface or atmosphere. Many locations on our planet experience yearly variations in the quantity of insolation. If these variations are large enough, they contribute to the annual march of the seasons.
Reading: Incoming Sunlight [PDF]
This short article explains how Earth’s tilt and surface reflectivity impact how insolation behaves as it encounters the Earth. The same information is available on the NASA Earth Observatory website.
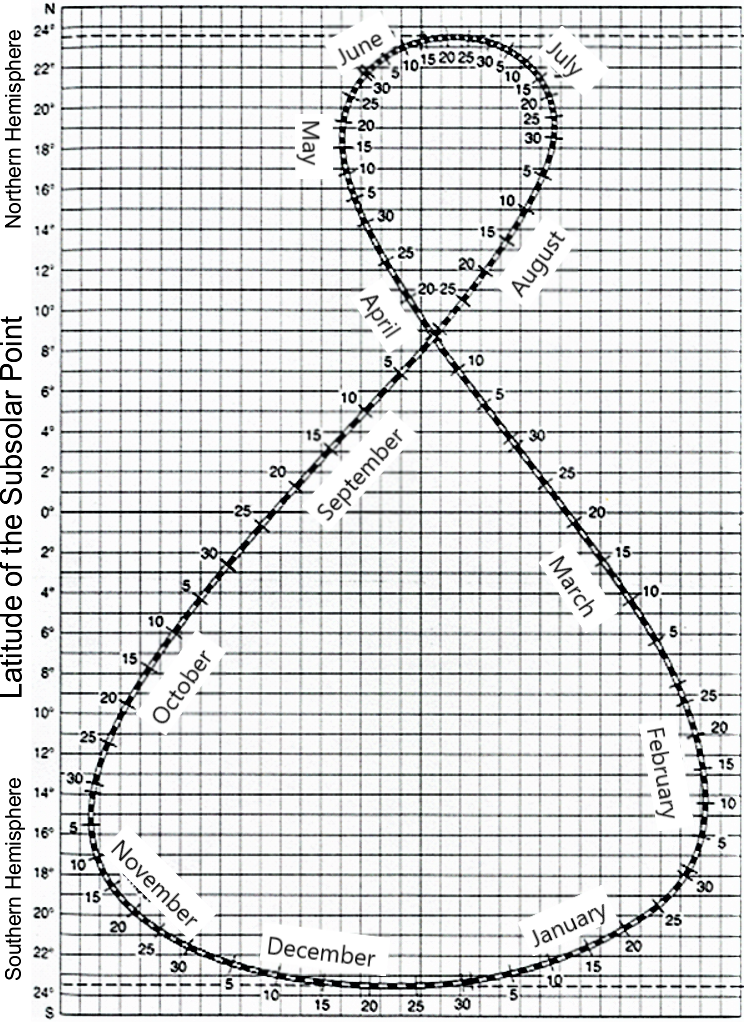
The latitude at which the sun is directly overhead at noon is called the latitude of the subsolar point. The sun is directly overhead of the equator at noon on the equinoxes. It is directly overhead of the Tropic of Cancer at noon on the June solstice, and directly overhead of the Tropic of Capricorn at noon on the December solstice. In between these dates, you can determine the latitude of the subsolar point using a diagram called the analemma (Figure 2.1).
Reading the analemma is a three-step process:
Step 1: On the figure-8 shape, find the date for which you want to know the latitude of the subsolar point.
Step 2: Read across to the vertical axis on the left side of the analemma and read the latitude. Note: latitudes only go up to a maximum 23.5°, the latitude of the Tropic of Cancer and Capricorn, as the sun is never directly overhead at higher latitudes.
Step 3: The analemma is split into the northern hemisphere (upper half, above 0°) and southern hemisphere (lower half, below 0°). Determine whether the latitude of the subsolar point is in the northern hemisphere or the southern hemisphere.
The March of the Seasons and the Angle of the Noon Sun
Across the range of latitudes, locations near the Equator receive high quantities of insolation all year long. Locations near the poles only receive significant amounts of insolation during a relatively short summer period. For this reason, localities near the poles have cold winter conditions during most of the year.
Reading: Heating Imbalances [PDF]
This short article describes how Earth’s tilt and surface reflectivity impact heating imbalances across Earth and drive atmospheric and oceanic circulation on Earth. The same information is available on the NASA Earth Observatory website.
The angle at which solar radiation encounters the Earth’s surface is important for how that energy is distributed. The angle of the noon sun (ANS) is calculated using Equation 2.1:
ANS = 90° − (Latitude ± Latitude of the Subsolar Point)
where
- ANS = the angle of the noon sun (expressed in degrees)
- Latitude = the desired location on the surface of the Earth
- Latitude of the subsolar point (LSP) = the latitude where the sun is directly overhead for that date of the year.
Examples of how to calculate the difference between latitude for your location and the LSP are presented in Figure 2.2 for three scenarios. Important points to take note of:
- You are interested in the total difference in latitude between our location and the LSP.
- You cannot have a sun angle greater than 90°.
- When determining whether you should add or subtract the LSP within Equation 2.1 specifically, consider which hemisphere you are in, and whether it is the “summer half” of the year (location is tilted towards the sun) or the “winter half” of the year (location is tilted away from the sun). If you are in the “summer half” of the year (i.e., approximately March 23 – September 20 in the Northern Hemisphere), then you subtract the LSP in Equation 2.1. If you are in the “winter half” of the year (i.e., approximately March 23 – September 20 in the Southern Hemisphere), then you add the LSP in Equation 2.1.
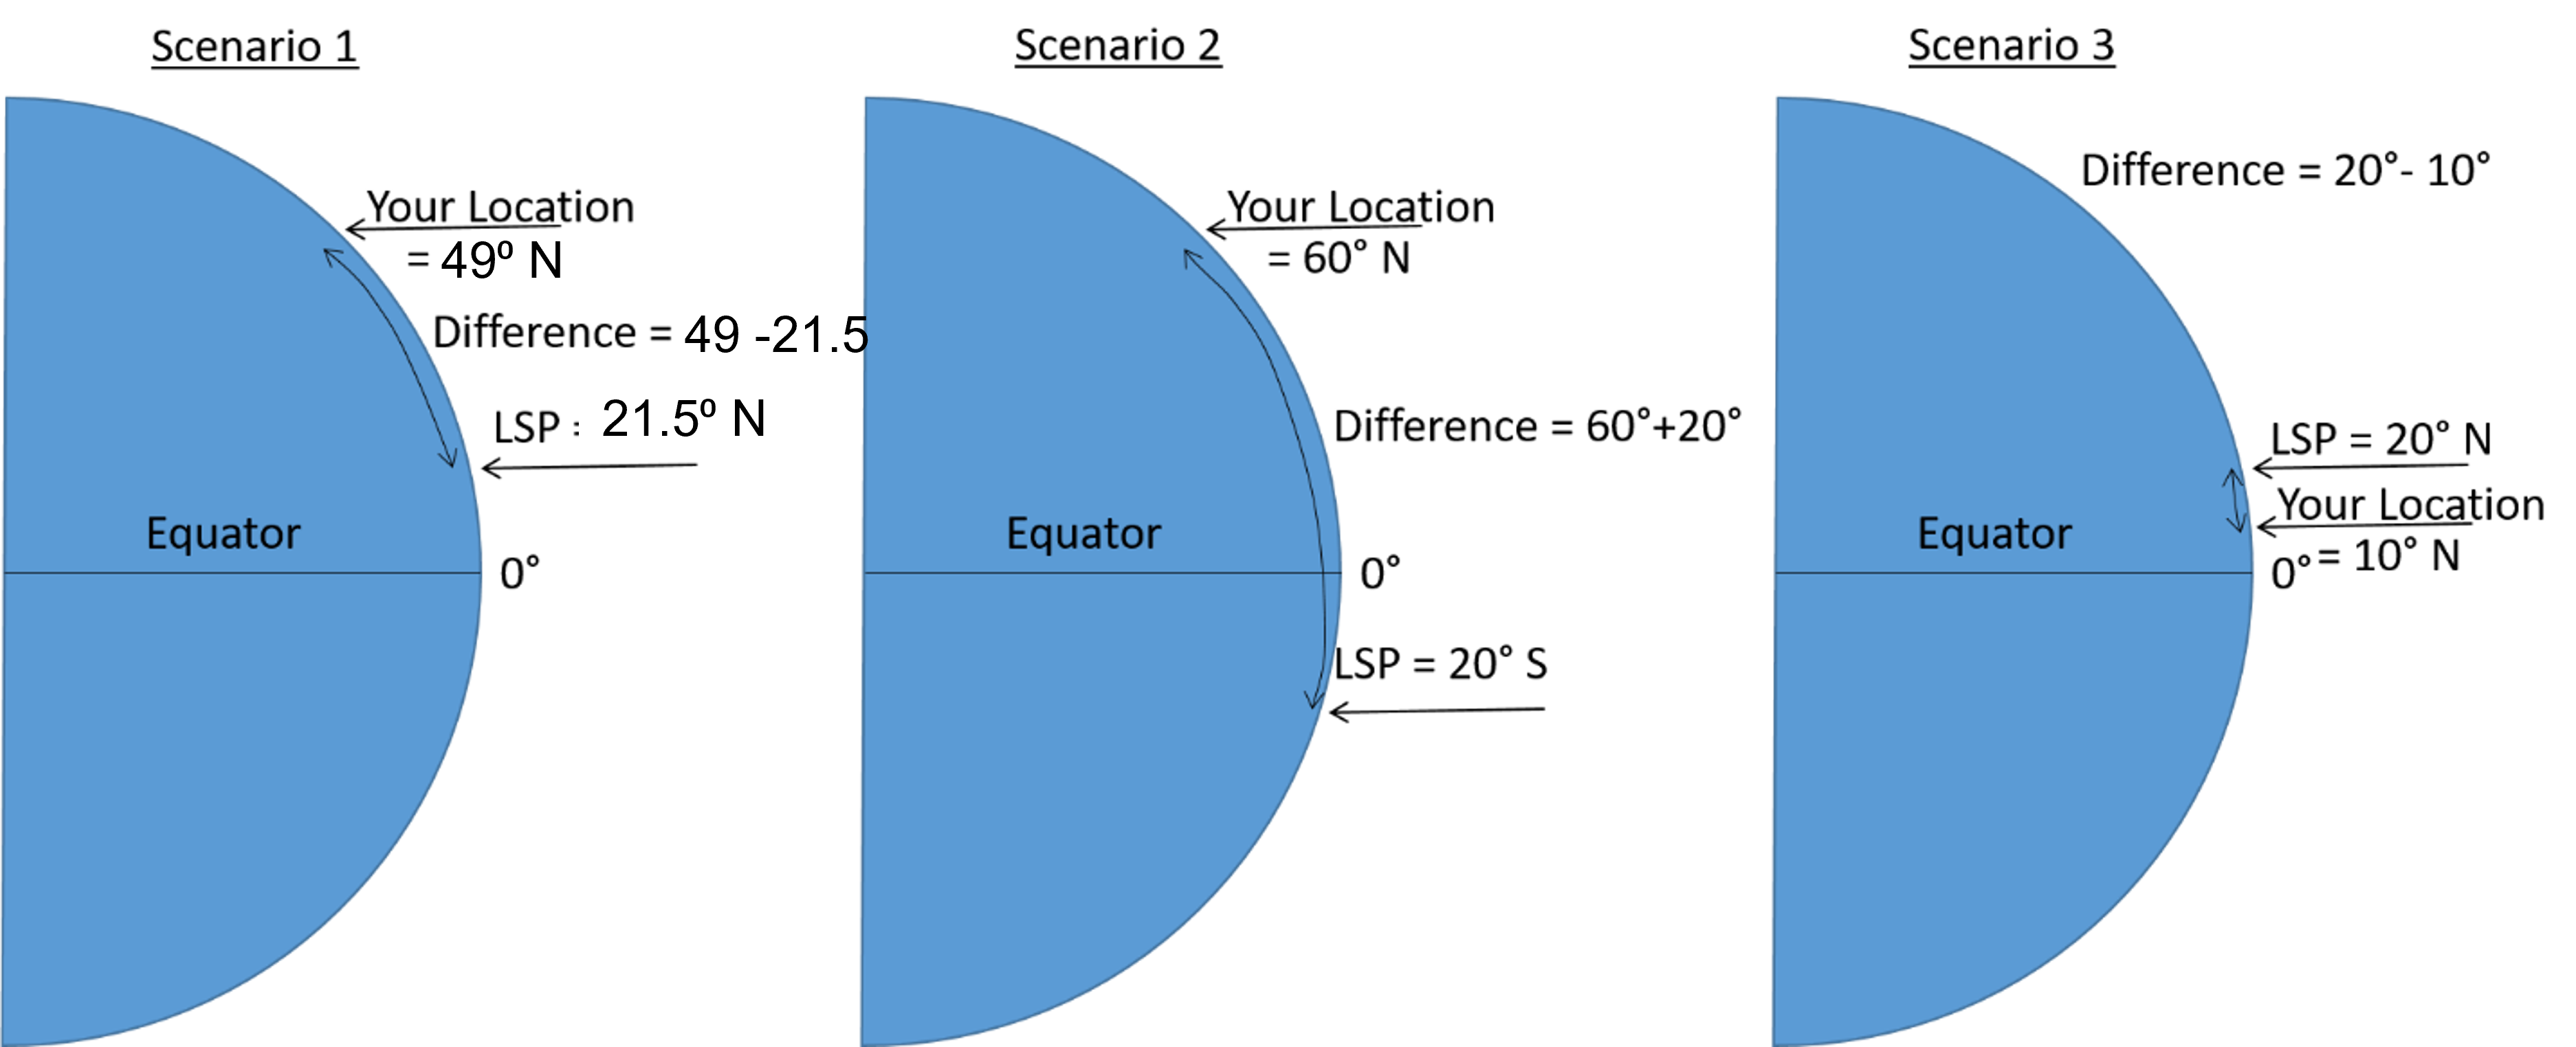
Let us assume that we are located at 49° N on July 14. From the analemma in Figure 2.1 we determine that the LSP is 21.5° N. ANS may therefore be calculated using Equation 2.1 as:
[latex]\begin{array}{ll}\text{ANS}& = 90^{\circ} - (\text{Latitude}-\text{Latitude of the Subsolar Point}) \\ &= 90^{\circ} - (49^{\circ} - 21.5^{\circ}) = 62.5^{\circ}\end{array}[/latex]
When sunlight impacts the Earth’s surface at an oblique angle, the insolation is stretched over a greater area, reducing its intensity (Figure 2.3).
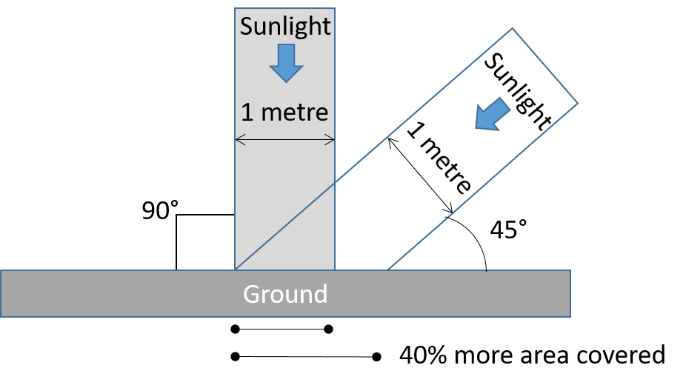
We can extend the ANS calculation to also look at the effect angle of incidence has on insolation intensity using Equation 2.2:
[latex]\text{Intensity} = sin(\text{ANS})[/latex]
This is a unitless value for intensity between 0 and 1, that can be multiplied by 100 to yield a percentage of the 100% intensity currently experienced at the latitude of the subsolar point.
For example, at 49° N on July 14, and using the ANS calculated using Equation 2.1 above, the solar intensity (Equation 2.2) would be:
[latex]\text{Intensity} = sin(62.5^{\circ}) = 0.89\text{ or } 0.89\times 100\% = 89\%[/latex]
Figure 2.4 presents a summary of incoming solar radiation for July 14 at 49° N latitude. A line has been drawn on a protractor to demonstrate the incoming angle of solar radiation (ANS = 62.5°). This corresponds to a relative intensity of 0.89 or 89%.

Earth’s Energy Budget
In order to maintain a stable climate over long periods of time, the energy inputs to Earth (insolation) must be balance by energy outputs, radiated as heat. This balance is also known as Earth’s energy budget. On average,
- 23% of energy is absorbed in the atmosphere by gases, dust, and other particles,
- 48% of energy is absorbed at the surface, and
- 29% of energy is reflected directly back to space by clouds, particles, or bright ground surfaces such as ice (NASA Earth Observatory (1), 2009).
As we can see from these percentages, the surface of Earth and the surrounding atmosphere play different roles in energy absorption and loss. Most energy is absorbed at the surface, while most energy is radiated back to space from the atmosphere.
As noted above, approximately 48% of incoming solar radiation is absorbed at the surface. This energy is returned to the atmosphere through three processes:
- 25% through evaporation, i.e., turning liquid water into water vapour,
- 5% through convection, i.e., air warming in contact with the ground and rising, and
- net 17% as infrared thermal energy (heat) (NASA Earth Observatory (2), 2009).
Global Temperature Distribution and Common Temperature Scales
Based on what you now know about how the sun’s energy is distributed around the globe, it should make sense that incoming solar radiation is unequally received at the Earth’s surface. One of the easiest ways to see this is by examining average temperatures by latitude.
The three maps at the links below show global surface temperatures at the two solstice positions and at the equinox. Surface temperatures are displayed as colour, with red indicating hotter temperatures and blues and purples indicating colder temperatures. You can view the complete temperature scale by clicking on the hamburger menu in the bottom-left corner of the screen. What do you notice about latitudinal changes in temperature as you move from the equator to the poles? You can click anywhere on the map to get a temperature reading for that location.
Temperature is a measure of the average kinetic energy of a substance. It is a way of measuring heat energy, as heat always flows from material at a high temperature to material at a lower temperature, raising the temperature of the cooler material. There are three temperature scales that are commonly used: Celsius (°C), Fahrenheit (°F), and Kelvin (K). Most of the world (including most of the scientific world) uses the Celsius scale for measurement and reporting.
The following formulas allow you to convert between these scales.
Equation 2.3. Convert from Fahrenheit to Celsius:
[latex]\text{T}{(^{\circ} C)} = \dfrac {5}{9} \times \left( T{(^{\circ} F)} - 32 \right)[/latex]
Equation 2.4. Convert from Celsius to Fahrenheit:
[latex]T{(^{\circ} F)} = \left( \dfrac {9}{5} \times T{(^{\circ} C)} \right) + 32[/latex]
[latex]T{(^{\circ} C)} = T(K) - 273[/latex]
Equation 2.6. Convert from Celsius to Kelvin:
[latex]T(K) = T{(^{\circ} C)} + 273[/latex]
where
- T (°C) = Temperature in degrees Celsius
- T (°F) = Temperature in degrees Fahrenheit
- T (K) = Temperature in Kelvin
Temperature Gradients
A gradient is the rate of change for a value over a given distance. It can be useful for many environmental variables like imaging how topography changes over space or how temperature varies vertically or horizontally through the atmosphere.
Temperature changes along a gradient through the atmosphere are called lapse rates. Lapse rates can be calculated using Equation 2.7:
[latex]\text{Lapse rate} (^{\circ} C/km) = -1 \left( \dfrac{\Delta T}{\Delta z} \right) = -1 \left( \dfrac{T_{2} - T_{1}}{z_{2} - z_{1}} \right)[/latex]
where
- Δ = delta symbol, represents the change in the variable it precedes (for example, the change in temperature)
- T = air temperature (normally in °C)
- z = altitude (normally in km). This term can be replaced with distance if calculating a horizontal temperature gradient
- T1 , z1 = the measurement taken at the lower point in the atmosphere
For example, let’s say you wanted to know the lapse rate between the two temperature readings in the atmosphere shown on Figure 2.5.
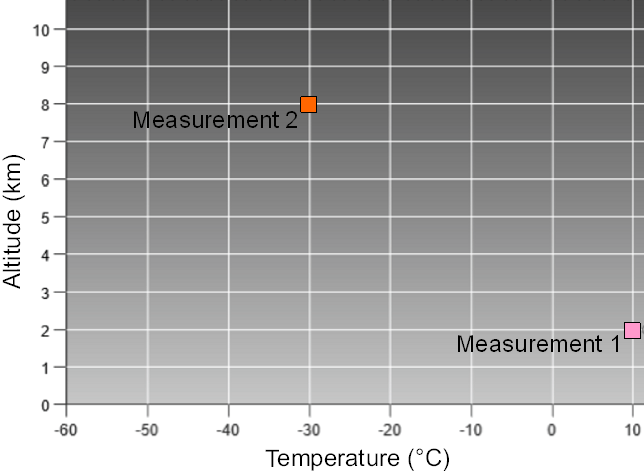
We can read the required values from Figure 2.5: T1 is 10°C at z1 of 2 km, and T2 is −30° at z2 of 8 km. Hence, the lapse rate is calculated using Equation 2.7 as:
[latex]\begin{array}{ll}\text{Lapse rate} (^{\circ} C/km)& = -1 \left( \dfrac{\Delta T}{\Delta z} \right) = -1 \left( \dfrac{T_{2} - T_{1}}{z_{2} - z_{1}} \right)\\&= -1 \left( \dfrac{-30^{\circ} C - 10^{\circ} C}{8km - 2km} \right) = -1 \left( \dfrac{-40^{\circ} C}{6km} \right) = 6.6^{\circ} C/km\end{array}[/latex]
Notice that the lapse rate above has a positive value. This means that based on the series in which the measurements were taken, the temperature is decreasing as the altitude increases, which is the normal condition in the troposphere.
Albedo and Aspect
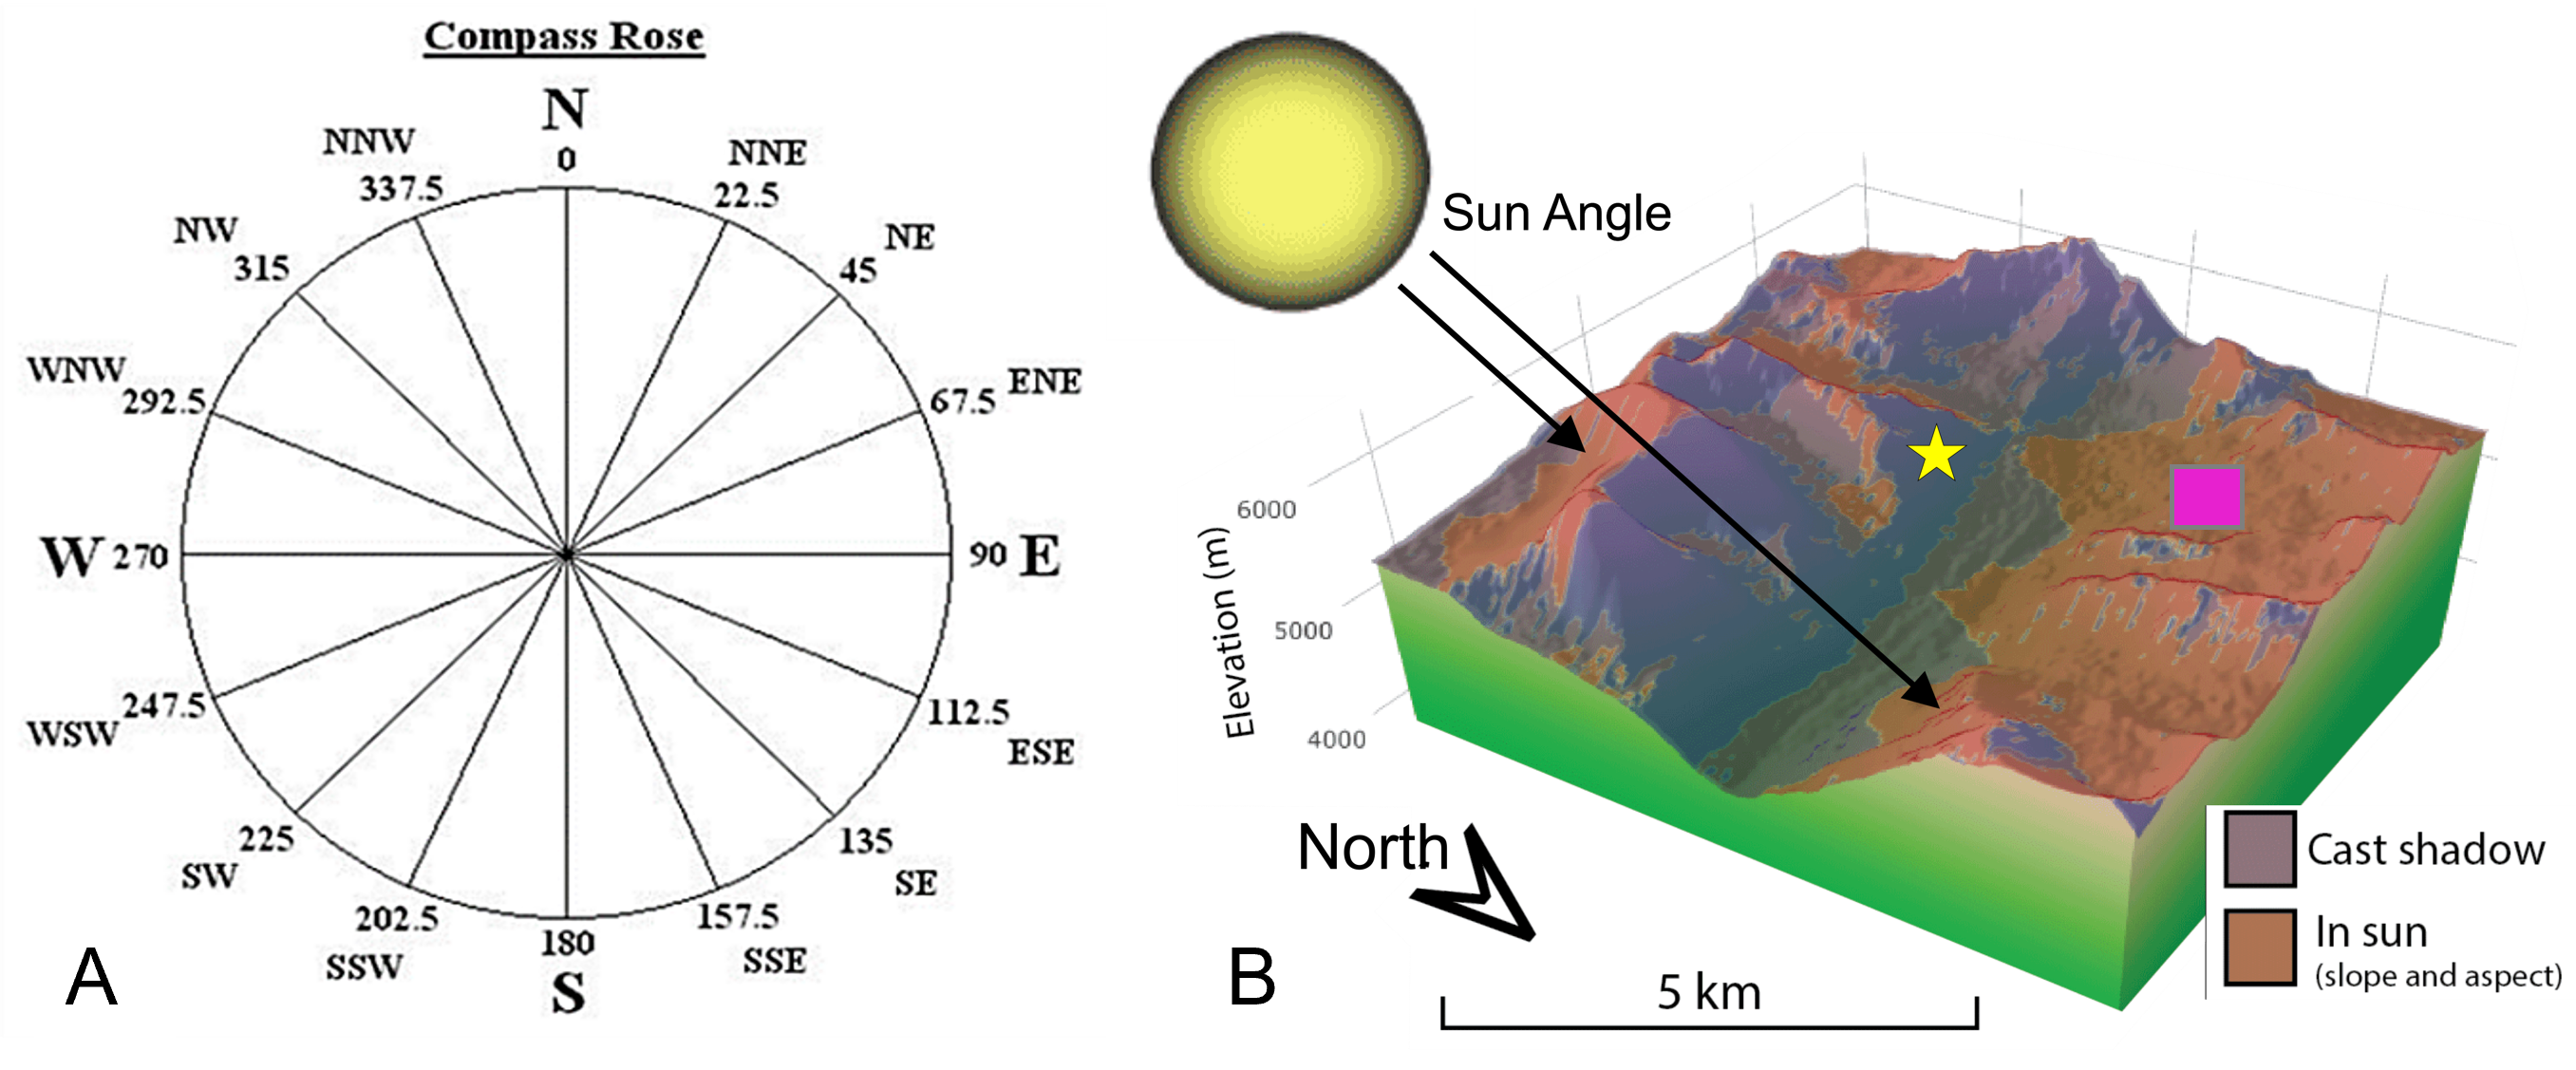
Local variations in surface reflectivity, called albedo, and the direction a surface faces, its aspect, can have a major influence on that surface’s absorption and retention of solar radiation.
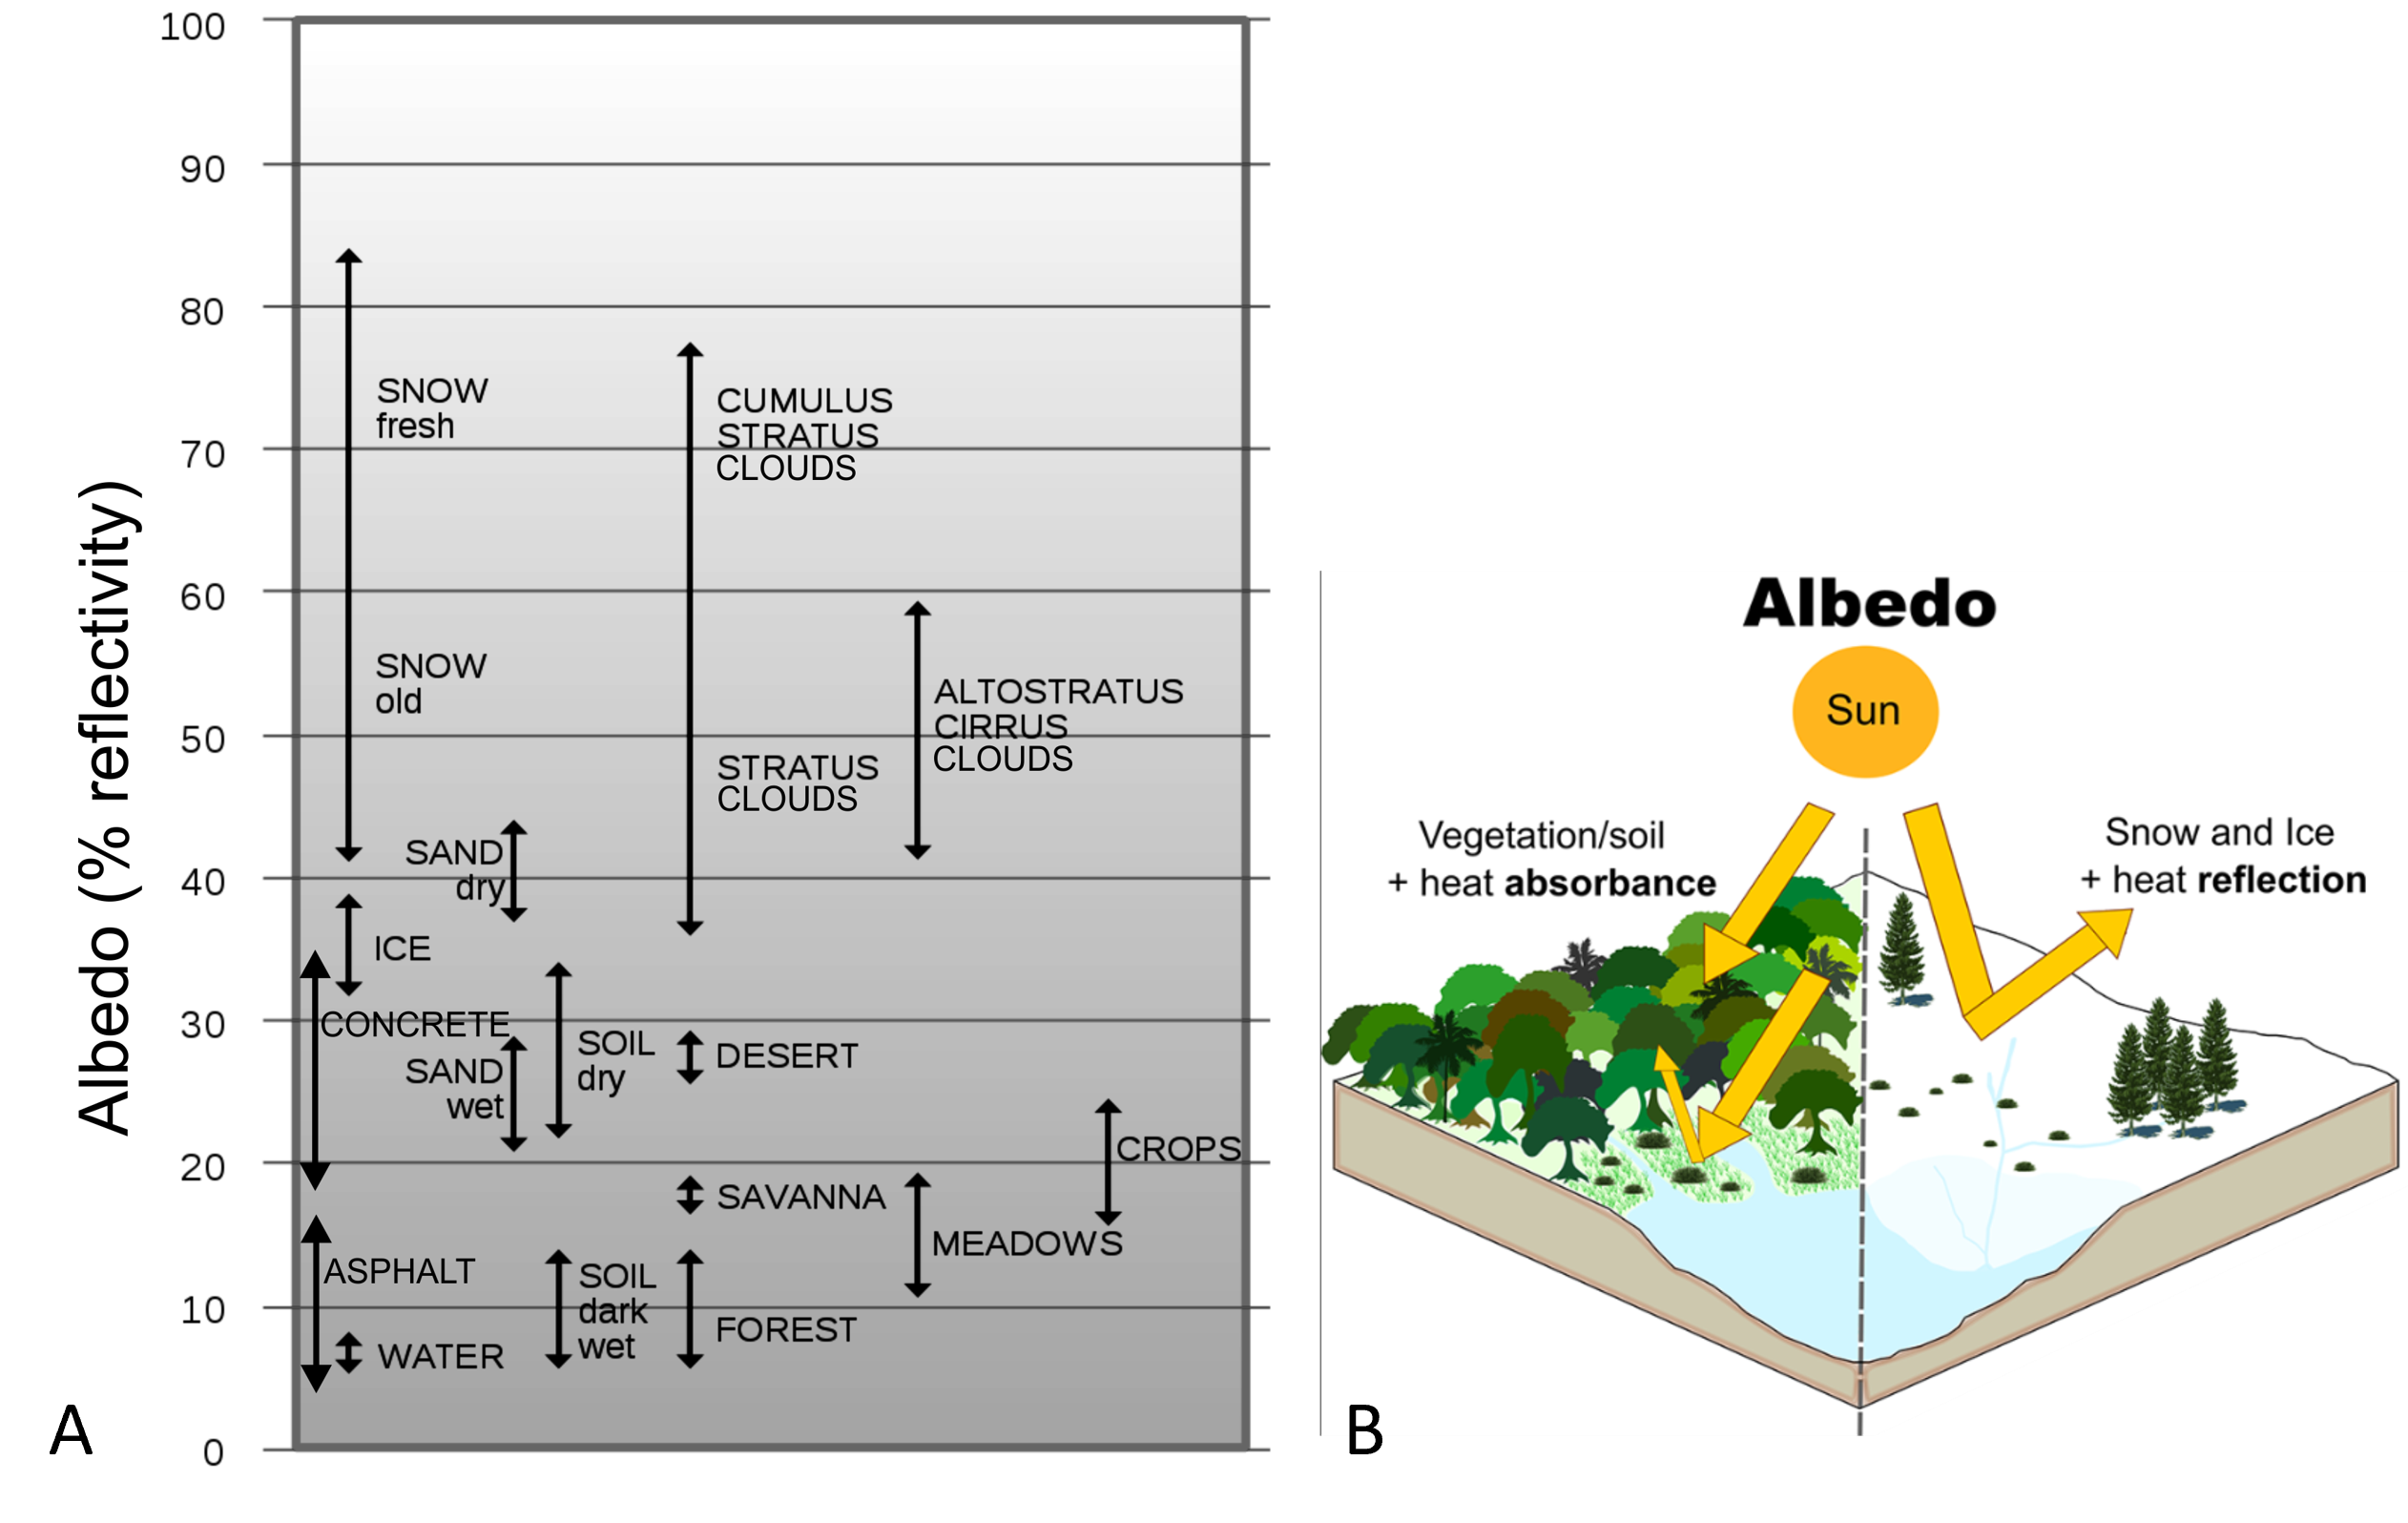
Albedo is measured as the percentage of radiation reflected from a surface (Figure 2.6). High albedo surfaces have a high reflectivity. Surfaces like ice are highly reflective and absorb very little incoming solar radiation. Surfaces like asphalt and concrete have a very low reflectivity and absorb significant amounts of incoming solar radiation (Figure 2.6). This difference in albedo leads to significant differences in heating. In the atmosphere, clouds have a very high albedo and reflect energy, whereas particulate matter has a low albedo and absorbs energy.
Aspect refers to the direction a topographic slope is facing (Figure 2.7). We refer to direction based on the cardinal points of a compass. A southerly aspect means that the topographic slope is facing to the south. In the mid latitudes of the northern hemisphere, a southerly aspect means that a slope is tilted towards incoming solar radiation (based on angle of the noon sun). A northerly aspect in the same location would mean that the slope is tilted away from incoming solar radiation.
Lab Exercises
In this lab you will explore how Earth-Sun relationships generate latitudinal and seasonal differences in temperature, and the foundations for Earth’s radiation budget. You will use several online maps and interactive websites to complete this exercise.
EX1: Earth-Sun Relationships and Earth’s Energy Budget
- According to the NASA article you read (Incoming Sunlight [PDF]), day and night, averaged around the globe, how much energy reaches the Earth from the sun?
- The above number describes an average value across the Earth. Describe the three factors that determine the actual amount of radiation received at the Earth’s surface at a specific location.
The solar constant measures the approximate solar radiation received at the top of the atmosphere. However, at various times throughout the year, certain latitudes tilt towards or away from the sun, based on Earth’s orbit. For example, in December, the northern hemisphere is tilted away from the sun, whereas in July, the southern hemisphere is tilted away from the sun.
Open Explore the Effect of the Angle of Incidence on the Sun’s Energy Interactive Diagram to answer questions 3 and 4. Note this interactive is simplified to only communicate changes in radiation based on sun angle and does not include the influence of the atmosphere on incoming solar radiation.
- Set the month in the box at the bottom of the interactive to “March.” Explain how the amount of solar radiation received at Earth’s surface changes as you move from the equator to the north pole.
- Now let’s see how this changes throughout the year. To get the values you need, cycle through the four months in the box at the bottom of the interactive.
- Record the actual amount of radiation received at Earth’s surface for three latitudes: Equator, Tropic of Cancer and the North Pole in Table 2.1. This table is also provided in Worksheets at the bottom of this lab.
Table 2.1. Actual amount of radiation received at Earth’s surface on the equinoxes and solstices at three locations. Month Equator Tropic of Cancer North Pole March June September December - Graph the points for each month on Figure 2.8, connecting each with lines. Use different symbols for each line and include a legend to reference the symbols. This graph is also provided in Worksheets at the bottom of this lab.
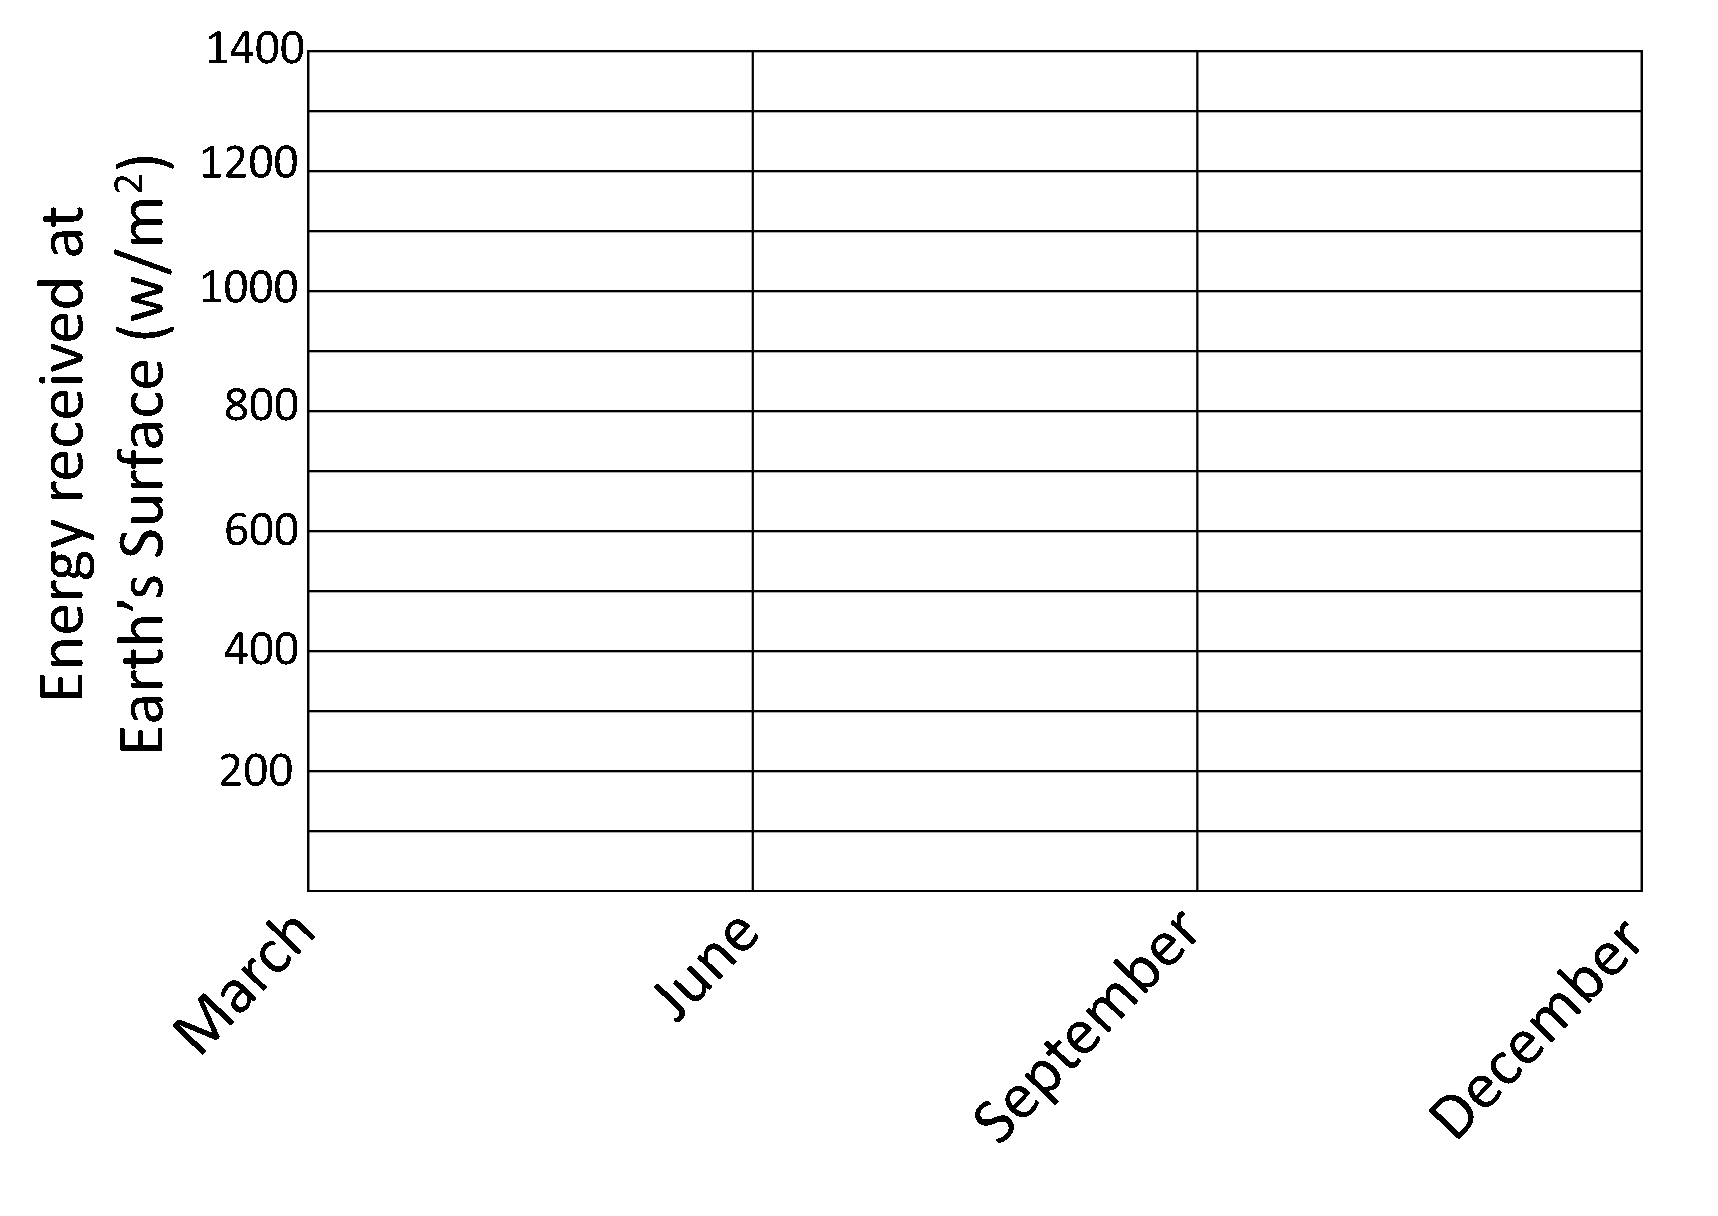
Figure 2.8. Change in energy received at Earth’s surface through time.
- Record the actual amount of radiation received at Earth’s surface for three latitudes: Equator, Tropic of Cancer and the North Pole in Table 2.1. This table is also provided in Worksheets at the bottom of this lab.
Use the analemma (Figure 2.1) to answer questions 5 and 6:
- At what latitude is the Sun directly overhead on your birthday? Record the date and the latitude of the subsolar point.
- Earth Day is celebrated on April 22nd every year. At what latitude is the sun directly overhead on this date?
EX2: The March of the Seasons and the Angle of the Noon Sun
The latitude at which the Sun is directly overhead may be helpful in understanding overall Sun patterns, but let’s say you want to set up a solar panel at your house. You need to know the sun angle for your location on a specific date so that you can setup your solar panel for optimal effectiveness.
- Complete the following calculations for angle of the noon sun (ANS) and relative solar intensity (Intensity, expressed as a percentage). Draw the angle on the figures provided. Show your working. These figures are also provided in Worksheets at the bottom of this lab.
- On Oct. 3rd, if you are located at 0° latitude.
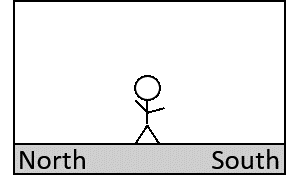
- Angle of noon sun
- Relative intensity of sun angle
- On April 2nd, if you are located at 61° North latitude.

- Angle of noon sun
- Relative intensity of sun angle
- On Dec. 9th, if you are located at 85° North latitude.

- Angle of noon sun
- Relative intensity of sun angle
- On Oct. 3rd, if you are located at 0° latitude.
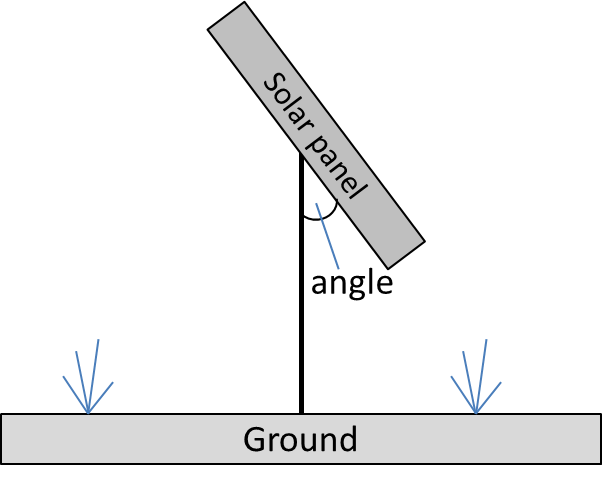
- It’s August 1st and you are climbing up the south facing slope of Mount Denali in Alaska (the highest peak in North America). At noon you come across another climber in distress and need to contact emergency services for a helicopter rescue, but your satellite phone battery is dead. Quickly you remember that you have a portable solar panel charger in your backpack. You unpack it and plug it in to the phone. It begins to charge, but very slowly. You decide to speed up the charge by setting up the solar panel at an angle.
At what angle should you set the solar panel to take the best advantage of the incoming solar radiation? Show all relevant calculations. Figure 2.9 is also provided in Worksheets at the bottom of this lab.
EX3: Global Temperature Distribution and Common Temperature Scales
Seasonality and Sun angle is just one way incoming solar radiation can vary for a specific location. Using satellite measurements it is possible to get a sense of how cloud cover affects incoming solar radiation.
This Satellite Temperature Data website displays temperature data collected by a satellite looking through the atmosphere from above. It calculates the temperature from the reflective surface in the image.
- Choose a location on the map where you can see a cloudless area near the coast. Compare the land and ocean temperatures at this latitude. Is there a difference between the temperatures? Explain why this is the case.
- Now compare the temperatures in the previous question with the temperature measurement at the top of a nearby cloud.
- Is the temperature at the top of the cloud higher or lower than the land and water surfaces?
- What does this tell you about how energy radiated from the Earth’s surface is affected as it interacts with clouds in the atmosphere on its way out to space?
- Assume the top of the cloud is at the top of the troposphere, 18 km above the land surface for your location. Calculate the lapse rate between the Earth’s land surface and the top of the cloud. Show your work.
On April 10, 1912 the steamship Titanic left Southampton England on its maiden voyage across the Atlantic Ocean to New York (Figure 2.10). By the evening of April 15, the Titanic was sinking in the middle of the Atlantic Ocean, after striking an iceberg. The Titanic sank in the cold waters of the northern Atlantic.

- The surface temperature when the Titanic left Southampton, England was 53.1 °F. Convert this temperature to °C.
- The average daily maximum temperature for Southampton, England in April 1912 was 288.5 K. Was the temperature when the Titanic left higher or lower than this average?
- The city of Calgary, Alberta is located at a similar latitude to the city of Southampton, England. In April 1912, the average daily maximum temperature in Calgary was 5.5 °C. Explain the physical geography surrounding why this temperature is so different than the average daily maximum temperature in Southampton. Hint: you may need to look at a map of where Calgary is located relative to where Southampton is.
The Titanic sailed in April, between the extreme conditions of summer and winter. Consult the global temperature maps below for an example of January and July temperatures:
Recall that the maps show temperature displayed as colour: reds indicate hotter temperatures and blues to purples indicate colder temperatures. So, all locations with the same colour will have similar temperatures. You can click anywhere on the map to get a temperature reading for that location.
- Is the temperature contrast between the equator and the Arctic region greatest in winter or summer for the northern hemisphere?
- If latitude were the only control on temperature, the colour bands indicating similar temperatures should run straight across the map from east to west.
- Identify one area on the map where this occurs. Use your knowledge of place names or use an atlas or Google Earth to determine the name of the location you identified.
- What physical geography conditions explain why the temperatures follow this pattern in the place you identified?
- Compare the January and July maps temperature maps.
- Describe one area of the world that exhibits a large annual temperature range.
- What physical geography conditions explain the large annual temperature range for the place you identified?
- The atmospheric conditions on the night of April 15, 1912 were clear, that is, there was no cloud cover. How do you think the lack of clouds that night affected the air temperature, according to what we know about local energy budget and how clouds interact with radiation?
- The last emergency communication from the Titanic before it sank gave its position at the following coordinates: 41˚ 46’ N, 50˚ 14’ W. Go back to the Satellite Temperature Data website. Find some open water in the Atlantic Ocean at a latitude of around 41°N.
- Record the surface water temperature in °C.
- Survival rates for humans in specific water temperatures are given in Table 2.2. Based on the water temperature you obtained in part a, how long would an individual have been able to survive in open water after abandoning the Titanic?
EX4: Lapse Rates
Several distress rockets were fired into the air to alert nearby ships of the Titanic’s position and to aid in the rescue effort. Standard temperature values for different layers of the atmosphere are presented in Table 2.3.
- Plot the standard atmospheric temperature values presented in Table 2.3 on the Exercise 4: Temperature Gradients Graph (provided in the Worksheets). Connect the points with a line and label the troposphere, stratosphere, mesophere and thermosphere.
- The distress rockets passed through the lowest part of the atmosphere. Calculate the lapse rate in the lowest 10 km of the troposphere from the graph you created.
EX5: Albedo and Aspect
Take a look at the glaciers that cover Mount Rainier, a stratovolcano in Washington, USA in Figure 2.11, and use it to answer the questions that follow.
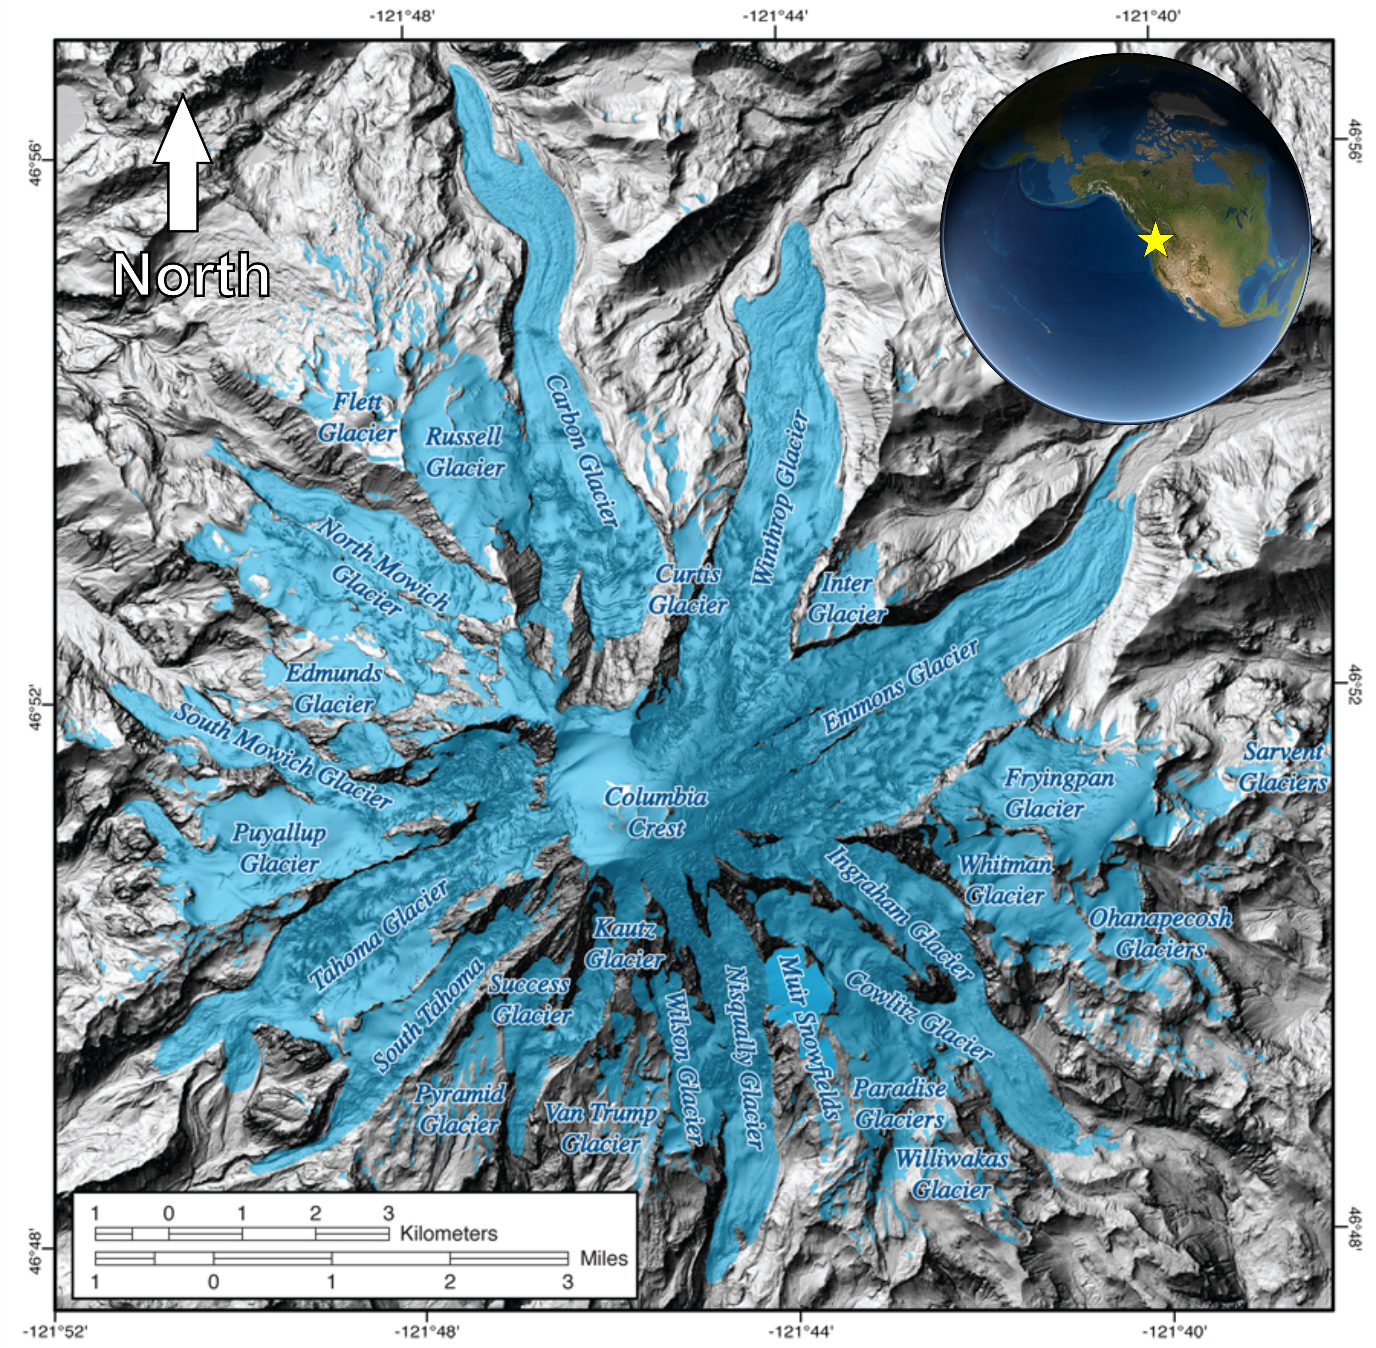
- Mount Rainier contains the greatest amount of glacier ice of any mountain in the lower 48 United States.
- Do you think aspect has a role in controlling the distribution and size of glaciers around the central peak of Mount Rainier? Explain your answer.
- Choose three different glaciers from different locations around the main peak. Compare their aspect and relative size.
- The zones in between the glaciers are covered mostly in bare rock and light forested vegetation.
- How do you think the albedo differences between the middle of the glacier and the locations between the glaciers affects how the glacier melts?
- As the glacier melts further back, more sediment and bare rock is revealed. Do you think this negatively or positively reinforces the melt rate of the glacier? Explain your answer.
Reflection Questions
- Imagine if Earth was not tilted 23.5° on its axis, but instead had no tilt. How would this affect Earth’s energy budget?
- If the Titanic had sunk on a cloudy night, how would that have affected air temperature conditions and potential survivability for those who had to abandon the ship as it sunk?
- The southern hemisphere is about 81% water at the surface, whereas the northern hemisphere is about 61% water how do you think this difference affects the local energy budget for these two different hemispheres?
Worksheets
Lab 02 Student Workbook [Word]
References
Prevedello, J.A., Winck, G.R., Weber, M.M., Nichols, E., & Sinervo, B. (2019) Impacts of forestation and deforestation on local temperature across the globe. PLoS ONE, 14(3). https://doi.org/10.1371/journal.pone.0213368
Olson, M. & Rupper, S. (2019) Impacts of topographic shading on direct solar radiation for valley glaciers in complex topography, The Cryosphere, 13, 29–40. https://doi.org/10.5194/tc-13-29-2019.
Media Attributions
- Figure 2.1: Image modified by A. Perkins and C. Welch and licenced under a CC BY-NC-SA 4.0 licence. Modified from US Coast and Geodetic Survey, Public Domain.
- Figure 2.2: Image by A. Perkins is licenced under a CC BY-NC-SA 4.0 licence.
- Figure 2.3: Image by A. Perkins is licenced under a CC BY-NC-SA 4.0 licence.
- Figure 2.4: Image by A. Perkins is licenced under a CC BY-NC-SA 4.0 licence.
- Figure 2.5: Image by A. Perkins is licenced under a CC BY-NC-SA 4.0 licence.
- Figure 2.6a: Image by H. Grobe (2000) is licenced under a CC BY-SA 2.5 licence.
- Figure 2.6b: Image by Prevedello et al (2019) is licenced under a CC BY 4.0 licence.
- Figure 2.7a: Image by A. Perkins is licenced under a CC BY-NC-SA 4.0 licence.
- Figure 2.7b: Image by Olsen & Rupper (2019) is licenced under a CC BY 4.0 licence. Modified by A. Perkins.
- Figure 2.8: Image by A. Perkins is licenced under a CC BY-NC-SA 4.0 licence.
- Figure 2.9: Image by A. Perkins is licenced under a CC BY-NC-SA 4.0 licence.
- Figure 2.10: Image by Cobh Heritage Centre is in the public domain.
- Figure 2.11: Image by Tom Sisson, USGS is in the public domain.
Image Descriptions
The diagram shows an Analemma, a graph that demonstrates the latitude where the sun is directly overhead for different days of the year. For example, on the equinox dates it is directly overhead at the equator. The shape of the graph is in a figure-eight. The dates are shown on the figure-eight portion of the diagram and the latitudes are written on the y-axis.
Figure 2.6. Albedo of common surfaces.
In part A) of the figure there is a table that shows different materials and their associated albedo measured as percent reflectivity. Water is at the bottom of the scale, with a low albedo and percentage of reflectivity and snow and ice are on the high end of the scale with a high albedo and percentage reflectivity. In part B) there is an image of two different land surfaces, the left side showing a highly vegetated surface that absorbs significant solar energy with low reflection, and the right side showing a bare land surface with significant reflection and high albedo.

