Lab 18: Volcanoes and Earthquakes
Chani Welch; Todd Redding; Saoirse MacKinnon; and Fes de Scally
Vulcanicity (volcanism) and earthquakes (seismic activity) are common processes in tectonically active parts of the world. The most profound discovery in the earth sciences in the past century has been plate tectonics, which provides the mechanism with which to understand how continents move around the globe. For physical geographers, the greatest value of the theory of plate tectonics lies in its ability to explain the spatial distribution of volcanism, earthquakes, and other major landscape features such as mountain chains on Earth.
British Columbia is located in the Pacific Northwest, a tectonically active part of the world. As such, volcanoes and earthquakes have, and continue to, modify the landscape in which we live, affecting our daily lives.
Learning Objectives
After completion of this lab, you will be able to
- Understand the role of plate tectonics in determining (or controlling) the types and locations of volcanoes.
- Understand the role of plate tectonics in determining (or controlling) the types and locations of earthquakes.
- Understand the hazards associated with volcanoes and earthquakes.
- Be able to calculate rates of geologic movement.
- Be able to calculate return periods of geologic events.
- Use Google Earth (Web) to make geographical measurements.
Pre-Readings
Plate Boundaries, Volcanism and Earthquakes
Most volcanism and seismic (earthquake) activity on Earth occur along the boundaries of tectonic plates where they interact with adjacent plates. Interaction between adjacent plates at these boundaries can take three forms:
- Divergence where plates are moving away from each other, frequently by seafloor spreading;
- Convergence where plates are colliding with each other, the collision taking three different forms:
- ocean - ocean plate collisions where the heavier colder plate slides under the lighter plate, producing volcanic island arcs;
- subduction zones where a more dense oceanic plate is forced below a less dense continental plate, producing volcanic activity inland; and
- continent - continent collisions where the collision causes intense folding, faulting and uplift; and
- Transform (strike-slip) faulting where the adjacent plates are sliding laterally past one another.
For further review, please refer to Lab 17.
Volcanoes
Volcanoes develop where magma reaches Earth’s surface, which includes the following settings:
- Tectonic plate boundaries (convergent or divergent);
- Hot spots, where plumes of magma rise up from the mantle through the rigid lithosphere; and
- Rift zones located at great distance from any plate boundary.
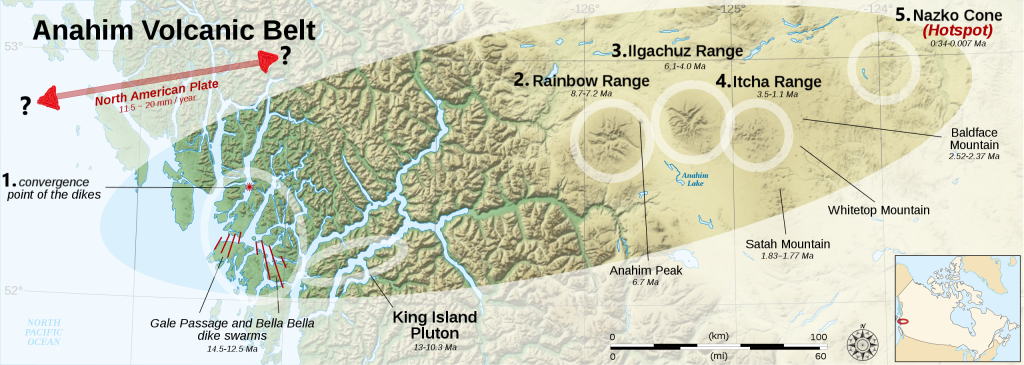
The volcanoes of the Cascade Volcanic Arc in British Columbia (BC) and the western United States (US), for example, are created by subduction at the Cascadia Subduction Zone. The hotspot volcanoes of Hawai’i and the flood basalts of the Deccan Traps of west-central India are probably the best-known examples of volcanism associated with mantle plumes and rift zones, respectively. Both types are also found in BC. For example, the Anahim Volcanic Belt (Figure 18.1) provides evidence of a hotspot that has been active over the past 13 million years (Ma).
Volcanoes are composed of extrusive igneous rock, the type of which depends on the mechanism of formation. Volcanic landforms can be composed of solidified lava, ash and other material ejected from the volcano. Types of volcanoes are classified by size, material composition and geologic setting. The three types of volcanoes are described in Table 18.1.
Shield Volcanoes are the largest volcanoes and occur over hot spots (e.g. Hawai’i) or at divergent plate boundaries (e.g. Iceland). The magma that forms these volcanoes has a low silica content and viscosity, which results in oozing lava flows, and effusive eruptions with little ash. The lava flows rapidly over long distances before cooling, and forms rather flat volcanoes with gently-sloping sides.
Composite or Stratovolcanoes typically occur at convergent and subducting plate boundaries. The magma contains moderate to high quantities of silica, and is much more viscous; consequently, the magma is thicker and results in explosive eruptions with a mixture of lava, tephra, ash and pyroclastics. The volcanoes that result from the alternating layers of lava and ash are steep-sided cone-shaped mountains that are often topped by ice (e.g. Mt. Ranier in the USA), even when they are located in the tropics (e.g., Popocateptl in México).
Cinder Cones are small volcanoes that occur in a variety of volcanic settings, but typically in association with larger volcanoes. Because the geologic setting for cinder cones is variable, the magma that forms cinder cones is also variable, ranging from low to high silica content, and low to high viscosity. The combination of lava and ash that erupt explosively from these small volcanoes forms steep-sided but small cones.
Volcanic Hazards
Volcanic hazards to human activity are numerous, and some can persist for years, centuries, and even millennia following an eruption. The following is a brief description of these hazards.
The term pyroclastics comes from the Greek words pyr (fire) and klastos (broken in pieces). It refers to any magma which is explosively erupted into the atmosphere and then cooled and solidified prior to hitting the ground. It ranges in size from large blocks of rock (volcanic bombs) to fine ash. Tephra is another term for pyroclastics.
Pyroclastic Falls
These occur when pyroclastic material (pyroclastics) rains out of an eruption column in the atmosphere. While coarse pyroclastic material such as volcanic bombs, pumice and scoria rarely land far from the erupting vent, finer material such as lapilli and ash can travel much further. Fine ash can travel hundreds to thousands of kilometres from its eruption source, and is therefore the most far reaching hazard during a volcanic eruption.
Pyroclastic Flows
When all or part of an eruption column thrown into the atmosphere collapses back on itself, or when a solidified dome of lava at the volcano’s vent suddenly collapses, pyroclastics may flow rapidly down the slopes of an erupting volcano. In addition to often travelling at speeds of more than 200 km/h, pyroclastic flows are very hot (several hundred °C). This makes them one of the most destructive effects of volcanism. A nuée ardente (French for glowing cloud) is a particularly destructive type of pyroclastic flow consisting of a fast-moving mixture of pyroclastic material and glowing hot gases.
Lava Flows
Flows of molten lava occur when erupting lava is not immediately solidified and shattered into pyroclasts. The ability of lava to flow depends on its viscosity, which is largely a function of its silica content (Table 18.1). Lava flows rarely threaten human lives because the lava moves too slowly, but anything in their path is usually completely destroyed. The eruptions of Mount Kīlauea in Hawai’i in 2018 illustrate how extensive lava flows can be created during effusive eruptions of low-viscosity magma.
Debris Avalanches
Sudden and rapid avalanches of volcanic rock can occur when gravity acts on the steep slopes of composite volcanoes. Debris avalanches are extremely destructive, but fortunately one of the least common volcanic hazards globally. Nevertheless, in BC’s Garibaldi Volcanic Belt near Whistler (the northernmost portion of the Cascade Volcanic Arc), volcanic eruptions during the Pleistocene and Holocene created many steep composite volcanoes which today are prone to debris avalanches. The instability of these volcanoes several thousand years after their last eruption results from their weak volcanic edifices coupled with the effects of glacial erosion, high groundwater pressures, and possibly seismic activity. An example of this type of volcanoes is found in the Mount Meager Volcanic Complex northwest of Pemberton BC.
Lahars
If a debris avalanche contains large quantities of water, it may continue as a lahar once the larger blocks of rock have settled out. Lahars are mudflows or debris flows formed by the mixing of pyroclasts and water (lahar is an Indonesian word for mudflow).The water can come from an impounded crater lake that is suddenly breached, heavy rain, or melting of a volcano's snow and glacier cover. While lahars are often created during an eruption, they can also occur years to decades following an eruption if a supply of erodible pyroclasts and water is available.
Volcanic Gases
While volcanic gases consist mostly of water vapour, other gases such as carbon dioxide, carbon monoxide, chlorine, sulphur, and fluorine compounds are also released during an eruption. Such gas emissions can be harmful or toxic within about 10 km of a volcano’s vent when under specific atmospheric conditions. Also, volcanic lakes can accumulate a large volume of carbon dioxide deep within the lake’s waters. When suddenly released to the lake’s surface, the gas can asphyxiate any humans and animals in the lake’s vicinity.
Earthquakes
Earthquakes occur where sections of the Earth’s crust move past one another. Hence, earthquakes are most common along tectonic plate boundaries or along faults that exist within plates. Earthquakes also occur in association with the movement of magma in the subsurface. An earthquake is the product of a release of stress and movement of the crust. The location within the Earth where the earthquake motion is initiated is called the focus, while the point on the Earth’s surface directly above the focus is called the epicentre.
The epicentres of most earthquakes show a remarkable coincidence with plate boundaries (Figure 18.2). Seismic activity along plate boundaries is related to the gradual build-up of stress. This occurs when two adjacent plates stick together but continue moving, causing the stuck parts to deform. The stress is released periodically and suddenly when the locked part of the plate boundary becomes unstuck. Earthquake motion results from a mechanism called elastic rebound, in which the plates that were deforming because they were locked together spring back to their original shape, releasing the stress. In general, the longer a section of plate boundary or fault has been stuck or locked, the stronger the earthquake will be when it eventually becomes unstuck. At subduction zones, the highest magnitude earthquakes occur at shallow depths where the adjacent plates are in contact, whereas the deepest earthquakes occur within the descending plate.

The strength of earthquakes is measured in two different ways (Moment Magnitude and intensity). An earthquake's magnitude is a quantitative measure of the amount of energy released. The intensity of an earthquake is a qualitative description of the amount of damage caused. Massive Moment Magnitude (M) 8-9 earthquakes called megathrust earthquakes occur periodically at converging plate boundaries when a plate subducting under an overriding plate becomes unstuck after the subduction zone has been locked for centuries.
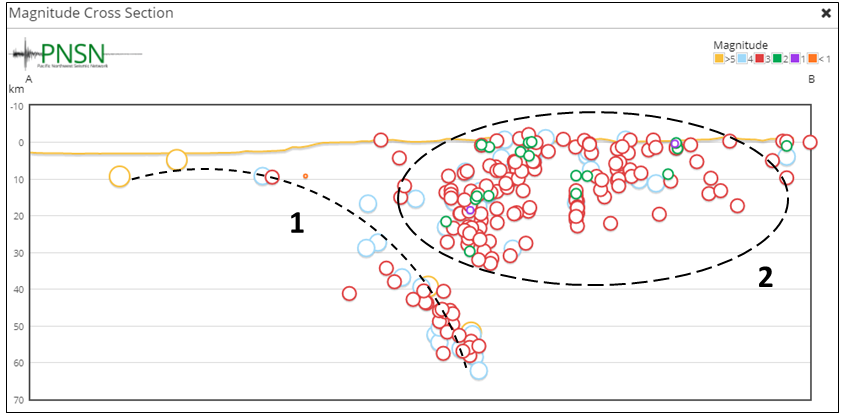
The Cascadia Subduction Zone stretching offshore from Vancouver Island BC to northern California is one such subduction zone where a megathrust earthquake is expected to occur one day. Note that the seismic situation off the west coast of BC is complicated by the fact that diverging and transform plate boundaries are also present. The locations of notable earthquakes in the Pacific Northwest are depicted on Figure 18.3. Figure 18.4 shows the depth and magnitude of earthquakes for the cross section labelled A – B.

Earthquake Hazards
Earthquake hazards are not as multi-faceted as volcanic hazards, and consist mainly of the seismic shaking that can damage or destroy buildings, transportation infrastructure, and other structures such as dams. Two secondary hazards that frequently accompany earthquake hazard are slope failures in mountainous terrain, and fires. One of the more well-known type of earthquake hazards are tsunamis.
Calculating Rates
A rate is the amount of change in some quantity over a given period of time. In this lab we are interested in rates of movement. Rate of movement is called velocity, and is the rate of change in distance per unit time. It is commonly expressed in kilometres per hour (km/h) and metres per second (m/s). The form of the relationship between distance travelled and time is shown in Equation 18.1:
[latex]\text{Velocity} = \dfrac{\Delta \text{Distance}}{\Delta \text{Time}}[/latex]
For example, what is the velocity of a lava flow that travels 15 km in 10 hours? Using Equation 18.1,
[latex]\text{Velocity} = \dfrac{\Delta \text{Distance}}{\Delta \text{Time}}[/latex]
[latex]\text{Velocity} = \dfrac{15\text{ km}}{10\text{ h}} = 1.5\text{ km/h}[/latex]
This relationship can be re-arranged to solve for distance or time. A good way to think about how the equation can be re-arranged is by examining the units of the output and making sure they make physical sense to you. For more detailed explanations, please refer to SERC Carleton's How do I calculate rates? Calculating changes through time in the geosciences and How do I isolate x (or P or T ...) in a formula? Rearranging equations to solve for a given variable.
Calculating Return Periods
A return period (Rt) is the average amount of time between recurring events, such as floods, earthquakes, landslides, and volcanic eruptions. Return periods are also known as recurrence intervals. The units of return period are years (e.g., once every 100 years). To calculate return period, divide the number of years of record by the number of events (Equation 18.2):
[latex]R_{t} = \dfrac{\# \text{ years of record}}{\# \text{ events}}[/latex]
For example, what is the return period for floods where 17 floods have been observed over the past 300 years?
[latex]R_{t} = \dfrac{\# \text{ years of record}}{\# \text{ events}}[/latex]
[latex]R_{t} = \dfrac{300 \text{ years}}{17 \text{ floods}} = 17.6\text{ years}[/latex]
It is important to be aware that this simplified calculation of return period is based on a number of assumptions, most importantly, that there is no underlying systematic pattern within the data record. If you are interested in understanding more about this, read Is the coast toast? Exploring Cascadia earthquake probabilities [PDF]. You are not required to calculate probability in the exercises in this lab.
Lab Exercises
In this lab we begin by using Google Earth (Web) to track the path of a lahar as it moves downstream from the main crater of Mt. St. Helens, and calculating the return period of such events. Next, we calculate the rate of plate movement that produced the Anahim Volcanic Belt. Lastly, we identify the geographic and tectonic settings of recent earthquakes in Canada and the Pacific North West. This lab consists of three exercises and should take 1.5 to 3 hours to complete.
Where questions require you to calculate answers, please write the calculations on a piece of paper, clearly identifying the exercise and question number, and the data you used to obtain your answer. Once you have completed the lab, photograph this piece of paper and upload to your Learning Management System for review by your instructor. Check with your instructor to find out what file formats are acceptable. You will also create two KML files for upload.
EX1: Mt. St. Helens Lahar, 1980
During the eruption of Mt. St. Helens in 1980, a debris avalanche in the main crater developed into a lahar and eventually travelled down the North Fork Toutle River, into the Cowlitz River, and finally into the Columbia River at Longview, Washington. The lahar initiated at approximately 1:00 pm on May 18, 1980, and the flow reached the Columbia River at midnight.
Open Google Earth (Web). Type Mt. St. Helens into the search feature (indicated by a magnifying glass icon at the top left of the screen) and Google Earth will take you there.
Create a Google Earth project containing the locations you need in order to answer this question.
Step 1: Click on the Projects icon (fifth down the list on the left of the screen). Select New Project then Create KML file.
Step 2: Click on the pencil icon and label the project Mt. St. Helens Lahar.
Step 3: Add and label a placemark for the start point (the summit) using the dropdown menu New feature.
Step 4: Add and label a placemark for the end point of the lahar (the confluence of the Cowlitz and Columbia rivers at Longview, Washington) using the dropdown menu New feature.
Step 5: Using the Measure distance and area tool in Google Earth (ruler icon on bottom left of screen), trace the flow path of the lahar between the start and end points you identified. Note that the lahar travelled from the summit crater of Mt. St. Helens along the North Fork of the Toutle River and down the Cowlitz River to meet the Columbia River at Longview, Washington.
Note: The line you draw with this tool has large dots which are the points you clicked. If you want to adjust the location of the line, double click on one last point to pause your measurement. Notice that your line now has large dots in the locations that you clicked and small dots at intermediate points. You can click on and drag either dot type to adjust your line. If you adjust a small dots, they become large dots, and new small dots appear between them. When you are ready to continue your line, click on the last large dot and drag it in the direction you want to continue your measurement. You can only extend the measurement in a straight line, but you can adjust the measurement line using the procedure just described.
- What is the flow path distance of the lahar between the summit crater at the top of Mt. St. Helens and the confluence of the Cowlitz and Columbia Rivers (in km)?
- What is the average flow velocity for the lahar in units of km/h and m/s? Show your work.
- The measured flow velocity of the lahar varied over the full travel distance. Where do you think the flow velocity would have been highest? Explain your rationale.
- Examine the imagery of Mt. St. Helens in Google Earth (Web). What do you think is the most probable source of water for the lahar?
- Record the coordinates and elevation for the locations where the lahar started and finished in Table 18.2. This information can be obtained by pointing the finger of your cursor at the base of the placemark of the point of interest and reading from the coordinates in the bottom-left of the screen. Elevation has units of metres above sea level (m ASL).
- Calculate the average gradient along the flow path between the summit crater and the confluence of the Cowlitz and Columbia Rivers using the data you collected in Q1 and Q4. Express it as
- percent (%)
- elevation change per slope distance (m/km)
Show your work. If you require a refresher on calculating gradient, please refer to Lab 16 Calculating Slope Gradient.
- Geologic evidence indicates a long history of relatively frequent lahars associated with Mt. St. Helens. Over the past 4500 years, there is evidence of 15 separate lahar events. What is the average return period of lahars over this period of time? Show your work.
EX2: Determining Rates of Tectonic Plate Movement
We can use hotspot volcanic chains to track the rate and direction of the movement of Earth’s tectonic plates by assuming that mantle plumes and the hotspots they generate are stationary. In this exercise you will use the Anahim Volcanic Belt (Figure 18.1) to determine the rate and direction of movement of the North American plate. Use the average ages of each feature provided in Table 18.3 for your calculations.
Add each of these volcanic features to a new project in Google Earth (Web).
Step 1: Create a new project following the instructions provided for EX1 and label it Anahim Volcanic Belt.
Step 2: Insert and label placemarks for each of the volcanic features using the coordinates in Table 18.3. When you copy and paste the coordinates into the Google Earth (Web) search tool, be sure to include the N after the latitude and the W after the longitude.
- Using the Measure distance and area tool (ruler icon on left of screen) in Google Earth (Web), measure the distance between each of the features and record your measurements in Table 18.4.
- Calculate the rate of tectonic plate movement between each of the sets of volcanic features in units of mm/yr and record in Table 18.5. Show your work. Hint: Use the age of the features provided in Table 18.3 and the distances you recorded in Table 18.4.
- In which cardinal direction is the North American plate moving? What evidence do you have to support your answer?
- Has the movement rate been constant through time? Explain your rationale.
EX3: Identifying the Geographic and Tectonic Settings of Earthquakes
This exercise has three parts:
- obtaining data about recent earthquakes in Canada;
- identifying locations of earthquakes in the Pacific Northwest; and
- calculating the return periods of megathrust earthquakes at the Cascadia Subduction Zone.
The Canadian Geological Survey monitors earthquakes through a global seismometer network. The locations, depths and magnitudes of Canadian earthquakes can be seen on the NRC Earthquakes Canada website.
- Scroll down to the map depicting all earthquakes of the last 30 days in Canada. What is the tectonic setting (plate boundary type) for most of the earthquakes? Be as specific as you can.
- Select Region: Western Canada using the region selector at the top left of the map. You can expand the Legend by clicking on it. It is located in the bottom-right corner of the map. Circle size reflects earthquake magnitude, whereas colour represents time since occurrence. You may also view information in a table by clicking on List points plotted in the map located immediately below the map. You may have to scroll down below the map to the tabulated data when the new screen opens.
- Take a screenshot of the data (map or table). Submit this with your assignment.
- What was the magnitude (M-scale) of the largest earthquake in this region? Hint: You can sort the table data by magnitude by clicking on the Magnitude column heading.
- Where was it located?
- What was the depth of this earthquake?
- Select Region: Eastern Canada.
- Take a screenshot of the data (map or table). Submit this with your assignment.
- What was the magnitude (M-scale) of the largest earthquake in this region?
- Where was it located?
- What was the depth of this earthquake?
- Figure 18.3 shows the locations of notable earthquakes in the Pacific Northwest region over the period of 1997 to present. Open Google Earth (Web) and determine what surface features the cluster of earthquakes in the centre of the image are associated with. Hint: If you want to look at Figure 18.3 in more detail, open the Pacific Northwest Seismic Network Notable Events website and zoom into the regions of interest. Click on any point and the associated data will be displayed in a pop-up window.
- Figure 18.4 shows a cross section (from A-B in Figure 18.3) of these notable earthquakes in the Pacific Northwest. Two main groupings of earthquakes are identified on Figure 18.4, labelled 1 and 2 and indicated by dashed lines. Which geologic/tectonic processes are causing each group of earthquakes, and in which type of tectonic plate are they occurring?
- Cores obtained from the seafloor off the coast of southern BC and Washington state show evidence of 41 megathrust earthquakes in the past 10,000 years at the Cascadia Subduction Zone (CSZ).
- What is the average return period of megathrust earthquakes at the CSZ? Show your work.
- Given that the last megathrust earthquake at the CSZ occurred on 26 January, 1700, in which year do you expect the next one to occur? Show your work.
- How certain are you that the next megathrust earthquake will occur on the date you calculated in 17(b)? Provide a qualitative explanation. You do not have enough information to calculate probability mathematically.
Reflection Questions
- The return period you calculated for lahars at Mt. St. Helens in EX1 is an average return period. When do you think lahars will be most common at Mt. St. Helens? Explain the rationale for your answer.
- What type of volcanoes are present in the Rainbow, Ilgachuz and Itcha Ranges? List the evidence you have to support your answer.
- In which geographic location do you think the majority of damage will be when the next megathrust earthquake occurs in the CSZ? What kind of damage is likely? Explain your rationale.
Media Attributions
- Figure 18.1: Image by Sémhur (2007) is licensed under a CC BY-SA 4 .0 licence. Adapted by C. Welch.
- Figure 18.2: Image by NASA, DTAM Project Team [PNG] is in the public domain.
- Figure 18.3: Epicentres of notable earthquakes in the Pacific Northwest from 1997 to 2019 © Pacific Northwest Seismic Network. Used with permission. Adapted by C. Welch.
- Figure 18.4: Cross-section showing depth and magnitude of notable earthquakes © Pacific Northwest Seismic Network. Used with permission. Adapted by C. Welch.
Image Descriptions
Figure 18.4. Cross section (A to B in Figure 18.3) showing depth and magnitude of notable earthquakes within the shaded area in Figure 18.3 (open circles)
A cross-section of the Pacific Northwest along the horizontal line marked on Figure 18.3 between points A and B. The horizontal distance is on the x axis (no scale provided) and the depth below the ground surface is shown on the y axis in kilometres. 0 m is mean sea level. The ground surface is depicted by a solid yellow line. The position of each circle on the cross section represents the depth of a single earthquake below the ground surface, which is also known as the focus. The colour of each circle indicates the magnitude. A legend for magnitude is located in the top-right corner of the figure. Two separate groups of earthquakes are identified by dashed black lines. The general shape of Group 1 is a curve that starts near sea level in the west and descends deeper below ground level to the east. Group 2 is a cluster of earthquakes that is less deep than the lowest portion of Group 1 and to the east, which is inland.

![NASA, DTAM Project Team [PNG]](https://commons.wikimedia.org/wiki/File:Quake_epicenters_1963-98.png)