Chapter 5. Immigration and the Immigrant Experience
5.3 Immigrants by the Numbers
We have already observed that Canada was a net exporter of people from 1867-1896. Newcomers arrived, but they were very often just passing through. The end to free land in the American West in the 1890s was one factor in redirecting the tide of emigrants from Europe toward the north. Another, from 1896, were the new approaches taken by the Laurier administration under the leadership of Clifford Sifton (see Sections 4.4 and 5.4).
This is not to say that the immigration that was recorded from 1867-1896 did not matter. Hundreds of thousands were added to the mix and the composition of Canadian settler society changed significantly. British immigrants were the most numerous, but people who described themselves as German in origin increased by a third from 203,000 in 1871 to 310,000 in 1901. Three immigrant groups stand out in particular through to 1901: Chinese numbers reached 17,312 (increasing from 4,400 in 1881 to 17,000 in 1901); Russians at 19,825; and Scandinavians (Norwegians, Swedes, Icelanders, and Finns grouped together) at about 31,000. None of these groups had much of a presence in Canada prior to Confederation (although there were Chinese in British Columbia in significant numbers before 1871).
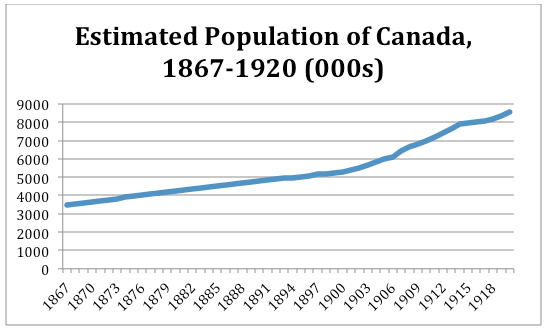
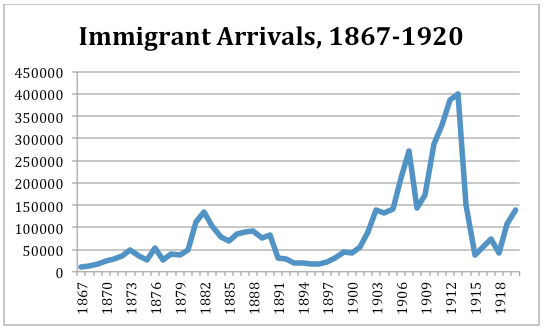
Tables 5.1 and 5.2, respectively, show the growth in population generally and the numbers of immigrants arriving yearly between 1867-1920. What may be seen immediately is: 1) the slowness of immigration’s growth before the 1890s (notwithstanding a couple of spurts); 2) the fact that it was actually in retreat through most of the 1880s and into the 1890s; and 3) the great take-off of immigration as Canada moves into the 20th century. The peak on the eve of the Great War is also unmistakable, in that it is followed by a near-collapse as the conflict rages. In the years 1911, 1912, and 1913 between 300,000 and 400,000 immigrants arrived each year, most of them from Britain and continental Europe.[1]
The complexion of the population in aggregate changed dramatically. On the eve of Confederation, fewer than one-in-five Canadians were born somewhere else, principally in the British Isles or the United States. That share started to decline almost immediately until 1911 when it pushed back through the 22% mark; as a result, a very different country was created. In 1871 there was a significant German community in Canada but otherwise French and English were the norms. By 1911, a quarter of the immigrant tide was coming from continental Europe and most of that from central, eastern, and southern Europe. By 1921, the main “ethnic” immigrant groups constituted more than one-in-eight of the population. The majority (just over half) of the foreign-born to 1931 came from Britain and Ireland; another 20% or more were born in the United States. Regardless of point of origin, as of 1921 the immigrant population in Canada was proportionally larger than in the United States.[2]
We know as well that immigrants in the pre-Great War period were overwhelmingly male. Men are over-represented in every age category from 10 to 14 years and up (after 65 years, the ratio of men to women nearly balanced out). This suggests that either boys were demonstrating a particular determination to emigrate from Europe and Asia or that they were preferred to daughters when it came time to move (principally because their prospective job prospects were better). In other words, families with more sons than daughters might be more inclined to emigrate than those with more daughters. As to young adults, these sex ratio imbalances had serious ramifications. In the 20 to 34 age cohorts, there were more than twice as many men as women in 1911. Women and daughters might be sent for later, but this pattern of maleness persists throughout much of the 20th century. The sex ratio among the foreign-born reaches a peak of 1.68 men to every woman in 1911 and among certain immigrant groups it could be much higher. Among the Chinese it hovered around 200:1 for decades, and among the Scandinavians in 1931 it was 268:1. These last examples are very definitely outliers, but the implications of a distorted sex ratio for marital fertility ought to be obvious.
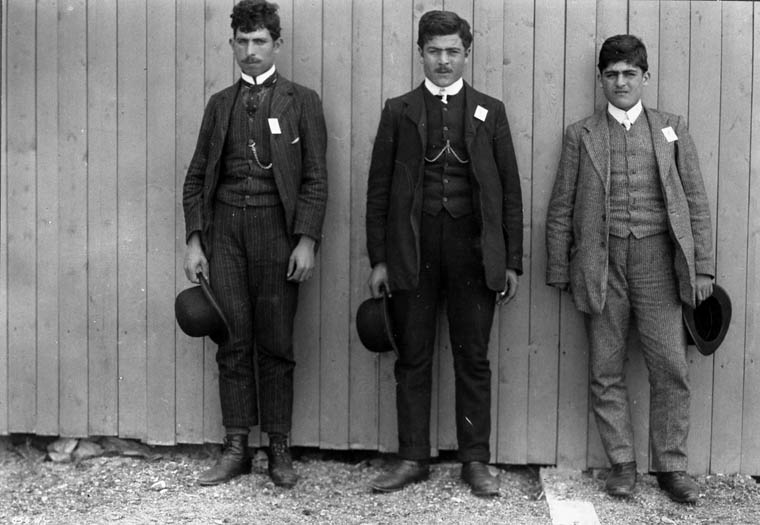
What is more, we know that the immigrant population was young but adult. The foreign-born on the eve of the Great War were mostly under 40 years of age and 20-somethings was the largest cohort. Despite photogenic images of immigrant families, surprisingly few foreign-born children appear in these statistics.[3] Having said that, the arrival of immigrants brought higher fertility rates, so much so that they slowed and, in places, reversed a significant downward trend in Canadian fertility rates. The estimated annual average number of births per 1,000 population in Canada in 1851-61 was 45; in 1901-11 it fell to 31 and slid to 29 between 1911-1921.[4] Without the high fertility of immigrant communities these numbers would have been more depressed.
Distribution of immigrants provides a different sense of this change. The Maritime provinces and Quebec experienced little demographic change arising from immigration. Lebanese Christians were an important addition to Prince Edward Island, but there were few other ethnic enclaves in the region by the Great War. The share of population that was foreign born in the Maritimes was only 5.2% in 1901, rising to a little more than 6% in 1911 — a level that held nearly steady for 30 years. Quebec was similarly mostly native-born in 1901 — a comparable 5.4% of the population was foreign — but from there the share increased more markedly to 7.3% in 1911 and more than 8% in the Interwar years. West of the Ottawa River, however, 15% of Ontarians were foreign-born in 1901 and that passed the 20% mark before the Great War and continued to rise to nearly 25% in 1931. The Prairie provinces taken as a region began the century with a quarter of the population born abroad, rising to 49% in 1911. The share dropped to 21% in 1921 but that reflected the impact of immigrant fertility — the newcomers were adding significant native-born children to the population and thus shrinking their own share of the total. Still, the renewal of immigration in the 1920s created a second surge and by 1931 nearly 37% of Prairie Canadians were born elsewhere. British Columbia behaved differently from the rest of Canada in this respect, being the least native-born population of the lot. Foreigners constituted 44% of the population in 1901, rising to 57% in 1911 and only tapering slightly to 50% in 1921. From 1901 to 1961, British Columbia’s population was, proportionately, the most foreign-born of all regions. Of all the regions, only the North-West Territories reversed the trend. Starting at 37% in 1901, the share of Northerners born abroad fell to 20% 10 years later and then 15% in 1921, where it stayed for the next two decades.[5]
Studies of immigrants in Canada tend to focus on their experiences as newcomers adjusting to new circumstances, or as outsiders to which the established population reacts, or as ethnic enclaves whose cultural resilience and change is subject to examination. As a demographic phenomenon, however, their profound impact is often too quickly forgotten. Within little more than a generation, post-Confederation immigrants had fundamentally transformed the population’s main features while changing in significant ways its fertility, family size, and nuptial patterns. In each of these regards, they had a lasting impact.
Key Points
- Immigrants in the post-Confederation period rapidly changed the ethnic and age composition of the population, as well as the gender ratio in many regions.
- Immigration was slow to take off but it did so between 1896-1914, and again in the 1920s, making Canada more foreign-born than the United States.
- The distribution of immigrants was wildly uneven, barely impacting the Maritimes and Quebec.
Media Attributions
- Arab Immigrants © John Woodruff, 1859–1914 is licensed under a Public Domain license
- Estimated Population of Canada 1867–1920 (000s)
- ch5.3-Table-5.2-Immigration-Arrivals 1867-1920
- Roderic Beaujot, Population Change in Canada: The Challenges of Policy Adaptation (Toronto: McClelland & Stewart, 1991), 105. ↵
- Donald H. Avery, Reluctant Hosts: Canada’s Response to Immigrant Workers, 1896-1994 (Toronto: McClelland & Stewart, 1995), 22. ↵
- Warren E. Kalbach, The Impact of Immigration on Canada’s Population (Ottawa: Dominion Bureau of Statistics, 1970), 54. ↵
- Warren E. Kalbach and Wayne W. McVey, The Demographic Bases of Canadian Society (Toronto: McGraw-Hill, 1971), 56-7, 134-5. ↵
- Warren E. Kalbach and Wayne W. McVey, The Demographic Bases of Canadian Society (Toronto: McGraw-Hill, 1971), 143. ↵
