Chapter 2: Leading Strategically
Assessing Organizational Performance
Learning Objectives
- Understand the complexities associated with assessing organizational performance.
- Learn each of the dimensions of the balanced scorecard framework.
- Learn what is meant by a “triple bottom line.”
Organizational Performance: A Complex Concept
Have you ever been to an archery range and shot arrows at the target? If you have, you already understand the basics of organizational performance! You aim at the centre of the target – bulls-eye. But the most important part of each shot is the assessment of whether you are high, low, too far left or too far right – feedback on your performance. For businesses, organizational performance refers to how well an organization is doing in reaching its vision, mission, and goals. Assessing organizational performance is a vital aspect of strategic management. Executives must know how well their organizations are performing to figure out what strategic changes, if any, to make. Performance is a very complex concept, however, and a lot of attention needs to be paid to how it is assessed.
Two important considerations are:
(1) performance measures and
(2) performance referent.
(Figure 2.5 “How Organizations and Individuals Can Use Financial Performance Measures and Referents”)
Performance measures are a metrics along which organizations can be gauged. Most executives, investor and stakeholders watch and examine measures such as profits, stock price, and sales in an attempt to better understand how well their organizations are competing in the market, as well as future predicted results. But these measures provide just a glimpse of organizational performance.
Performance referents are also needed to assess whether an organization is doing well. A performance referent is a benchmark or standard used to make sense of an organization’s standing along a performance measure Suppose, for example, that a firm has a profit margin of 20 percent in 2011. This might sound great on the surface. But suppose that the firm’s profit margin the year before, in 2010, was 35 percent and that the average profit margin across all firms in the industry for 2011 was 40 percent. Viewed relative to these two referents, the firm’s 2011 performance is cause for concern.
Using a variety of performance measures and referents is valuable because different measures and referents provide different information about an organization’s functioning. As well, many commonly used measures, including accounting ratios, are highly past-focused. These indicators show stakeholders the end-results of past decisions, but do little to predict future firm performance. Strongly managed organizations must develop a deep understanding of what events or actions support strong(er) performance (i.e., increased product training for sales force leads to increased sales the following quarter), and then ensure these measure these as well.
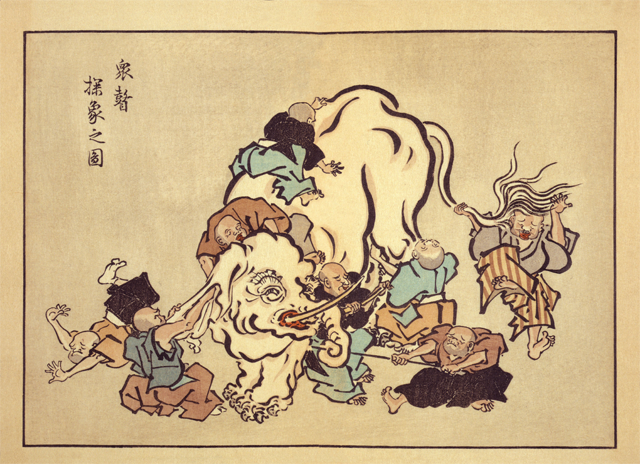
The parable of the blind men and the elephant—popularized in Western cultures through a poem by John Godfrey Saxe in the 19th century—is useful for understanding the complexity associated with measuring organizational performance. As the story goes, six blind men set out to “see” what an elephant was like. The first man touched the elephant’s side and believed the beast to be like a great wall. The second felt the tusks and thought elephants must be like spears. Feeling the trunk, the third man thought it was a type of snake. Feeling a limb, the fourth man thought it was like a tree trunk. The fifth, examining an ear, thought it was like a fan. The sixth, touching the tail, thought it was like a rope. If the men failed to communicate their different impressions they would have all been partially right, but wrong about what ultimately mattered.
Figure 2.5 Financial performance measures and referents for organizations and individuals
| Types of Measures | Key Measure for Organizations | Key Referent for Organizations | Key Measure for Individuals | Key Referent for Individuals |
|---|---|---|---|---|
| Liquidity measure: Helpful for understanding if obligations can be paid when due. | Current ratio (Current assets ÷ current liabilities) | A ratio of less than 1.0 suggests the firm does not have enough cash to pay its bills. | Cash in your checking account. | Do you have enough cash to cover your monthly debts? |
| Leverage measures: Helpful for understanding if debt level is too high. The term leverage refers to the extent to which borrowed money is used. | Debt-to-equity ratio | Competitors’ debt-to-equity ratios. The use of debt varies across industries. Auto companies, for example, tend to have high debt-to-equity because they must build massive factories. | Debt-to-income ratio (Monthly debt payments ÷ monthly income) | If you have a debt-to-income ratio higher than 40%, you may be on the verge of becoming a credit risk. |
| Profitability measures: Helpful for understanding how much profit, if any, is really being made. | Net income (income after taxes) | Last year’s net income. An increase shows the firm’s profits are moving in the right direction. | Net income (income after taxes) | Are you making enough money to cover your yearly expenses and save for retirement? |
This story parallels the challenge involved in understanding the multidimensional nature of organization performance because different measures and referents may tell a different part of the overall story about the organization’s performance. For example, the Fortune 500 list names the largest U.S. firms in terms of sales. These firms are generally not the strongest performers in terms of growth in stock price, however, in part because they are so big that making major improvements is difficult. During the late 1990s, a number of Internet-centred businesses enjoyed exceptional growth in sales and stock price but reported losses rather than profits. Many investors in these firms who simply fixated on a single performance measure—sales growth—absorbed heavy losses when the stock market’s attention turned to profits and the stock prices of these firms plummeted.
The number of performance measures and referents that are relevant for understanding an organization’s performance can be overwhelming, however. For example, a study of what performance metrics were used within restaurant organizations’ annual reports found that 788 different combinations of measures and referents were used within this one industry in a single year. Thus executives need to choose a rich yet limited set of performance measures and referents to focus on.
The Balanced Scorecard
To develop a more predictive set of organization performance measures, Professor Robert Kaplan and Professor David Norton of Harvard University developed a tool called the “balanced scorecard.” Using the scorecard helps managers resist the temptation to fixate on financial measures and instead monitor a diverse set of important measures (Figure 2.7 “Beyond Profits: Measuring Performance Using the Balanced Scorecard”). Indeed, the idea behind the framework is to provide a “balance” between financial measures and other measures that are important for understanding organizational activities that lead to sustained, long-term performance. The balanced scorecard recommends that managers gain an overview of the organization’s performance by tracking a small number of key measures that collectively reflect four dimensions:
Financial Measures
Financial measures of performance relate to organizational effectiveness and profits. Examples include financial ratios such as return on assets, return on equity, and return on investment. Other common financial measures include profits and stock price. Such measures help answer the key question “How do we look to shareholders?” Such measures have long been of interest to senior management and investors.
Financial performance measures are commonly articulated and emphasized within an organization’s annual report to shareholders. To provide context, such measures should be objective and be coupled with meaningful referents, such as the firm’s past performance. For example, Starbucks’s 2009 annual report highlights the firm’s performance in terms of net revenue, operating income, and cash flow over a five-year period.
Customer Measures
Customer measures of performance relate to customer attraction, satisfaction, and retention. These measures provide insight to the key question “How do customers see us?” Examples might include the number of new customers and the percentage of repeat customers.
Starbucks realizes the importance of repeat customers and has taken a number of steps to satisfy and to attract regular visitors to their stores. For example, Starbucks rewards regular customers with free drinks and offers all customers free Wi-Fi access. Starbucks also encourages repeat visits by providing cards with codes for free iTunes downloads. The featured songs change regularly, encouraging frequent repeat visits.
Internal Business Process Measures
Internal business process measures of performance relate to organizational efficiency. These measures help answer the key question “What must we excel at?” Examples include the time it takes to manufacture the organization’s good or deliver a service. The time it takes to create a new product and bring it to market is another example of this type of measure.
Organizations such as Starbucks realize the importance of such efficiency measures for the long-term success of its organization, and Starbucks carefully examines its processes with the goal of decreasing order fulfillment time. In one recent example, Starbucks efficiency experts challenged their employees to assemble a Mr. Potato Head to understand how work could be done more quickly. The aim of this exercise was to help Starbucks employees in general match the speed of the firm’s high performers, who boast an average time per order of twenty-five seconds.
One key aspect for organizations producing physical goods (as compared to services) are supply-chain management indicators. Both Walmart and GM are examples of the increased profits that can result from effective management of the supply chain through initiatives such as “just-in-time”’ supply-chain management. Of course, to reduce supply inventory, data must be both timely and accurate (or else you run out of key parts and the production line stops…). In the 1990s (pre-Internet) Walmart acquired their own satellite system that allowed them to collect sales by item and ordered replacement to restock their shelves every eight hours, while GM kept only enough tires for four hours of car assembly at any one time!
Learning and Growth Measures
Learning and growth measures of performance relate to the future. Such measures provide insight to tell the organization, “Can we continue to improve and create value?” Learning and growth measures focus on innovation and proceed with an understanding that strategies change over time. Consequently, developing new ways to add value will be needed as the organization continues to adapt to an evolving environment. An example of a learning and growth measure is the number of new skills learned by employees every year.
One way Starbucks encourages its employees to learn skills that may benefit both the firm and individuals in the future is through its tuition reimbursement program. Employees who have worked with Starbucks for more than a year are eligible. Starbucks hopes that the knowledge acquired while earning a college degree might provide employees with the skills needed to develop innovations that will benefit the company in the future. Another benefit of this program is that it helps Starbucks reward and retain high-achieving employees.
Measuring Performance Using the Triple Bottom Line
Ralph Waldo Emerson once noted, “Doing well is the result of doing good. That’s what capitalism is all about.” While the balanced scorecard provides a popular framework to help executives understand an organization’s performance, other frameworks highlight areas such as social responsibility. One such framework, the triple bottom line, emphasizes the three Ps of people (making sure that the actions of the organization are socially responsible), the planet (making sure organizations act in a way that promotes environmental sustainability), and traditional organization profits. This notion was introduced in the early 1980s but did not attract much attention until the late 1990s.
In the case of Starbucks, the firm has made clear the importance it attaches to the planet by creating an environmental mission statement (“Starbucks is committed to a role of environmental leadership in all facets of our business”) in addition to its overall mission. In terms of the “people” dimension of the triple bottom line, Starbucks strives to purchase coffee beans harvested by farmers who work under humane conditions and are paid reasonable wages. The firm works to be profitable as well, of course.
Key Takeaway
Organizational performance is a multidimensional concept, and wise managers rely on multiple measures of performance when gauging the success or failure of their organizations. The balanced scorecard provides a tool to help executives gain a general understanding of their organization’s current level of achievement across a set of four important dimensions. The triple bottom line provides another tool to help executives focus on performance targets beyond profits alone; this approach stresses the importance of social and environmental outcomes.
Exercises
- How might you apply the balanced scorecard framework to measure performance of your college or university?
- Identify a measurable example of each of the balanced scorecard dimensions other than the examples offered in this section.
- Identify a mission statement from an organization that emphasizes each of the elements of the triple bottom line.
References
Jargon, J. (2009, August 4). Latest Starbucks buzzword: “Lean” Japanese techniques. Wall Street Journal, p. A1.
Miller, C. (2010, June 15). Aiming at rivals, Starbucks will offer free Wi-Fi. New York Times. Section B, p. 1.
Short, J. C., & Palmer, T. B. (2003). Organizational performance referents: An empirical examination of their content and influences. Organizational Behaviour and Human Decision Processes, 90, 209–224.
Starbucks Corporation. (2014). Our Starbucks mission statement. Retrieved from http://www.starbucks.com/about-us/company-information/mission-statement
Image descriptions
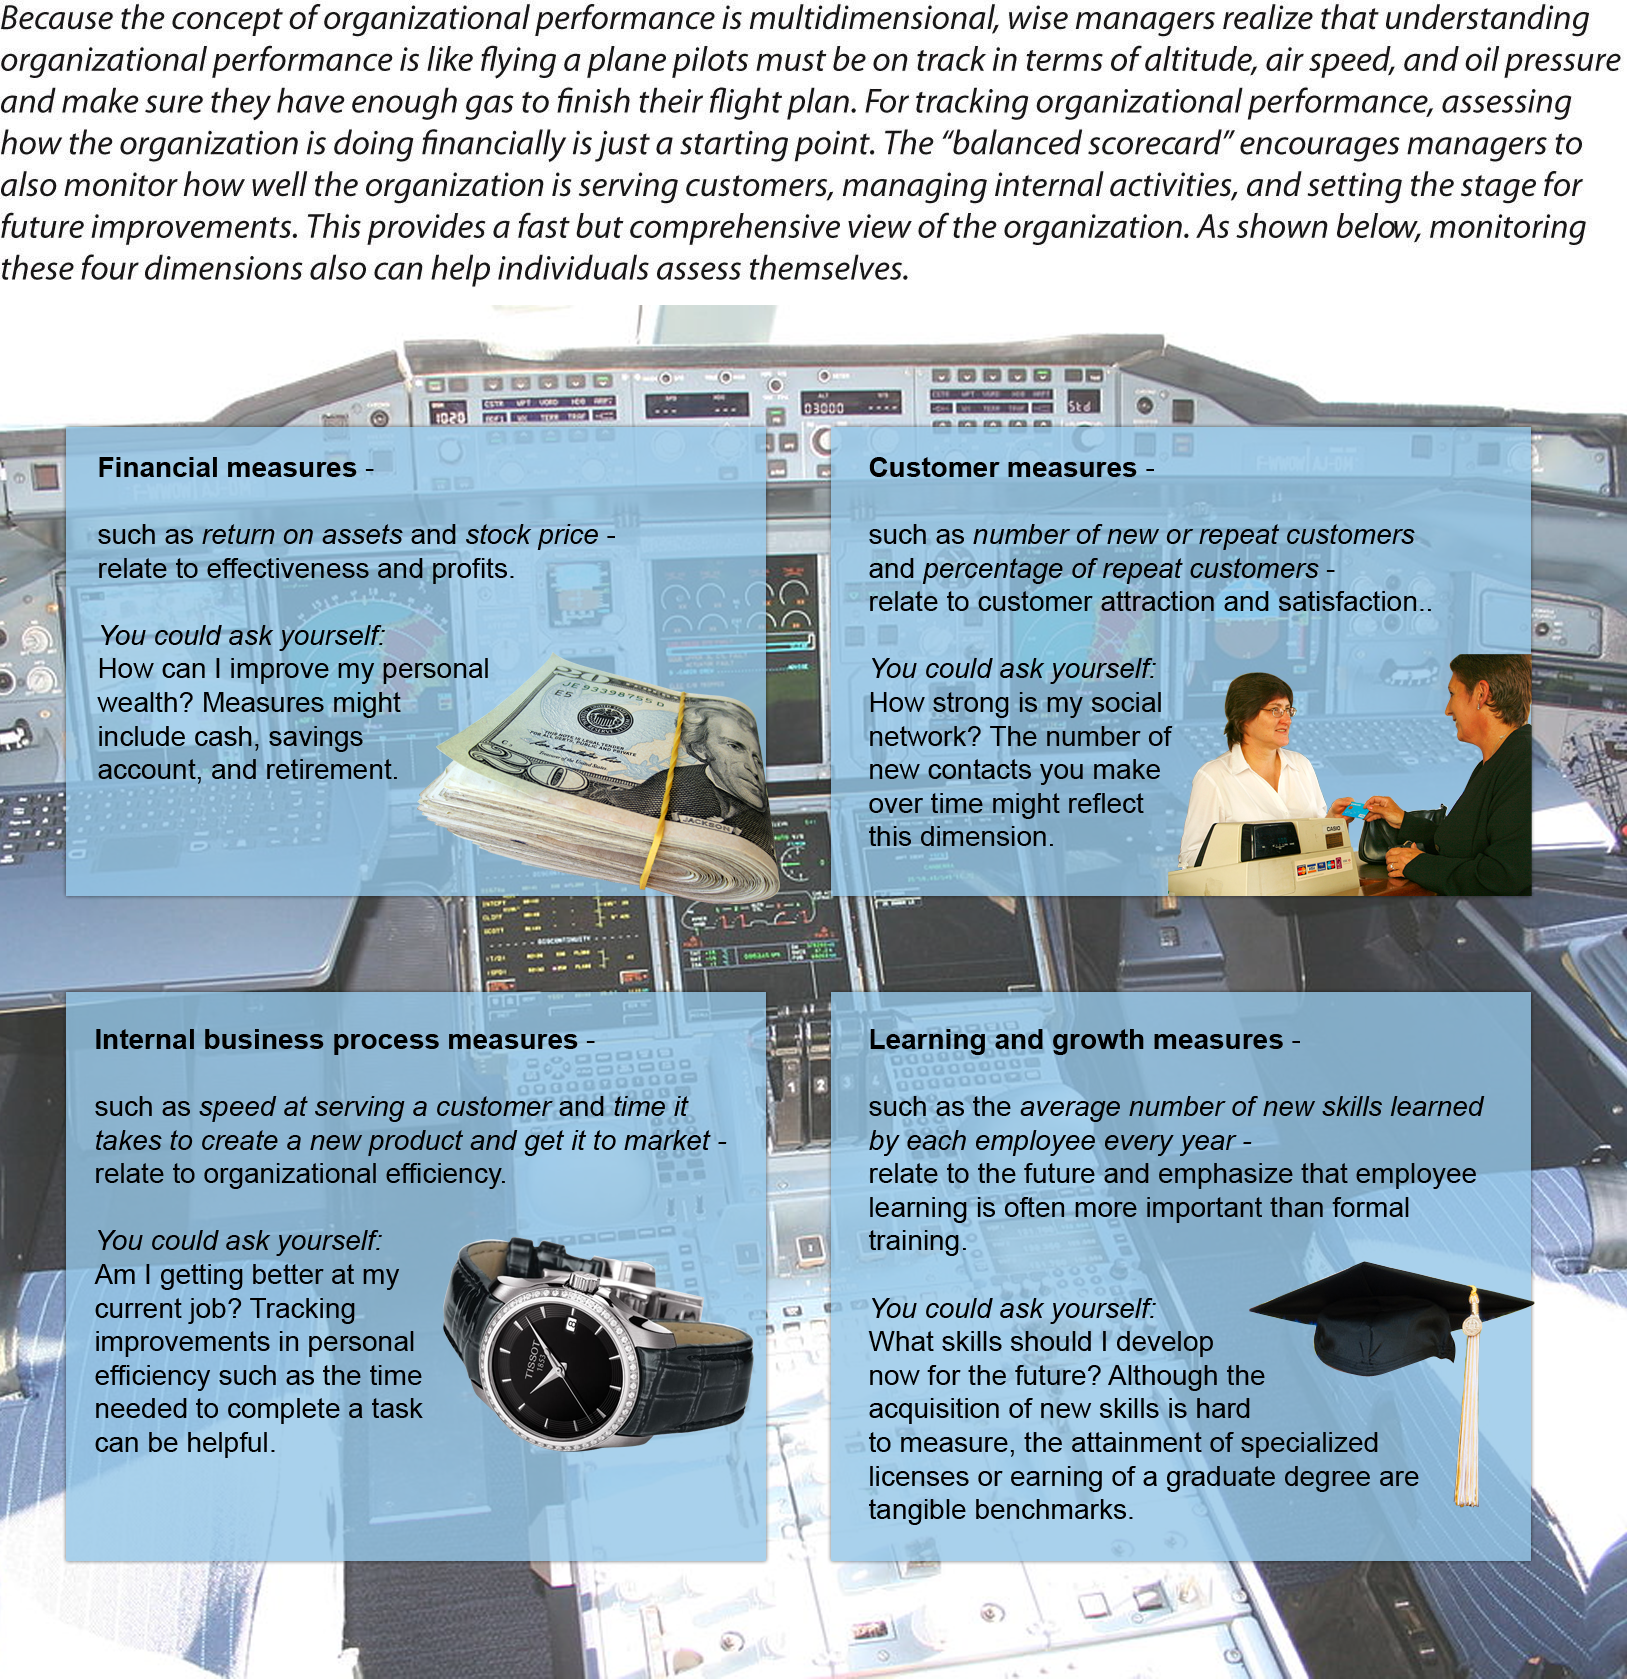
Figure 2.7 image description: Beyond Profits: Measuring Performance Using the Balanced Scorecard.
Because the concept of organizational performance is multidimensional, wise managers realize that understanding organizational performance is like flying a plane. Pilots must be on track in terms of altitude, air speed, and oil pressure and make sure they have enough gas to finish their flight plan. For tracking organizational performance, assessing how the organization is doing financially is just a starting point. The “balanced scorecard” encourages managers to also monitor how well the organization is serving customers, managing internal activities, and setting the stage for future improvements. This provides a fast but comprehensive view of the organization. As shown below, monitoring these four dimensions also can help individuals assess themselves.
- Financial measures: such as return on assets and stock price – relate to effectiveness and profits. You could ask yourself: How can I improve my personal wealth? Measures might include cash, savings account, and retirement.
- Customer measures: such as number or new repeat customers and percentage of repeat customers – relate to customer attraction and satisfaction. You could ask yourself: how strong is my social network? The number of new contacts you make overtime might reflect this dimension.
- Internal business process measures – such as speed at serving a customer and time it takes to create a new product and get it to the market – relate to organizational efficiency. You could ask yourself: am I getting better at my current job? Tracking improvements in personal efficiency such as the time needed to complete a task can helpful.
- Learning and growth measures – such as the average number of new skills learned by each employee every year – relate to the future and emphasize that employee learning is often more important than formal training. You could ask yourself: what skills should I develop now for the future? Although the acquisition of new skills is hard to measure, the attainment of specialized licenses or earning of a graduate degree are tangible benchmarks.
Media Attributions
- Blind Monks Examining an Elephant © Hanabusa Itcho is licensed under a Public Domain license
- Figure 2.7: Attribution information for all included images is in the chapter conclusion.
An approach to assessing performance that emphasizes the concerns of people (social responsibility) and the planet (environmental sustainability) in addition to profit.
