Chapter 8: Selecting Corporate-Level Strategies
Portfolio Planning and Corporate-Level Strategy
Learning Objectives
- Understand why a firm would want to use portfolio planning.
- Be able to explain the limitations of portfolio planning.
Executives in charge of firms that are involved in many different businesses must figure out how to manage such portfolios. General Electric (GE), for example, competes in a very wide variety of industries, including financial services, insurance, television, theme parks, electricity generation, lightbulbs, robotics, medical equipment, railroad locomotives, and aircraft jet engines. When leading a company such as GE, executives must decide which business units to grow, which ones to shrink, and which ones to abandon.
Portfolio planning can be a useful tool. Portfolio planning is a process that helps executives assess their firms’ prospects for success within each of its industries, offers suggestions about what to do within each industry, and provides ideas for how to allocate resources across industries. Portfolio planning first gained widespread attention in the 1970s, and it remains a popular tool among executives today.
The Boston Consulting Group (BCG) Matrix
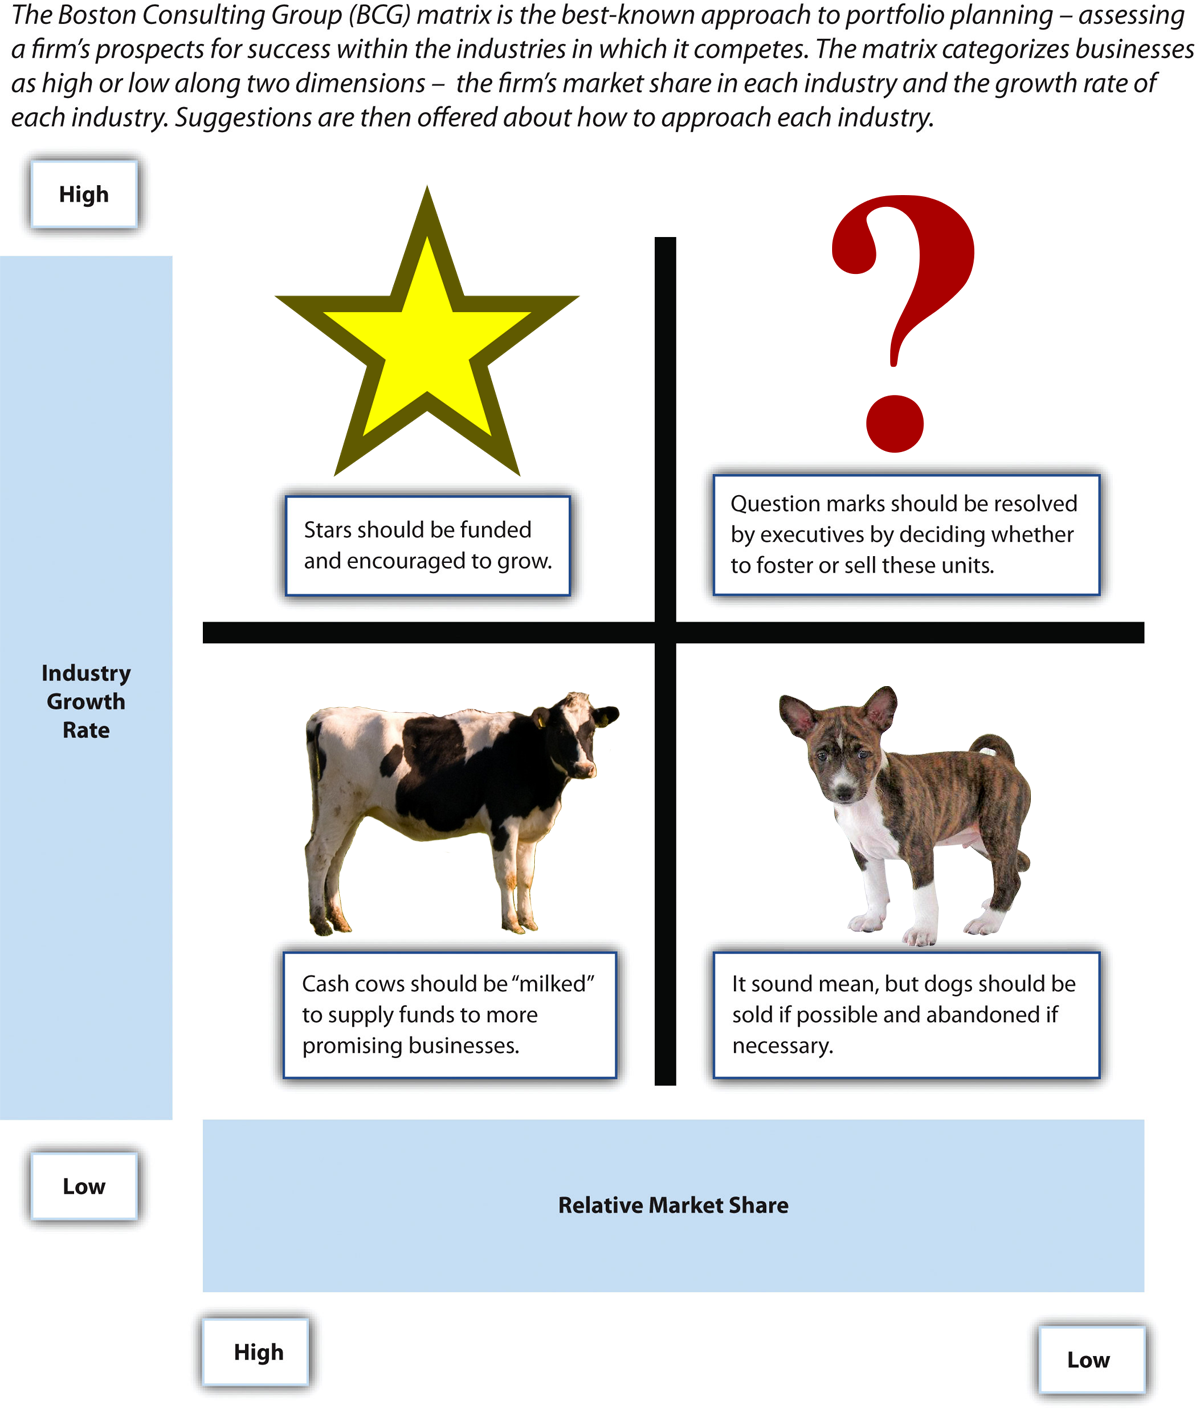
The Boston Consulting Group (BCG) matrix is the best-known approach to portfolio planning (Figure 8.20 “The Boston Consulting Group (BCG) Matrix”). Using the matrix requires that each businesses unit owned by a firm be categorized along two dimensions: its share of the market and the growth rate of its industry. High market share units within slow-growing industries are called cash cows. Because their industries have bleak growth prospects, profits from cash cows should not be invested back into cash cows but rather diverted to more promising growth businesses. This is not to suggest that cash cows are not to be carefully managed to ensure that the maximum total profits are not “harvested,” just that investments decisions must be grounded in a different set of values for cash cows.
Low-market-share units within slow-growing industries are called dogs. These units are good candidates for divestment because of the low return on investment in maintaining a market presence. High-market-share units within fast-growing industries are called stars. These units have bright prospects and thus are good candidates for growth and form the basis of the future success of the firm. Finally, low-market-share units within fast-growing industries are called question marks. Executives must decide whether to attempt to build these units into stars or to divest them.

The BCG matrix is just one portfolio planning technique. A different technique, developed with the help of a leading consulting firm for GE, is the attractiveness-strength matrix, which also examines diverse activities. This planning approach involves rating each of a firm’s businesses in terms of the attractiveness of the industry and the firm’s strength within the industry. Each dimension is divided into three categories, resulting in nine boxes. Each of these boxes has a set of recommendations associated with it. (Internet Center for Management and Business Administration Inc, 2009-2010).

Limitations to Portfolio Planning
Although portfolio planning is a useful tool, this tool has important limitations. First, portfolio planning oversimplifies the reality of competition by focusing on just two dimensions when analyzing a company’s operations within an industry. Many dimensions are important to consider before making strategic decisions, not just two. Second, portfolio planning can create motivational problems among employees. For example, if workers know that their firm’s executives believe in the BCG matrix and that their subsidiary is classified as a dog, then they may reduce their effort and motivation. Similarly, workers within cash cow units could become dismayed once they realize that the profits that they help create will be diverted to boost other areas of the firm. Third, portfolio planning does not help identify new opportunities. Because this tool only deals with existing businesses, it cannot reveal what new industries a firm should consider entering.
Key Takeaways
- Portfolio planning is a useful tool for analyzing a firm’s operations, but this tool has limitations. The BCG matrix is one of the most widely used approaches to portfolio planning.
Exercises
- Is market share a good dimension to use when analyzing the prospects of a business? Why or why not?
- What might executives do to keep employees within dog units motivated and focused on their jobs?
References
Internet Center for Management and Business Administration Inc. (2009-2010). GE/McKinsey Matrix. Retrieved from http://www.quickmba.com/strategy/matrix/ge-mckinsey/
The Boston Consulting Group, Inc. 1973 Reprint No. 135. The Experience Curve – Reviewed. IV. The Growth Share Matrix or the Product Portfolio. Retrieved from http://www.bcg.com/documents/file13904.pdf
Image description
Figure 8.20 image description: The Boston Consulting Group (BCG) Matrix
The Boston Consulting Group (BCG) matrix is the best-known approach to portfolio planning – assessing a firm’s prospects for success within the industries in which it competes. The matrix categorizes businesses as high or low along two dimensions — the firm’s market share in each industry and the growth rate of each industry. Suggestions are then offered about how to approach each industry.
| High relative market share | Low relative market share | |
|---|---|---|
| High industry growth rate | Stars should be funded and encouraged to grow. | Question marks should be resolved by executives by deciding whether to foster or sell these units. |
| Low industry growth rate | Cash cows should be “milked” to supply funds to more promising business. | It sounds mean but dogs should be sold if possible and abandoned if necessary. |
Media Attributions
- Cara de quem caiu do caminhão… © Anderson Nascimento is licensed under a CC BY (Attribution) license
- Figure 8.20: Attribution information for all included images is in the chapter conclusion.
A process that helps executives make decisions involving their firms’ various industries.
High market share units within slow-growing industries.
Low-market-share units within slow-growing industries.
High-market-share units within fast-growing industries.
Low-market-share units within fast-growing industries.

