Chapter 3: Graphing
3.4 Graphing Linear Equations
There are two common procedures that are used to draw the line represented by a linear equation. The first one is called the slope-intercept method and involves using the slope and intercept given in the equation.
If the equation is given in the form [latex]y = mx + b[/latex], then [latex]m[/latex] gives the rise over run value and the value [latex]b[/latex] gives the point where the line crosses the [latex]y[/latex]-axis, also known as the [latex]y[/latex]-intercept.
Example 3.4.1
Given the following equations, identify the slope and the [latex]y[/latex]-intercept.
- [latex]\begin{array}{lll} y = 2x - 3\hspace{0.14in} & \text{Slope }(m)=2\hspace{0.1in}&y\text{-intercept } (b)=-3 \end{array}[/latex]
- [latex]\begin{array}{lll} y = \dfrac{1}{2}x - 1\hspace{0.08in} & \text{Slope }(m)=\dfrac{1}{2}\hspace{0.1in}&y\text{-intercept } (b)=-1 \end{array}[/latex]
- [latex]\begin{array}{lll} y = -3x + 4 & \text{Slope }(m)=-3 &y\text{-intercept } (b)=4 \end{array}[/latex]
- [latex]\begin{array}{lll} y = \dfrac{2}{3}x\hspace{0.34in} & \text{Slope }(m)=\dfrac{2}{3}\hspace{0.1in} &y\text{-intercept } (b)=0 \end{array}[/latex]
When graphing a linear equation using the slope-intercept method, start by using the value given for the [latex]y[/latex]-intercept. After this point is marked, then identify other points using the slope.
This is shown in the following example.
Example 3.4.2
Graph the equation [latex]y = 2x - 3[/latex].
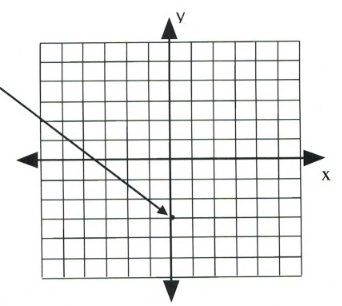
First, place a dot on the [latex]y[/latex]-intercept, [latex]y = -3[/latex], which is placed on the coordinate [latex](0, -3).[/latex]
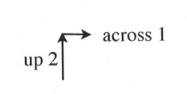
Now, place the next dot using the slope of 2.
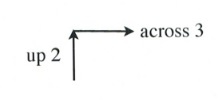
A slope of 2 means that the line rises 2 for every 1 across.
Simply, [latex]m = 2[/latex] is the same as [latex]m = \dfrac{2}{1}[/latex], where [latex]\Delta y = 2[/latex] and [latex]\Delta x = 1[/latex].
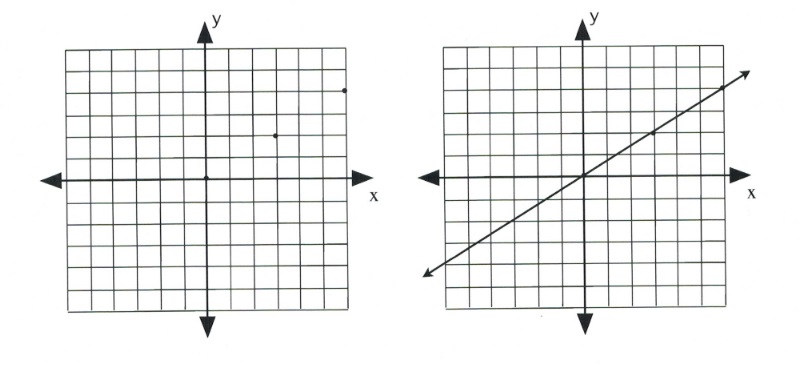
Placing these points on the graph becomes a simple counting exercise, which is done as follows:
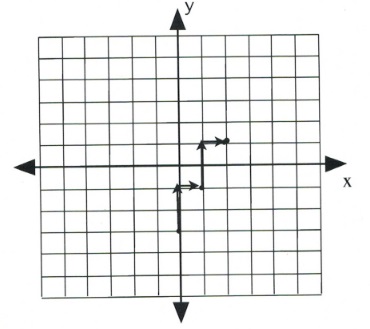
Once several dots have been drawn, draw a line through them, like so:
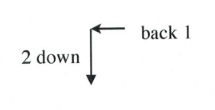
Note that dots can also be drawn in the reverse of what has been drawn here.
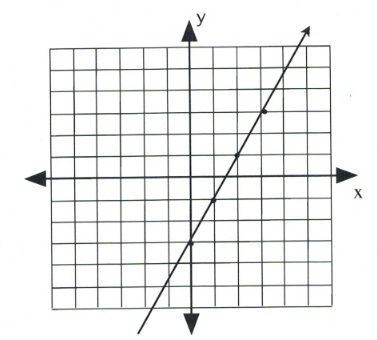
Slope is 2 when rise over run is [latex]\dfrac{2}{1}[/latex] or [latex]\dfrac{-2}{-1}[/latex], which would be drawn as follows:
Example 3.4.3
Graph the equation [latex]y = \dfrac{2}{3}x[/latex].
First, place a dot on the [latex]y[/latex]-intercept, [latex](0, 0)[/latex].
Now, place the dots according to the slope, [latex]\dfrac{2}{3}[/latex].
This will generate the following set of dots on the graph. All that remains is to draw a line through the dots.
The second method of drawing lines represented by linear equations and functions is to identify the two intercepts of the linear equation. Specifically, find [latex]x[/latex] when [latex]y = 0[/latex] and find [latex]y[/latex] when [latex]x = 0[/latex].
Example 3.4.4
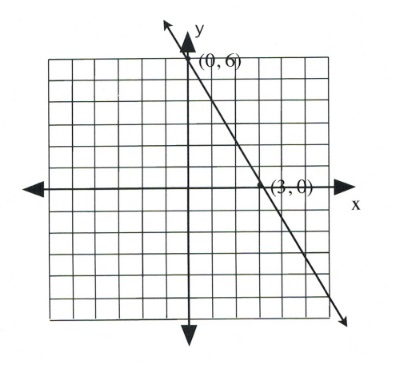
Graph the equation [latex]2x + y = 6[/latex].
To find the first coordinate, choose [latex]x = 0[/latex].
This yields:
[latex]\begin{array}{lllll} 2(0)&+&y&=&6 \\ &&y&=&6 \end{array}[/latex]
Coordinate is [latex](0, 6)[/latex].
Now choose [latex]y = 0[/latex].
This yields:
[latex]\begin{array}{llrll} 2x&+&0&=&6 \\ &&2x&=&6 \\ &&x&=&\frac{6}{2} \text{ or } 3 \end{array}[/latex]
Coordinate is [latex](3, 0)[/latex].
Draw these coordinates on the graph and draw a line through them.
Example 3.4.5
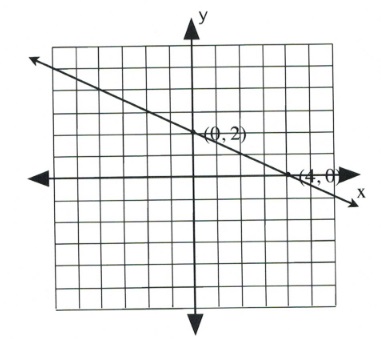
Graph the equation [latex]x + 2y = 4[/latex].
To find the first coordinate, choose [latex]x = 0[/latex].
This yields:
[latex]\begin{array}{llrll} (0)&+&2y&=&4 \\ &&y&=&\frac{4}{2} \text{ or } 2 \end{array}[/latex]
Coordinate is [latex](0, 2)[/latex].
Now choose [latex]y = 0[/latex].
This yields:
[latex]\begin{array}{llrll} x&+&2(0)&=&4 \\ &&x&=&4 \end{array}[/latex]
Coordinate is [latex](4, 0)[/latex].
Draw these coordinates on the graph and draw a line through them.
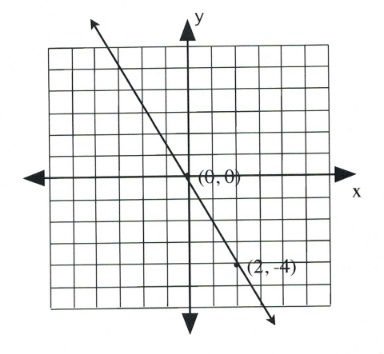
Example 3.4.6
Graph the equation [latex]2x + y = 0[/latex].
To find the first coordinate, choose [latex]x = 0[/latex].
This yields:
[latex]\begin{array}{llrll} 2(0)&+&y&=&0 \\ &&y&=&0 \end{array}[/latex]
Coordinate is [latex](0, 0)[/latex].
Since the intercept is [latex](0, 0)[/latex], finding the other intercept yields the same coordinate. In this case, choose any value of convenience.
Choose [latex]x = 2[/latex].
This yields:
[latex]\begin{array}{rlrlr} 2(2)&+&y&=&0 \\ 4&+&y&=&0 \\ -4&&&&-4 \\ \hline &&y&=&-4 \end{array}[/latex]
Coordinate is [latex](2, -4)[/latex].
Draw these coordinates on the graph and draw a line through them.
Questions
For questions 1 to 10, sketch each linear equation using the slope-intercept method.
- [latex]y = -\dfrac{1}{4}x - 3[/latex]
- [latex]y = \dfrac{3}{2}x - 1[/latex]
- [latex]y = -\dfrac{5}{4}x - 4[/latex]
- [latex]y = -\dfrac{3}{5}x + 1[/latex]
- [latex]y = -\dfrac{4}{3}x + 2[/latex]
- [latex]y = \dfrac{5}{3}x + 4[/latex]
- [latex]y = \dfrac{3}{2}x - 5[/latex]
- [latex]y = -\dfrac{2}{3}x - 2[/latex]
- [latex]y = -\dfrac{4}{5}x - 3[/latex]
- [latex]y = \dfrac{1}{2}x[/latex]
For questions 11 to 20, sketch each linear equation using the [latex]x\text{-}[/latex] and [latex]y[/latex]-intercepts.
- [latex]x + 4y = -4[/latex]
- [latex]2x - y = 2[/latex]
- [latex]2x + y = 4[/latex]
- [latex]3x + 4y = 12[/latex]
- [latex]2x - y = 2[/latex]
- [latex]4x + 3y = -12[/latex]
- [latex]x + y = -5[/latex]
- [latex]3x + 2y = 6[/latex]
- [latex]x - y = -2[/latex]
- [latex]4x - y = -4[/latex]
For questions 21 to 28, sketch each linear equation using any method.
- [latex]y = -\dfrac{1}{2}x + 3[/latex]
- [latex]y = 2x - 1[/latex]
- [latex]y = -\dfrac{5}{4}x[/latex]
- [latex]y = -3x + 2[/latex]
- [latex]y = -\dfrac{3}{2}x + 1[/latex]
- [latex]y = \dfrac{1}{3}x - 3[/latex]
- [latex]y = \dfrac{3}{2}x + 2[/latex]
- [latex]y = 2x - 2[/latex]
For questions 29 to 40, reduce and sketch each linear equation using any method.
- [latex]y + 3 = -\dfrac{4}{5}x + 3[/latex]
- [latex]y - 4 = \dfrac{1}{2}x[/latex]
- [latex]x + 5y = -3 + 2y[/latex]
- [latex]3x - y = 4 + x - 2y[/latex]
- [latex]4x + 3y = 5 (x + y)[/latex]
- [latex]3x + 4y = 12 - 2y[/latex]
- [latex]2x - y = 2 - y \text{ (tricky)}[/latex]
- [latex]7x + 3y = 2(2x + 2y) + 6[/latex]
- [latex]x + y = -2x + 3[/latex]
- [latex]3x + 4y = 3y + 6[/latex]
- [latex]2(x + y) = -3(x + y) + 5[/latex]
- [latex]9x - y = 4x + 5[/latex]
