Chapter 3: Graphing
3.3 Slopes and Their Graphs
Another important property of any line or linear function is slope. Slope is a measure of steepness and indicates in some situations how fast something is changing—specifically, its rate of change. A line with a large slope, such as 10, is very steep. A line with a small slope, such as [latex]\dfrac{1}{10},[/latex] is very flat or nearly level. Lines that rise from left to right are called positive slopes and lines that sink are called negative slopes. Slope can also be used to describe the direction of a line. A line that goes up as it moves from from left to right is described as having a positive slope whereas a line that goes downward has a negative slope. Slope, therefore, will define a line as rising or falling.
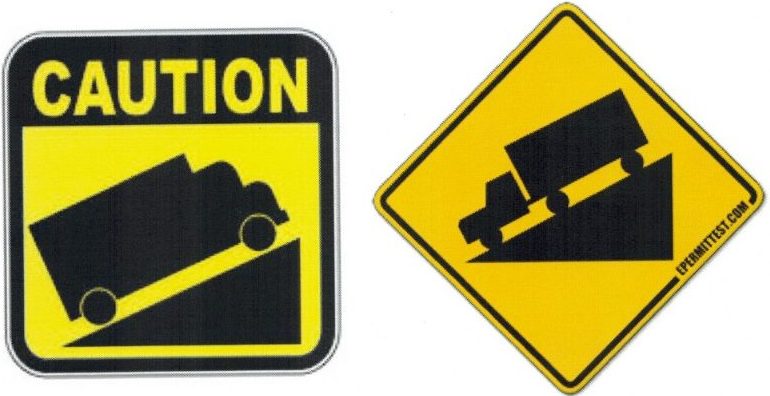
Slopes in real life have significance. For instance, roads with slopes that are potentially dangerous often carry warning signs. For steep slopes that are rising, extra slow moving lanes are generally provided for large trucks. For roads that have steep down slopes, runaway lanes are often provided for vehicles that lose their ability to brake.
When quantifying slope, use the measure of the rise of the line divided by its run. The symbol that represents slope is the letter [latex]m,[/latex] which has unknown origins. Its first recorded usage is in an 1844 text by Matthew O’Brian, “A Treatise on Plane Co-Ordinate Geometry,”[1] which was quickly followed by George Salmon's “A Treatise on Conic Sections” (1848), in which he used [latex]m[/latex] in the equation [latex]y = mx + b.[/latex]
[latex]\text{slope }=\dfrac{\text{rise of the line}}{\text{run of the line}}[/latex]
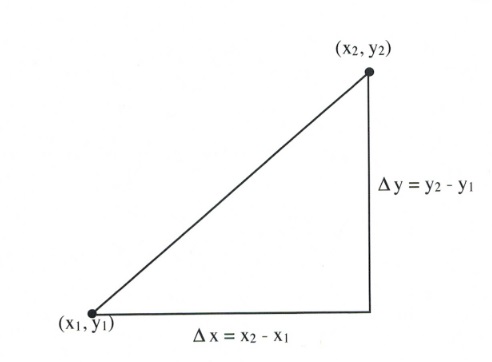
Since the rise of a line is shown by the change in the [latex]y[/latex]-value and the run is shown by the change in the [latex]x[/latex]-value, this equation is shortened to:
[latex]m =\dfrac{\Delta y}{\Delta x},\text{ where }\Delta\text{ is the symbol for change and means final value } - \text{ initial value}[/latex]
This equation is often expanded to:
[latex]m=\dfrac{y_2-y_1}{x_2-x_1}[/latex]
Example 3.3.1
Find the slope of the following line.
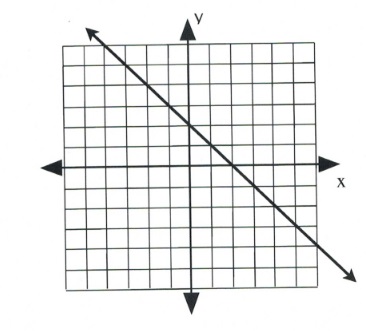
First, choose two points on the line on this graph. Any points can be chosen, but they should fall on one of the corner grids. These are labelled [latex](x_1, y_1)[/latex] and [latex](x_2, y_2).[/latex]
To find the slope of this line, consider the rise, or vertical change, and the run, or horizontal change. Observe in this example that the [latex]\Delta y[/latex]-value (the rise) goes from 4 to −2.
Therefore, [latex]\Delta y = y_2 - y_1[/latex], or (4 − −2), which equals (4 + 2), or 6.
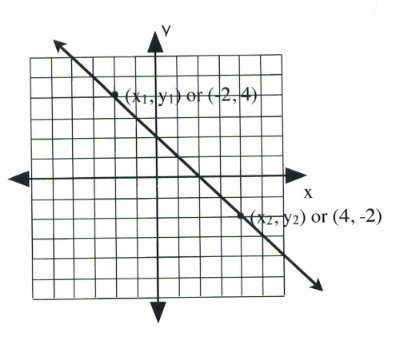
The [latex]\Delta x[/latex]-value (the run) goes from −2 to 4.
Therefore, [latex]\Delta x = x_2 - x_1[/latex], or (−2 − 4), which equals (−2 + −4), or −6.
This means the slope of this line is [latex]m=\dfrac{\Delta y}{\Delta x}[/latex], or [latex]\dfrac{6}{-6}[/latex], or −1.
[latex]m = -1[/latex]
Example 3.3.2
Find the slope of the following line.
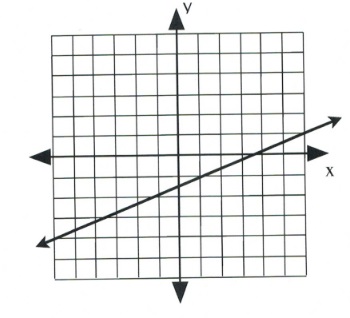
First, choose two points on the line on this graph. Any points can be chosen, but to fall on a corner grid, they should be on opposite sides of the graph. These are [latex](x_1, y_1)[/latex] and [latex](x_2, y_2).[/latex]
To find the slope of this line, consider the rise, or vertical change, and the run, or horizontal change. Observe in this example that the [latex]\Delta y[/latex]-value (the rise) goes from −4 to 1.
Therefore, [latex]\Delta y = y_2 - y_1[/latex], or (1 − −4), which equals 5.
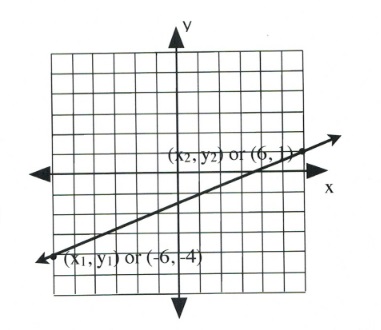
The [latex]\Delta x[/latex]-value (the run) goes from −6 to 6.
Therefore, [latex]\Delta x = x_2 - x_1[/latex] or (6 − −6), which equals 12.
This means the slope of this line is [latex]m=\dfrac{\Delta y}{\Delta x}[/latex], or [latex]\dfrac{5}{12}[/latex], which cannot be further simplified.
[latex]m = \dfrac{5}{12}[/latex]
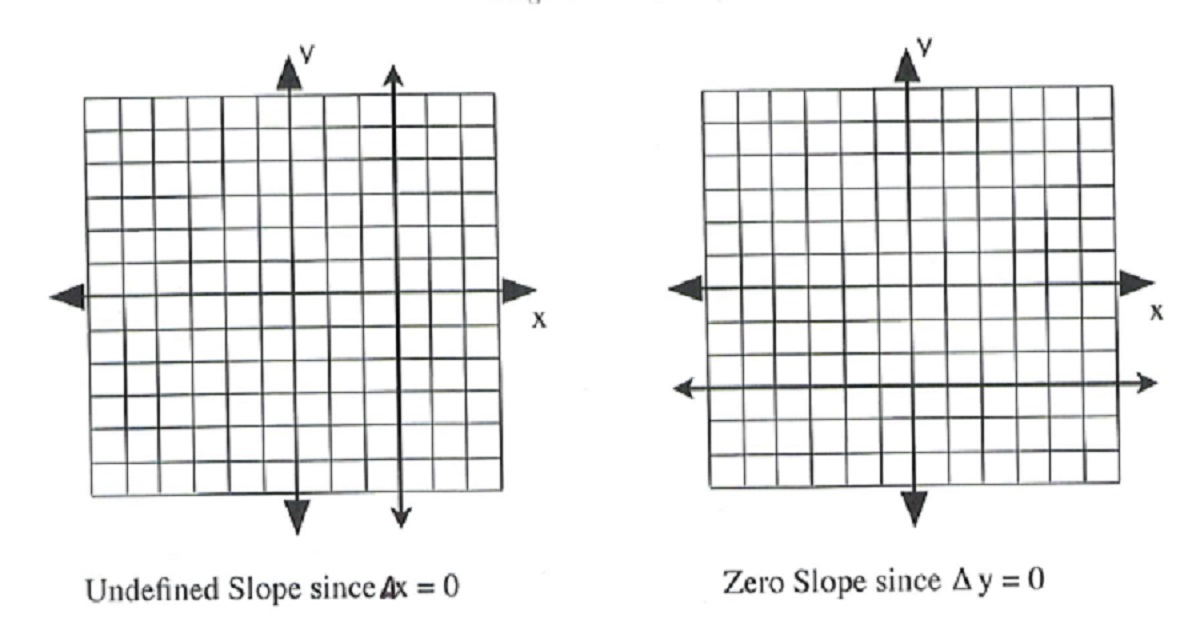
There are two special lines that have unique slopes that must be noted: lines with slopes equal to zero and slopes that are undefined.
Undefined slopes arise when the line on the graph is vertical, going straight up and down. In this case, [latex]\Delta x=0,[/latex] which means that zero is divided by while calculating the slope, which makes it undefined.
Zero slopes are flat, horizontal lines that do not rise or fall; therefore, [latex]\Delta y=0.[/latex] In this case, the slope is simply 0.
Most often, the slope of the line must be found using data points rather than graphs. In this case, two data points are generally given, and the slope [latex]m[/latex] is found by dividing [latex]\Delta y[/latex] by [latex]\Delta x.[/latex] This is usually done using the expanded slope equation of:
[latex]m=\dfrac{y_2-y_1}{x_2-x_1}[/latex]
Example 3.3.3
Find the slope of a line that would connect the data points [latex](-4, 3)[/latex] and [latex](2, -9)[/latex].
Choose Point 1 to be [latex](-4, 3)[/latex] and Point 2 to be [latex](2, -9)[/latex].
[latex]\begin{array}{l} m=\dfrac{y_2-y_1}{x_2-x_1} \\ \\ m=\dfrac{-9-3}{2--4} \\ \\ m=\dfrac{-12}{6} \text{ or } -2 \end{array}[/latex]
Example 3.3.4
Find the slope of a line that would connect the data points [latex](-5, 3)[/latex] and [latex](2, 3)[/latex].
Choose Point 1 to be [latex](-5, 3)[/latex] and Point 2 to be [latex](2, 3)[/latex].
[latex]\begin{array}{l} m=\dfrac{y_2-y_1}{x_2-x_1} \\ \\ m=\dfrac{3-3}{2--5} \\ \\ m=\dfrac{0}{7} \text{ or } 0 \end{array}[/latex]
This is an example of a flat, horizontal line.
Example 3.3.5
Find the slope of a line that would connect the data points [latex](4, 3)[/latex] and [latex](4, -5)[/latex].
Choose Point 1 to be [latex](4, 3)[/latex] and Point 2 to be [latex](4, -5)[/latex].
[latex]\begin{array}{l} m=\dfrac{y_2-y_1}{x_2-x_1} \\ \\ m=\dfrac{-5-3}{4-4} \\ \\ m=\dfrac{-8}{0} \text{ or undefined} \end{array}[/latex]
This is a vertical line.
Example 3.3.6
Find the slope of a line that would connect the data points [latex](-4, -3)[/latex] and [latex](2, 6)[/latex].
Choose Point 1 to be [latex](-4, -3)[/latex] and Point 2 to be [latex](2, 6)[/latex].
[latex]\begin{array}{l} m=\dfrac{y_2-y_1}{x_2-x_1} \\ \\ m=\dfrac{6--3}{2--4} \\ \\ m=\dfrac{9}{6} \text{ or } \dfrac{3}{2} \end{array}[/latex]
Questions
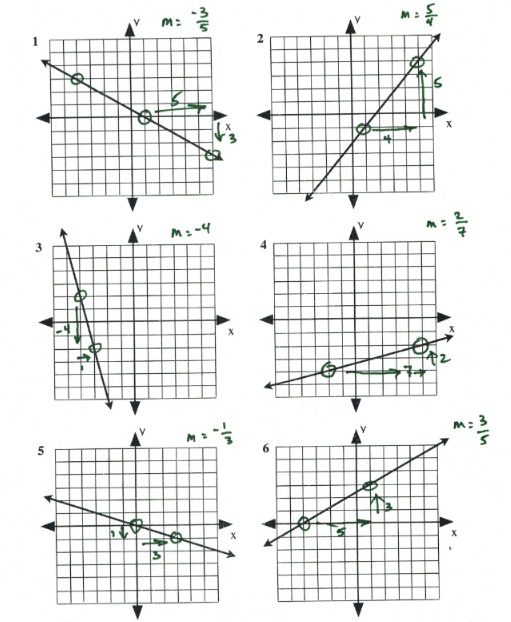
For questions 1 to 6, find the slope of each line shown on the graph.
For questions 7 to 26, find the slope of the line that would connect each pair of points.
- (2, 10), (−2, 15)
- (1, 2), (−6, −12)
- (−5, 10), (0, 0)
- (2, −2), (7, 8)
- (4, 6), (−8, −10)
- (−3, 6), (9, −6)
- (−2 −4), (10, −4)
- (3, 5), (2, 0)
- (−4, 4), (−6, 8)
- (9, −6), (−7, −7)
- (2, −9), (6, 4)
- (−6, 2), (5, 0)
- (−5, 0), (−5, 0)
- (8, 11), (−3, −13)
- (−7, 9), (1, −7)
- (1, −2), (1, 7)
- (7, −4), (−8, −9)
- (−8, −5), (4, −3)
- (−5, 7), (−8, 4)
- (9, 5), (5, 1)
- Derivation of Slope: https://services.math.duke.edu//education/webfeats/Slope/Slopederiv.html ↵

