Chapter 18 Geology of the Oceans
18.4 Ocean Water
As everyone knows, seawater is salty. It is that way because the river water that flows into the oceans contains small amounts of dissolved ions, and for the most part, the water that comes out of the oceans is the pure water that evaporates from the surface. The salts of the ocean (dominated by sodium, chlorine, and sulphur) (Figure 18.12) are there because they are very soluble and they aren’t consumed by biological processes (most of the calcium, for example, is used by organisms to make carbonate minerals). If salts are always going into the ocean, and never coming out, one might assume that the oceans have been continuously getting saltier over geological time. In fact this appears not to be the case. There is geological evidence that Earth’s oceans became salty early during the Archaean, and that at times in the past, they have been at least half again as salty as they are now. This implies that there must be a mechanism to remove salt from the oceans, and that mechanism is the isolation of some parts of the ocean into seas (such as the Mediterranean) and the eventual evaporation of those seas to create salt beds that become part of the crust. The Middle Devonian Prairie Evaporite Formation of Saskatchewan and Manitoba is a good example of this.
![Figure 18.12 The proportions (by weight) of the major dissolved elements in ocean water [SE]](http://opentextbc.ca/geology/wp-content/uploads/sites/110/2015/08/proportions-of-the-major-dissolved-elements-in-ocean-water.png)
The average salinity of the oceans is 35 g of salt per litre of water, but there are significant regional variations in this value, as shown in Figure 18.13. Ocean water is least salty (around 31 g/L) in the Arctic, and also in several places where large rivers flow in (e.g., the Ganges/Brahmaputra and Mekong Rivers in southeast Asia, and the Yellow and Yangtze Rivers in China). Ocean water is most salty (over 37 g/L) in some restricted seas in hot dry regions, such as the Mediterranean and Red Seas. You might be surprised to know that, in spite of some massive rivers flowing into it (such as the Nile and the Danube), water does not flow out of the Mediterranean Sea into the Atlantic. There is so much evaporation happening in the Mediterranean basin that water flows into it from the Atlantic, through the Strait of Gibraltar.
In the open ocean, salinities are elevated at lower latitudes because this is where most evaporation takes place. The highest salinities are in the subtropical parts of the Atlantic, especially north of the equator. The northern Atlantic is much more saline than the north Pacific because the Gulf Stream current brings a massive amount of salty water from the tropical Atlantic and the Caribbean to the region around Britain, Iceland, and Scandinavia. The salinity in the Norwegian Sea (between Norway and Iceland) is substantially higher than that in other polar areas.
![Figure 18.13 The distribution of salinity in Earth’s oceans and major seas [https://upload.wikimedia.org/wikipedia/commons/d/d5/WOA09_sea-surf_SAL_AYool.png]](http://opentextbc.ca/geology/wp-content/uploads/sites/110/2015/08/distribution-of-salinity-in-Earth’s-oceans.png)
Exercises
Exercise 18.4 Salt Chuck
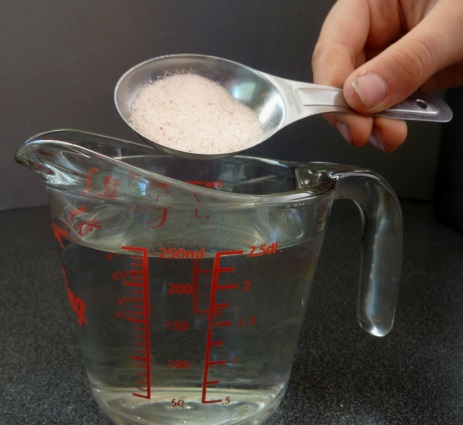 How salty is the sea? If you’ve ever swum in the ocean, you’ve probably tasted it. To understand how salty the sea is, start with 250 mL of water (1 cup). There is 35 g of salt in 1 L of seawater so in 250 mL (1/4 litre) there is 35/4 = 8.75 or ~9 g of salt. This is just short of 2 teaspoons, so it would be close enough to add 2 level teaspoons of salt to the cup of water. Then stir until it’s dissolved. Have a taste!
Of course, if you used normal refined table salt, then what you added was almost pure NaCl. To get the real taste of seawater you would want to use some evaporated seawater salt (a.k.a. sea salt), which has a few percent of magnesium, sulphur, and calcium plus some trace elements.
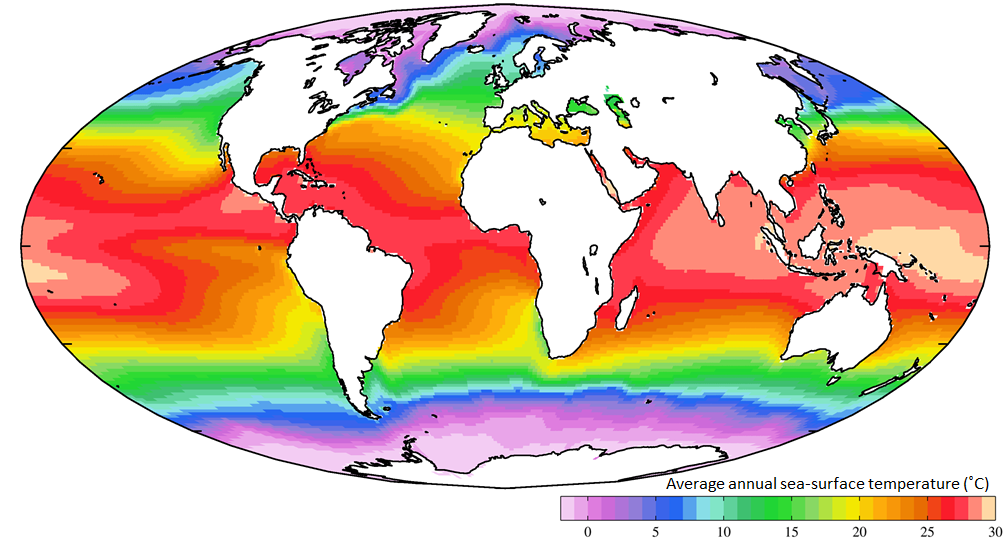
Not unexpectedly, the oceans are warmest near the equator — typically 25° to 30°C — and coldest near the poles — around 0°C (Figure 18.14). (Sea water will remain unfrozen down to about -2°C.) At southern Canadian latitudes, average annual water temperatures are in the 10° to 15°C range on the west coast and in the 5° to 10°C range on the east coast. Variations in sea-surface temperatures (SST) are related to redistribution of water by ocean currents, as we’ll see below. A good example of that is the plume of warm Gulf Stream water that extends across the northern Atlantic. St. John’s, Newfoundland, and Brittany in France are at about the same latitude (47.5° N), but the average SST in St. John’s is a frigid 3°C, while that in Brittany is a reasonably comfortable 15°C.
Currents in the open ocean are created by wind moving across the water and by density differences related to temperature and salinity. An overview of the main ocean currents is shown in Figure 18.15. As you can see, the northern hemisphere currents form circular patterns (gyres) that rotate clockwise, while the southern hemisphere gyres are counter-clockwise. This happens for the same reason that the water in your northern hemisphere sink rotates in a clockwise direction as it flows down the drain; this is caused by the Coriolis effect.
Exercises
Exercise 18.5 Understanding the Coriolis Effect
 The Coriolis effect has to do with objects that are moving in relation to other objects that are rotating. An ocean current is moving across the rotating Earth, and its motion is controlled by the Coriolis effect.
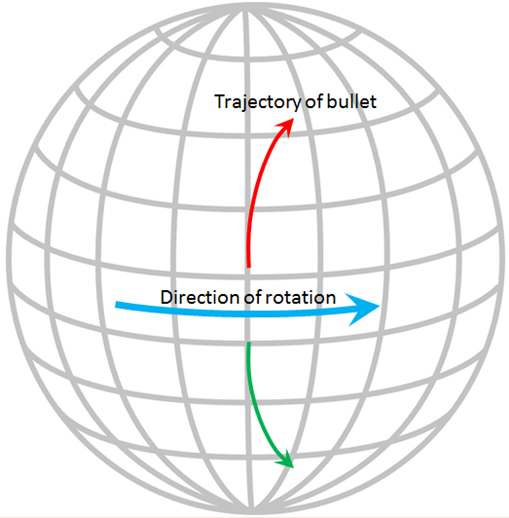
Imagine that you are standing on the equator looking straight north and you fire a gun in that direction. The bullet in the gun starts out going straight north, but it also has a component of motion toward the east that it gets from Earth’s rotation, which is 1,670 km/h at the equator. Because of the spherical shape of Earth, the speed of rotation away from the equator is not as fast as it is at the equator (in fact, the Earth’s rotational speed is 0 km/h at the poles) so the bullet actually traces a clockwise curved path across Earth’s surface, as shown on the diagram. The same thing happens to ocean currents and to tropical storms. If Earth were a rotating cylinder, instead of a sphere, there would be no Coriolis effect.
Because the ocean basins aren’t like bathroom basins, not all ocean currents behave the way we would expect. In the North Pacific, for example, the main current flows clockwise, but there is a secondary current in the area adjacent to our coast — the Alaska Current — that flows counter-clockwise, bringing relatively warm water from California, past Oregon, Washington, and B.C. to Alaska. On Canada’s eastern coast, the cold Labrador Current flows south past Newfoundland, bringing a stream of icebergs past the harbour at St. John’s (Figure 18.16). This current helps to deflect the Gulf Stream toward the northeast, ensuring that Newfoundland stays cool, and western Europe stays warm.
![Figure 18.15 Overview of the main open-ocean currents. Red arrows represent warm water moving toward colder regions. Blue arrows represent cold water moving toward warmer regions. Black arrows represent currents that don’t involve significant temperature changes. [From: https://upload.wikimedia.org/wikipedia/commons/9/9b/Corrientes-oceanicas.png]](http://opentextbc.ca/geology/wp-content/uploads/sites/110/2015/08/the-main-open-ocean-currents.png)
![Figure 18.16 An iceberg floating past Exploits Island, on the Newfoundland Current [https://commons.wikimedia.org/wiki/File:Newfoundland_Iceberg_just_off_Exploits_Island.jpg]](http://opentextbc.ca/geology/wp-content/uploads/sites/110/2015/08/iceberg-floating-past-Exploits-Island.jpg)
The currents shown in Figure 18.15 are all surface currents, and they only involve the upper few hundred metres of the oceans. But there is much more going on underneath. The Gulf Stream, for example, which is warm and saline, flows past Britain and Iceland into the Norwegian Sea (where it becomes the Norwegian Current). As it cools down, it becomes denser, and because of its high salinity, which also contributes to its density, it starts to sink beneath the surrounding water (Figure 18.17). At this point, it is known as North Atlantic Deep Water (NADW), and it flows to significant depth in the Atlantic as it heads back south. Meanwhile, at the southern extreme of the Atlantic, very cold water adjacent to Antarctica also sinks to the bottom to become Antarctic Bottom Water (AABW) which flows to the north, underneath the NADW.
![Figure 18.17 A depiction of the vertical movement of water along a north-south cross-section through the Atlantic basin [SE]](http://opentextbc.ca/geology/wp-content/uploads/sites/110/2015/08/vertical-movement-of-water-along-a-north-south-cross-section.png)
The descent of the dense NADW is just one part of a global system of seawater circulation, both at surface and at depth, as illustrated in Figure 18.18. The water that sinks in the areas of deep water formation in the Norwegian Sea and adjacent to Antarctica moves very slowly at depth. It eventually resurfaces in the Indian Ocean between Africa and India, and in the Pacific Ocean, north of the equator.
![Figure 18.18 The thermohaline circulation system, also known as the Global Ocean Conveyor [from NASA at: https://en.wikipedia.org/wiki/Thermohaline_circulation#/media/File:Thermohaline_Circulation_2.png]](http://opentextbc.ca/geology/wp-content/uploads/sites/110/2015/08/thermohaline-circulation-system.png)
The thermohaline circulation is critically important to the transfer of heat on Earth. It brings warm water from the tropics to the poles, and cold water from the poles to the tropics, thus keeping polar regions from getting too cold and tropical regions from getting too hot. A reduction in the rate of thermohaline circulation would lead to colder conditions and enhanced formation of sea ice at the poles. This would start a positive feedback process that could result in significant global cooling. There is compelling evidence to indicate that there were major changes in thermohaline circulation, corresponding with climate changes, during the Pleistocene Glaciation.
