Chapter 10. Global Society
10.2. Global Wealth and Poverty
Just as North America’s wealth is increasingly concentrated among its richest citizens, while the middle class slowly disappears, global inequality involves the concentration of resources in certain nations, significantly affecting the opportunities of individuals in poorer and less powerful countries.
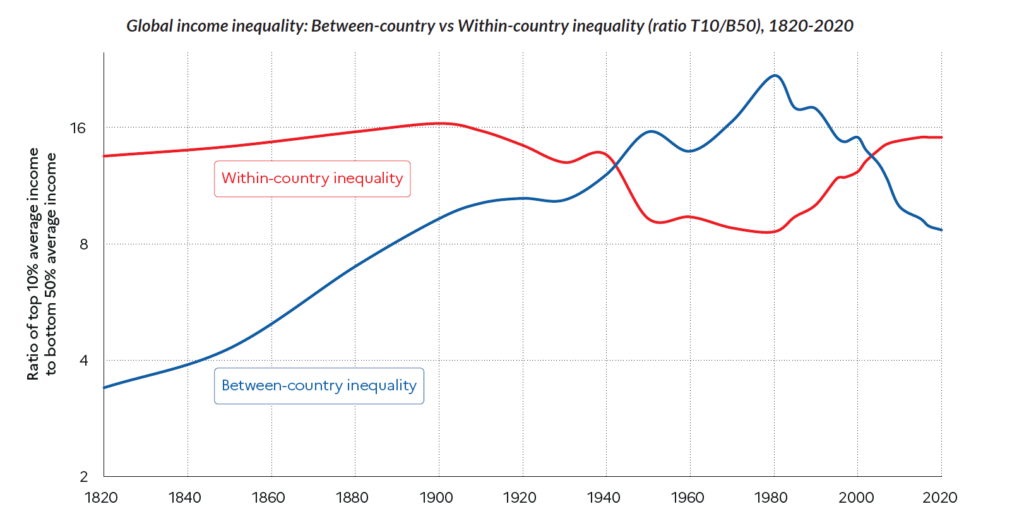
Global income inequality has always been significant, reflecting the persistence of a world economic system that is extremely hierarchical, both between countries and within them (Chancel et al., 2022). Global inequality increased between 1820 and 1910, in the context of the rise of Western dominance and colonial empires, and then stabilized at a remarkably high level between 1910 and 2020. Since 1980, domestic inequality has grown, but international inequality started to decline thanks to fast growth in the large so-called emerging economies. These two effects balance each other out so that, in the past few decades, global inequality has been basically stable, albeit at a very high level.
Global Stratification
Global stratification describes how worldwide patterns or structures of social inequality persist through time. While stratification in Canada refers to the unequal distribution of resources among individuals, global stratification refers to unequal distribution among states. It compares the wealth, economic stability, status, and power of countries across the world. There are two dimensions to this stratification: gaps between nations and gaps within nations. When it comes to global inequality, both economic inequality and social inequality concentrate the burden of poverty among certain segments of the Earth’s population (Myrdal, 1970).
One measure of global stratification compares the quality of life of different countries’ populations. Simple indicators of this are infant mortality rates and life expectancy. As the table below illustrates, people’s life expectancy depends heavily on where they happen to be born.
| Country | Infant Mortality Rate | Life Expectancy |
|---|---|---|
| Canada | 4.9 deaths per 1,000 live births | 81 years |
| Mexico | 17.2 deaths per 1,000 live births | 76 years |
| Democratic Republic of Congo | 78.4 deaths per 1,000 live births | 55 years |
Another way to evaluate stratification is to consider how many people live in poverty, and particularly extreme poverty, which has been defined as needing to survive on less than $2.15 per day (Filmer, Fu & Sanchez-Paramo, 2022). As noted in Chapter 9. Social Inequality, social scientists define poverty in different ways to take into account the complexities and issues of comparing poverty between jurisdictions. Relative poverty is a state of living where people can afford necessities, but cannot meet their society’s average standard of living. This cut off level might be considered the basic cost to participate in society. People often disparage “keeping up with the Joneses:” the idea that one must keep up with the neighbours’ standard of living to not feel deprived. But in Canada, the experience of living without a car to drive to and from work, without any money for a safety net should a family member fall ill, or without any “extras” beyond just making ends meet, effectively limits participation in society and makes life precarious. On the other hand, contrary to relative poverty, people who live in extreme or absolute poverty lack even the basic necessities, which typically include adequate food, clean water, safe housing, and access to healthcare.
The positive news is that, until the COVID-19 pandemic impacted economies in 2020, the extreme poverty rate had been on a 30-year decline. In 1990, 1 in 3 people lived in extreme poverty, compared to approximately 1 in 10 in 2019 (World Bank, 2022). In 2015, 10.8% of the world’s population lived in extreme poverty. In 2019, that number had dropped an entire percentage point to 8.4%. While this is positive, 8.4% is still equivalent to 648 million people living on less than $2.15 a day. The same year (2019), 23.5% of the world lived on less than $3.65 per day, and 46.7% on less than $6.85 per day (Schoch et al., 2022). Unfortunately, the pandemic ended this trend with an estimated spike in poverty rates of 11% in 2022. Followed by the invasion of Ukraine and climate impacts on the world’s biggest food producers, the goal of ending extreme poverty by 2030 seems unreachable (World Bank, 2022).
Table 10.2 clearly demonstrates the significant differences in poverty between several countries.
| Country | Percentage of people living on less than $2.15 |
Percentage of people living on less than $3.65 |
Percentage of people living on less than $6.85 |
|---|---|---|---|
| Colombia | 4.5 | 12.2 | 33.9 |
| Costa Rica | 1.5 | 4 | 13.9 |
| Georgia | 5.6 | 19.6 | 53.9 |
| Kyrgyzstan | 0.7 | 13.2 | 66.1 |
| Sierra Leone | 26.1 | 64.3 | 89.9 |
| Angola | 31.1 | 52.9 | 78 |
| Lithuania | 0.9 | 1.3 | 2.9 |
| Ukraine | 0.0 | 0.5 | 9.4 |
| Vietnam | 1.2 | 5.3 | 22.2 |
| Indonesia | 5.4 | 26.4 | 62.8 |
A third measure of income inequality tries to capture the two dimensions of global stratification — gaps between countries and gaps within countries — by comparing standardized income distributions. Figure 10.12 compares income distribution in 16 different countries from different regions of the world based on percentiles. To be in the top 1% of income earners in the United States in 2021, one had to earn $336,953 before taxes (about $140,000 more than in Canada ($193,036)), whereas in Ethiopia one only had to earn about $24,297. This means that top 1% in the U.S. were the highest income earners in the world, while Ethiopia is overall one of the poorest countries in the world. On the other hand, the income gap within Columbia in which the 99th percentile earner earns 192 times more than the 10th percentile earner is much higher than in the U.S. where the 99th percentile earner earns 83 times more than the 10th percentile earner (Mathisen, 2022).
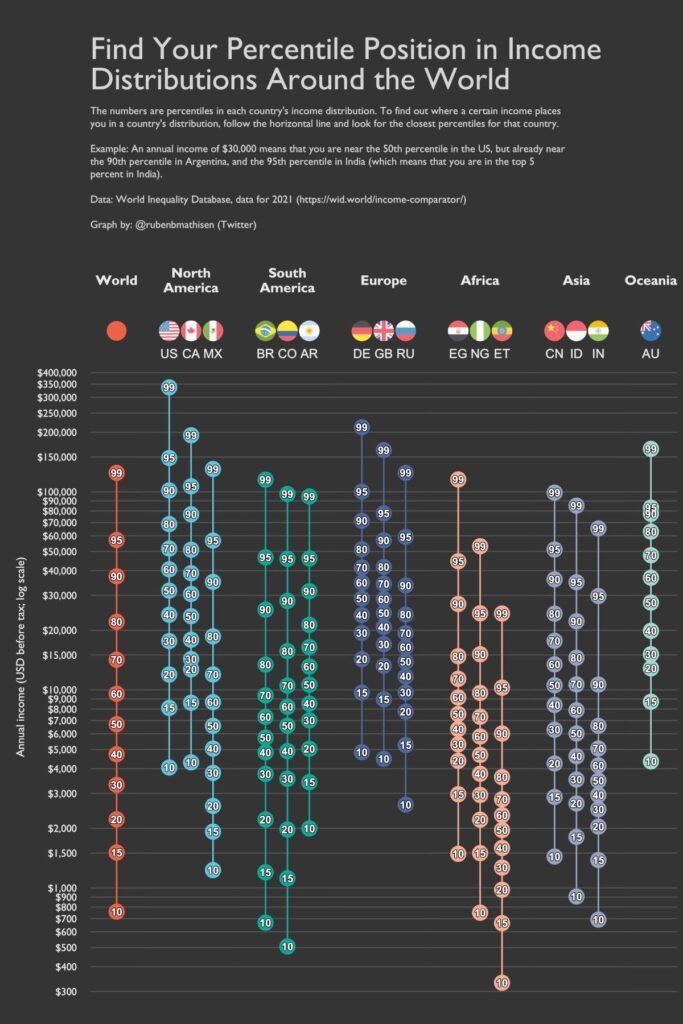
Most people are accustomed to thinking of global stratification as economic inequality. For example, Ethiopia’s average worker’s wage (“ET” in Figure 10.13 above) can be compared to Canada’s average wage. Social inequality, however, is just as harmful as economic discrepancies. Prejudice and discrimination — whether against a certain race, ethnicity, religion, or the like — can create and aggravate conditions of economic equality, both within and between nations. Think about the inequity that existed for decades within the nation of South Africa. Apartheid, one of the most extreme cases of institutionalized and legal racism, created a social inequality that earned it the world’s condemnation. When looking at inequity between states, one can think also about the disregard of the civil war in Yemen by most Western nations (Center for Preventive Action, 2022). Since few citizens of Western nations identified with the impoverished, non-white victims of the resulting humanitarian crisis, there has been little push to provide aid or resolve the conflict.
Gender inequity is another global concern. Women continue to have less access to the labour market (and especially to the most rewarding occupations) in many countries and this exacerbates the gender inequality in earnings and access to positions of power and status (Chancel et al., 2022). Women’s inequality can also be measured in terms of degrees of agency, defined as the “ability to define one’s goals and act on them” (Kabeer, 1999). Women are often at a systematic disadvantage in their ability to make effective choices in a range of spheres, from making decisions at home, deciding what kind of work to do, to choosing whether or when to get married and how many children to have to becoming politically active (World Bank Group, 2014).
Inequalities based on sexual orientation and gender identity also exist around the globe. According to Amnesty International (2012), a number of types of crimes are committed against individuals who do not conform to traditional gender roles or sexual orientations (however those are culturally defined). From culturally sanctioned rape to state-sanctioned executions, the abuses are serious. These legalized and culturally accepted forms of prejudice and discrimination exist everywhere — from the United States to Somalia to Tibet — restricting the freedom of individuals and often putting their lives at risk. As of March 2019, 70 global states continue to criminalize same-sex consensual activity. The death penalty for consensual same-sex sexual acts is imposed in 6 UN member states (Iran, Saudi Arabia, Yemen, Sudan, Somalia, and Nigeria) (Mendos, 2019).
Making Connections: Sociology in the Real World
Multiple Disadvantages Among Adolescent Hmong Girls
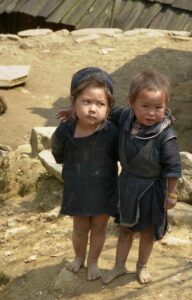
Vietnam has achieved tremendous progress in development, but the gains have been unevenly enjoyed. In Ha Giang Province in northern Vietnam, Hmong children and adolescents, especially girls, face multiple disadvantages. Among the Hmong ethnic minority, poverty rates exceed 80 percent, compared with 20 per cent for Vietnam as a whole.
Traditional preference for sons and filial piety mean that girls spend long hours on domestic chores—only 4 per cent of Hmong girls are enrolled in secondary school and, as adults, their opportunities for paid work are negligible.
Rates of child marriage and total fertility for Hmong are double the rate for the Kinh majority ethnic group. Hmong girls also have inadequate access to sexual and reproductive health information and services. In recent fieldwork in Ta Lung commune, girls often struggled to imagine future lives that differed from those of their mothers. Most Hmong girls reported very little say in family or community decisions, where they faced discrimination on the grounds of both their gender and their age. That was reflected in one mother’s plans for her children: “My daughter will finish grade nine only, and then she will get married. My son won’t go anywhere; he will live with me, so I let him reach the high grade.”
Adapted from: World Bank Group. (2014). Voice and agency: Empowering women and girls for shared prosperity. CC BY 3.0 IGO
Global Classification
Poverty levels have been shown to vary greatly. The poor in wealthy countries like Canada or Europe are much better off than the poor in less-industrialized countries such as Mali or India. When using the World Bank categorization to classify economies, the measure of GNI, or gross national income, provides a picture of the overall economic health of a nation. Gross national income equals the market value of all goods and services produced within a country (its GDP or gross domestic product), plus net income earned outside the country by nationals and corporations headquartered in the country doing business out of the country, measured in U.S. dollars. In other words, the GNI of a country includes not only the value of goods and services inside the country, but also the value of income earned outside the country if it is earned by foreign nationals or foreign businesses. That means that multinational corporations that might earn billions in offices and factories around the globe are considered part of a core nation’s GNI if they have headquarters in the core nations. Along with tracking the economy, the World Bank tracks demographics and environmental health to provide a complete picture of whether a nation is high-income, middle-income, or low-income.
High-Income Nations
The World Bank defines high-income nations as having a gross national income of at least $12,536 per capita in 2019 (World Bank 2021). The classifications will always lag by a couple of years so that analysts can evaluate the true income of the nations. It separates out the OECD (Organization for Economic and Co-operative Development) countries, a group of 34 nations whose governments work together to promote economic growth and sustainability. According to the Work Bank (2011), in 2010, the average GNI of a high-income nation belonging to the OECD was $40,136 per capita; on average, 77% of the population in these nations was urban. Some of these countries include Canada, the United States, Germany, and the United Kingdom (World Bank, 2011). In 2010, the average GNI of a high-income nation that did not belong to the OECD was $23,839 per capita and 83% was urban. Examples of these countries include Saudi Arabia and Qatar (World Bank, 2011).
There are two major issues facing high-income countries: capital flight and deindustrialization. Capital flight refers to the movement (flight) of capital from one nation to another, as when General Motors, Ford, and Chrysler close Canadian factories in Ontario and open factories in Mexico. Deindustrialization, a related issue, occurs as a consequence of capital flight, when no new companies open to replace jobs lost to foreign nations. As expected, global companies move their industrial processes to the places where they can get the most production with the least cost, including the costs for building infrastructure, training workers, shipping goods, and, of course, paying employee wages. This means that as low-wage economies create their own industrial zones, global companies see the opportunity for existing infrastructure and much lower costs. Those opportunities lead to businesses closing the factories that provide jobs to the middle class within core nations and moving their industrial production to peripheral and semi-peripheral nations.
Middle-Income Nations
The World Bank divides middle-income economies into two categories. Lower-middle-income areas are those with a GNI per capita of more than $1,036 but less than $4,045, such as Democratic Republic of Congo, Tunisia, Philippines, El Salvador, and Nepal. Upper-middle-income areas are those with a GNI per capita between $4,046 and $12,535, including Argentina, Mexico, China, Iran, Turkey, and Namibia are examples of upper-middle-income nations (World Bank 2021).
Perhaps the most pressing issue for middle-income nations is the problem of debt accumulation. As the name suggests, debt accumulation is the buildup of external debt, when countries borrow money from other nations to fund their expansion or growth goals. As the uncertainties of the global economy make repaying these debts, or even paying the interest on them, more challenging, nations can find themselves in trouble. Once global markets have reduced the value of a country’s goods, it can be difficult to manage the debt burden. Such issues have plagued middle-income countries in Latin America and the Caribbean, as well as East Asian and Pacific nations (Dogruel and Dogruel, 2007). By way of example, even in the European Union, which is composed of more core nations than semi-peripheral nations, the semi-peripheral nations of Italy, Portugal, and Greece face increasing debt burdens. The economic downturns in these countries are threatening the economy of the entire European Union.
Low-Income Nations
The World Bank defines low-income countries as nations whose per capita GNI was $1,035 per capita or less in 2019. For example, Afghanistan, Ethiopia, and Yemen are considered low-income countries. Low-income economies are primarily found in Asia and Africa (World Bank 2021), where most of the world’s population lives.
Nations’ classifications often change as their economies evolve and, sometimes, when their political positions change. Nepal, Indonesia, and Romania all moved up to a higher status based on improved economies. While Sudan, Algeria, and Sri Lanka moved down a level. A few years ago, Myanmar was a low-income nation, but now it has moved into the middle-income area. With Myanmar’s 2021 coup, the massive citizen response, and the military’s killing of protesters, its economy may go through a downturn again, returning it to the low-income nation status.
There are two major challenges that these countries face: women are disproportionately affected by poverty (in a trend toward a global feminization of poverty) and much of the population lives in absolute poverty. In some ways, the term global feminization of poverty says it all: around the world, women are bearing a disproportionate percentage of the burden of poverty. This means more women live in poor conditions, receive inadequate health care, bear the brunt of malnutrition and inadequate drinking water, and so on. Throughout the 1990s, data indicated that while overall poverty rates were rising, especially in peripheral nations, the rates of impoverishment increased nearly 20% more for women than for men (Mogadham, 2005).
Why is this happening? While there are myriad variables affecting women’s poverty, research specializing in this issue identifies three causes:
- The expansion of female-headed households
- The persistence and consequences of intra-household inequalities and biases against women
- The implementation of neo-liberal economic policies around the world (Mogadham, 2005)
In short, this means that within an impoverished household, women are more likely to go hungry than men; in agricultural aid programs, women are less likely to receive help than men; and often, women are left taking care of families with no male counterpart.
With respect to the challenge of absolute poverty, in 2019, 8.4% of the global population or 648 million people lived on less than $2.15 a day (Schoch et al., 2022). Not surprisingly, the consequences of extreme poverty are often also causes. The poor experience inadequate health care, limited education, and the inaccessibility of birth control. Those born into these conditions are incredibly challenged in their efforts to break out since these consequences of poverty are also causes of poverty, perpetuating a cycle of disadvantage.
According to sociologists Neckerman and Torche (2007) in their analysis of global inequality studies, the consequences of poverty are many. They have divided the consequences into three areas. The first, termed “the sedimentation of global inequality,” relates to the fact that once poverty becomes entrenched in an area, it is typically difficult to reverse. As mentioned above, poverty exists in a cycle where the consequences and causes are intertwined. The second consequence of poverty is its effect on physical and mental health. Poor people face physical health challenges, including malnutrition and high infant mortality rates. Mental health is also detrimentally affected by the emotional stresses of poverty, with relative deprivation carrying the strongest effect. Again, as with the ongoing inequality, the effects of poverty on mental and physical health become more entrenched as time goes on. Neckerman and Torche’s third consequence of poverty is the prevalence of crime. Cross-nationally, crime rates are higher, particularly with violent crime, in countries with higher levels of income inequality (Fajnzylber, Lederman, and Loayza 2002).
Explanations of Global Stratification
Cold War Terminology, Modernization Theory and Structural Functionalism
The terminology of “first world” and “third world,” and “underdeveloped,” “developing” and “developed” nations originated during the Cold War era (1945–1989) when the world was divided between capitalist and communist economic systems and their respective geopolitical spheres of influence. Familiar and still used by many, it involves classifying countries into a global hierarchy of development based on respective economic development and standards of living.
Capitalist democracies such as the United States, Canada, Western Europe, and Japan were considered part of the first world. The poorest, most undeveloped countries (largely former colonies) were referred to as the third world and included most of Sub-Saharan Africa, Latin America, and Asia. The second world was the communist world or Soviet bloc: industrially developed but organized according to a state socialist or communist model of political economy. Later, native activist George Manuel (1974) added the term fourth world to refer to stateless, poor, or marginal peoples, particularly Indigenous Peoples, who live under premodern or third world conditions in whichever nation-state they reside in.
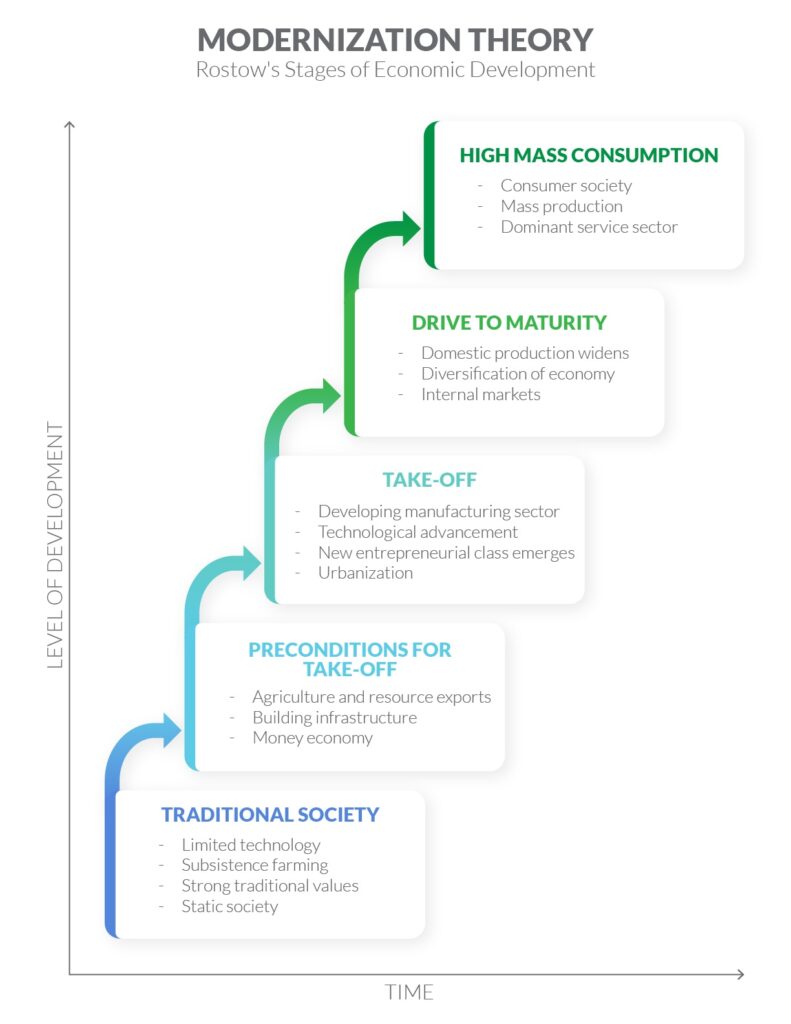
The idea of first world and third world as developed and developing or underdeveloped nations was based on an evolutionary model of economic transition. Modernization theory suggests that societies moved through natural stages of development as they progress toward becoming developed societies (i.e., stable, democratic, market oriented, and capitalist). The economist Walt Rustow (1960) provided a significant influential schema of modernization theory when he described economic development as a linear sequence of stages: traditional society (agrarian based with low productivity); pre-take off society (state formation and shift to industrial production, expansion of markets, and generation of surplus); take-off (rapid self-sustained economic growth and reinvestment of capital in the economy); drive to maturity (a modern industrialized economy, highly capitalized and technologically advanced); high mass-consumption (shift to the mass production and consumption of durable goods (TVs, cars, refrigerators, etc.) and luxury goods, general prosperity, egalitarianism).
This is a structural functionalist type of theory, proposing that global inequality is a product of cultural and technological differences between societies. Societies that were organized around traditional cultural values, kinship systems and despotic social relations were in a sense too stable; unable to invent or adapt to innovations in technology that, in Western Europe, drove the industrial revolution. Western Europe gained a developmental advantage due to the progress-oriented elements in its culture like the Protestant Ethic and the Protestant Reformation’s emphasis on the individual. These functioned to enable technological innovation, economic development, and revolutionary changes in social systems to occur.
According to modernization theory, low-income countries are affected by their lack of industrialization and can improve their global economic standing through:
- An adjustment of cultural values and attitudes to work
- Industrialization and other forms of economic growth (Armer and Katsillis, 2010)
Like most versions of modernization theory, Rustow’s schema describes a linear process of development culminating in the formation of democratic, capitalist societies. The inability of some societies to develop was the product of rigid traditional values and failure to adopt capitalism. This explanation was clearly in line with Cold War ideology that placed capitalist democracy at the pinnacle of civilization, but it also echoed widely held beliefs about the idea of social progress as an evolutionary process.
Nevertheless, however “natural” these stages of development were taken to be, they required intervention, protection, and support. This was the era when the idea of geopolitical noblesse oblige (first world responsibility) took root, suggesting that the so-called developed nations should provide foreign aid and industrial technologies to the less developed and underdeveloped nations in order to raise their standard of living. But as critical sociologists like Walter Rodney (1972) noted, these aid programs tended to conceal the magnitude of neo-colonial exploitation behind a discourse of benevolence. Massive amounts of economic value were extracted from former colonies in the form of resources and low-wage labour, while a significantly smaller proportion of wealth was returned in the form of foreign aid.
Dependency Theory, World Systems Approach, and Critical Sociology
A major concern when discussing global inequality therefore is how to avoid a Eurocentric bias implying that less developed nations want to be like those who have attained postindustrial global power. Terms such as “developing” (non-industrialized) and “developed” (industrialized) imply that non-industrialized countries are somehow inferior and must Westernize to participate successfully in the global economy and global civilization.
Dependency theory was created in part as a response to the Western-centric mindset of modernization theory. As a non-Western perspective on globalization, it developed a critical sociological framework to describe global inequality as the outcome of historical power relations and colonialism. Dependency theory states that global inequality is primarily caused by core nations (or high-income nations) exploiting semi-peripheral and peripheral nations (or middle-income and low-income nations), creating a cycle of dependence (Hendricks, 2010).
In the period of colonialism, core or metropolis nations based in Europe created the conditions for the underdevelopment of peripheral or hinterland nations through a metropolis-hinterland relationship. The resources of the hinterlands were shipped to the metropolises where they were converted into manufactured goods and shipped back for consumption in the hinterlands. The hinterlands were used as the source of cheap resources and labour, while the import of inexpensive manufactured goods prevented them from developing competitive manufacturing sectors of their own.
Wallerstein’s (1979) world systems approach provided a systematic and historical framework for dependency theory. He conceived of the world-system as “as a unit with a single division of labour and multiple cultural systems,” which redistributes surplus value from the periphery to the core (Wallerstein, 1974). The economic and political basis of contemporary global inequality did not emerge from stages of a natural process of gradual modernization, but as the product of the exercise of power: colonialism and the skewed development of global capitalism. In this model, the global economy is a complex historical system supporting an economic hierarchy that placed core nations in positions of power with numerous resources and other peripheral or semi-peripheral nations in a state of economic subordination. Those that were in a state of subordination faced significant obstacles to economic mobilization and political independence and stability.
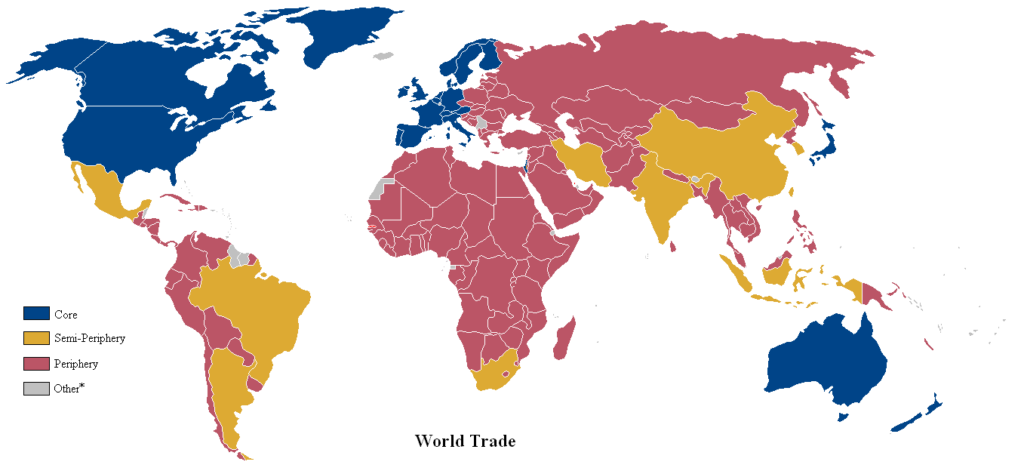
Core nations are dominant capitalist countries, highly industrialized, technological, and urbanized. Wallerstein contends that the United States is an example of a core nation where global resources are accumulated, value-added products are manufactured, and wealth is generated. At the centre of global economic processes, it can exert control over every aspect of the global economy and exploit both semi-peripheral and peripheral nations. Free trade agreements, such as the Canada-United States-Mexico Agreement (CUSMA), are examples of how a core nation can leverage its power to gain the most advantageous position in the matter of global trade.
Peripheral nations have little industrialization; what they do have often represents the outdated castoffs of core nations, the factories and means of production owned by core nations, or the resources exploited by core nations. The resources and labour of peripheral nations have historically supported the accumulation of wealth in core nations, first as colonies and then as sites for multinational corporations. They typically have unstable governments, poor labour standards and inadequate social programs. They are economically dependent on core nations for jobs, loans, and foreign aid. There are abundant examples of countries in this category. The label on most jeans or sweatshirts sold in Canada will likely indicate its source in a peripheral nation such as Guatemala, Bangladesh, Malaysia, or Thailand. The workers in these garment factories, which are owned, leased, or contracted by multinational companies headquartered in core nations, do not enjoy the same privileges and rights as Canadian workers.
Semi-peripheral nations like India, Brazil and Mexico are in-between nations, more closely integrated with the core, but not powerful enough to dictate global policy. They also tend to be major sources of raw material and labour. For example, Mexico provides abundant cheap agricultural labour to the United States and Canada, and supplies goods to the North American market at a rate dictated by U.S. and Canadian consumers without the labour laws and constitutional protections offered to U.S. or Canadian workers. But they also provide an expanding middle class marketplace for the products of core nations, while in turn also exploiting peripheral nations.
Dependency theory states that as long as peripheral nations are dependent on core nations for economic stimulus and access to the global economy, they will never achieve stable and consistent economic growth. Further, the theory states that since core nations, as well as the World Bank, choose which countries to make loans to, and for what they will loan funds, they are creating highly segmented, externally oriented labour markets that are built to benefit the dominant market countries. The tourist industry is a prime example.
At first glance, it seems this theory ignores the formerly low-income nations that are now considered middle-income nations and are on their way to becoming high-income nations and major players in the global economy, such as China. It does not explain how some former colonies like Singapore and Sri Lanka have been able to develop while others in Sub-Saharan Africa have not. It is plausible that factors like culture and technological adaptation, which are the focus of modernization theories, have a role to play.
China is an interesting case because since 1978, 800 million people, or approximately half the population have been lifted out of poverty, meaning that China is now an upper-middle-income country (World Bank, 2022b). Yet at the same time, 25% of the population in China live under the $6.85 a day poverty cut-off line for middle-income countries (compared to 0.75% in Canada, adjusted for inflation and for differences in the cost of living) (Hasell et al., 2022). This suggests a disjuncture in people’s standard of living within the same country. In fact, from a critical sociology perspective, it becomes more interesting to examine the way development and underdevelopment occur side by side within the core nations, peripheral nations, and semi-peripheral nations. The idea of “nations” as containers of national economies and the unit of analysis for understanding global inequality might not be the most effective way to analyse the configurations of power, wealth, and poverty in an increasingly globalized world.
Global Capitalism: Neo-liberalism and Globalization
A third type of explanation for global stratification focuses on the properties of global capitalism itself. From its origins, capitalism has been global in scope. Marx and Engels already described globalization in 1848:
The bourgeoisie has through its exploitation of the world market given a cosmopolitan character to production and consumption in every country. To the great chagrin of Reactionists, it has drawn from under the feet of industry the national ground on which it stood. All old-established national industries have been destroyed or are daily being destroyed. They are dislodged by new industries, whose introduction becomes a life and death question for all civilized nations, by industries that no longer work up indigenous raw material, but raw material drawn from the remotest zones; industries whose products are consumed, not only at home, but in every quarter of the globe. In place of the old wants, satisfied by the production of the country, we find new wants, requiring for their satisfaction the products of distant lands and climes. In place of the old local and national seclusion and self-sufficiency, we have intercourse in every direction, universal interdependence of nations (Marx & Engels, 1848/1977).
The development of global capitalism intensified after World War II, and especially in the late 20th century with the introduction of new economic policies and new technologies that enabled vast volumes of capital and goods to circulate globally. Contrary to the analyses of modernization theory and dependency theory, global capitalism theory proposes that since the 1970s capital accumulation has taken place less and less in the context of national economies. Instead, the context of international flows of capital investment and disinvestment is an increasingly integrated world market. The concept of development has shifted from the model of nationally managed economic growth to “participation in the world market” (McMichael, 2017).
The neo-liberal model of capital accumulation has been central to these changes. When nationally managed economies began to experience economic crisis in the late 1960s and early 1970s (see Chapter 4. Society and Modern Life), the relationship between states and the global economy started to change. Neo-liberalism is the term used to define the new rationality of government, which abandons the interventionist model of national economic management and the welfare state to emphasize the use of “free market” mechanisms to regulate society. It is a set of policies in which the state reduces its role in providing public services, regulating industry, redistributing wealth, and protecting “the commons” — i.e., the collective resources that exist for everyone to share (the environment, public infrastructure, community facilities, airwaves, etc.).
Neo-liberalism is also a response to the ever more competitive global market for capital. Neo-liberal policy is presented as a way to attract increasingly fickle global capital by making entire countries more “competitive.” As a result, the policies of neo-liberalism have been enacted on a global scale: the imposition of open “free” markets across national borders, the deregulation of trade and investment, and the privatization of public goods and services. The globalization of investment and production means that capital is increasingly able to shift production around the world to where labour costs are cheapest and profit greatest. As noted above in the example of global assembly lines and global commodity chains, capital investments, production and markets are coordinated on a global scale, leading to a global reordering of production and consumption, as well as inequalities both between nations and within nations.
Within this model, the world and its resources are reorganized and managed on the basis of the free trade of goods and services, the free circulation of capital, and coordination by political and economic elite organizations like the G7, the WTO, the World Bank and the IMF. The global economy as a whole, not modernized national economies, emerges as the site of development and underdevelopment. The production, distribution, and consumption of finance, goods and services are administratively and technologically integrated on a worldwide basis (Robinson, 2004; 2017).
The result, as David Harvey (b. 1935) forcefully argues, has been to massively shift the balance of power to the economic elites of the global or transnational capitalist class (Harvey, 2005). Wealth and poverty have been redistributed on a global scale. On one hand, global capitalism has produced a transnational capitalist class who “detach their interests from the home market” (Hymer, 1974, cited in Carroll, 2018) and exist as a network of CEOs, investors and corporate managers distributed (albeit unevenly) around the world. For example, while the U.S. was home to the majority of billionaires in 2021 (975 individuals), China was home to the second most (400), Germany was third (176) and India fourth (124) (Koop, 2022).
On the other hand, the globalization of production has lead to the creation of a vast global workforce as farm production is integrated into global supply chains and millions of people have migrated to cities to work in global factories and global service work. Others are marginalized as surplus humanity, of no direct use to capitalism, sustaining themselves in informal sectors of the economy, and consigned to what Mike Davis referred to as a “planet of slums” (Davis, 2006). However, rather than the global north simply extracting wealth from peripheral countries of the global south as predicted by dependency theory, McMichael (2017) describes the outcome of these massive shifts as the spread of a bifurcated labour system to all regions of globe. In the global north as well as the south, a core of relatively stable, well-paid labour is separated from a periphery of casual, precarious, low-cost labour. Davis’ (2006) description of Los Angeles as a “fortress city” provides an image of bifurcated social life in which the wealthy and better off live in gated communities, insulated from the poor and precariously employed by new systems of spatial organization, social control, and policing.
Carroll (2018) cautions that global capitalism theory tends to over-emphasize the way that the creation of a single global market and a transnational capitalist class eliminates distinct national economies and enduring neo-colonial structures of North-South disparity. Populist movements like MAGA (Make America Great Again) that seek to decouple some aspects of national economies from globalization, as well as China’s state directed form of capitalism and “Belt and Road Initiative,” indicate that global capitalism is, in significant ways, simultaneously national and transnational.
Making Connections: Big Picture
The True Cost of a T-Shirt
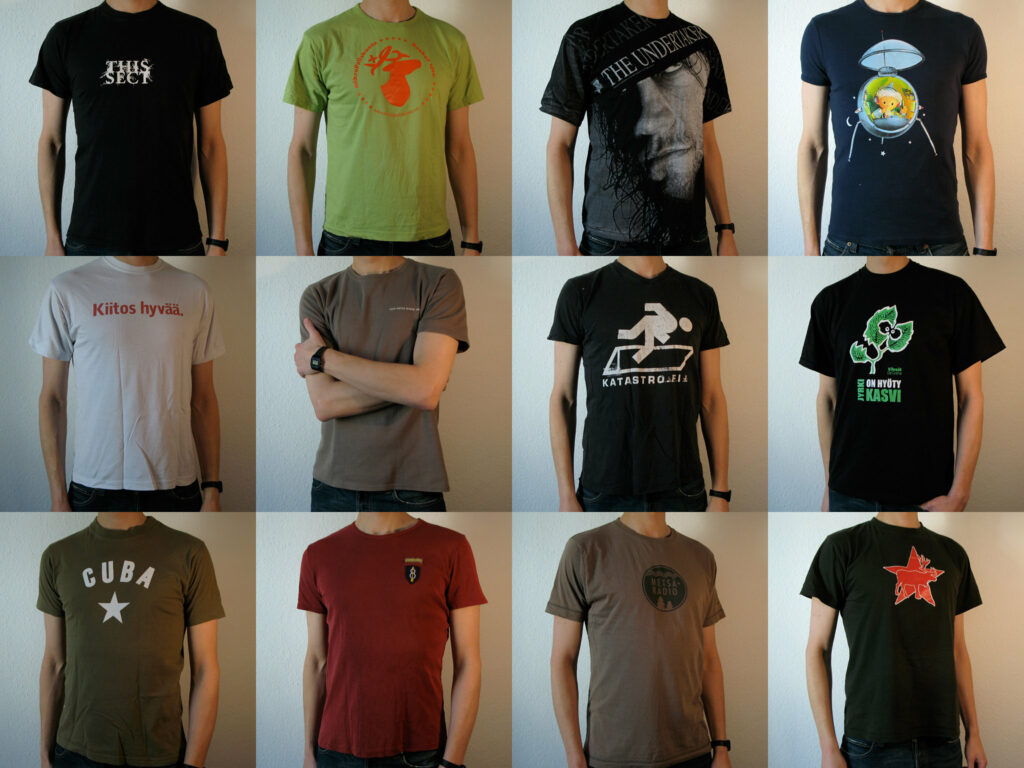
Most people do not pay too much attention to where their favourite products are made. Certainly, when they are shopping for a cheap T-shirt, they probably do not turn over the label, check who produced the item, and then research whether or not the company has fair labour practices. In fact, it can be extremely difficult to discover where exactly the items people use every day have come from. Nevertheless, the purchase of a T-shirt involves the consumer in a series of social relationships that tie them to the lives and working conditions of people around the world.
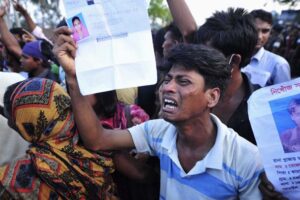
On April 24, 2013, the Rana Plaza building in Dhaka, Bangladesh, collapsed killing 1,129 garment workers. The building, like 90% of Dhaka’s 4,000 garment factories, was structurally unsound. Garment workers in Bangladesh work under unsafe conditions for as little as $38 a month so that North American consumers can purchase T-shirts in the fashionable colours of the season for as little as $5. The workers at Rana Plaza were in fact making clothes for the Joe Fresh label — the signature popular Loblaw brand — when the building collapsed. Having been put on the defensive for their overseas sweatshop practices, companies like Loblaw have pledged to improve working conditions in their suppliers’ factories, but compliance has proven difficult to ensure because of the increasingly complex web of globalized production (MacKinnon and Strauss, 2013).
At one time, the garment industry was important in Canada, centred on Spadina Avenue in Toronto and Chabanel Street in Montreal. But over the last two decades of globalization, Canadian consumers have become increasingly tied through popular retail chains to a complex network of outsourced garment production that stretches from China, through South East Asia, to Bangladesh and Sri Lanka. The early 1990s saw the economic opening of China when suddenly millions of workers were available to produce and manufacture consumer items for Westerners at a fraction of the cost of Western production. Manufacturing that used to take place in Canada moved overseas. Over the ensuing years, the Chinese began to outsource production to regions with even cheaper labour: Vietnam, Cambodia, Sri Lanka, and Bangladesh. The outsourcing was outsourced. The result is that when a store like Loblaw places an order, it usually works through agents who in turn source and negotiate the price of materials and production from competing locales around the globe.
Most of the T-shirts that people wear in Canada today begin their life in the cotton fields of arid west China, which owe their scale and efficiency to the collectivization projects of centralized state socialism. However, as the cost of Chinese labour has incrementally increased since the 1990s, the Chinese producers have moved into the role of connecting Western retailers and designers with production centres elsewhere. In a global division of labour, if agents organize the sourcing, production chain and logistics, Western retailers can focus their skill and effort on retail marketing. It was in this context that Bangladesh went from having a few dozen garment factories to several thousand. The garment industry now accounts for 80% of Bangladesh’s export earnings. Unfortunately, although there are legal safety regulations and inspections in Bangladesh, the rapid expansion of the industry has exceeded the ability of underfunded state agencies to enforce them.
The globalization of production makes it difficult to follow the links between the purchasing of a T-shirt in a Canadian store and the chain of agents, garment workers, shippers, and agricultural workers whose labour has gone into producing it and getting it to the store. Canadian’s lives are tied to this chain each time they wear a T-shirt, yet the history of its production and the lives it has touched are more or less invisible. It becomes even more difficult to do something about the working conditions of those global workers when even the retail stores are uncertain about where the shirts come from. There is no international agency that can enforce compliance with safety or working standards. Why do worker safety standards and factory building inspections have to be imposed by government regulations rather than being simply an integral part of the production process? Why does it seem normal that the issue of worker safety in garment factories is set up in this way? Why does this make it difficult to resolve or address the issue?
The fair trade movement has pushed back against the hyper-exploitation of global workers and forced stores like Loblaw to try to address the unsafe conditions in garment factories like Rana Plaza. Organizations like the Better Factories Cambodia program inspect garment production regularly in Cambodia, enabling stores like Mountain Equipment Co-op to purchase reports on the factory chains it relies on. After the Rana Plaza disaster, Loblaw signed an Accord of Fire and Building Safety in Bangladesh to try to ensure safety compliance of their suppliers. However, the bigger problem seems to originate with people’s desire to be able to purchase a T-shirt for $5 in the first place.
Image Descriptions
Figure 10.17 Long Description: Flowchart of Rostow’s Stages of Economic Growth
The flowchart starts at the bottom left with traditional society and, with increased time and level of development, moves up and to the right through the following steps.
- Traditional society
- Limited technology; static society
- Transition triggered by external influence, interests, or markets
- Preconditions for take-off
- Commercial exploitation of agriculture and extractive industry
- Installation of physical infrastructure (roads, railways, etc.) and emergence of social/political elite
- Take-Off
- Development of a manufacturing sector
- Investment in manufacturing exceeds 10% of national income; development of modern social, economic, and political institutions
- Drive to Maturity
- Development of wider industrial and commercial base
- b. Exploitation of comparative advantages in international trade
- High Mass consumption [Return to Figure 10.17]
Media Attributions
- Figure 10.13 Find Your Percentile Position in Income Distributions around the World by Ruben Berge Mathisen, via Visual Capitalist, is used by permission of Visual Capitalist.
- Figure 10.14 Two young Hmong girls holding each other; near Sapa, Vietnam by Lon & Queta, via Flickr, is used under a CC BY-NC-SA 2.0 licence.
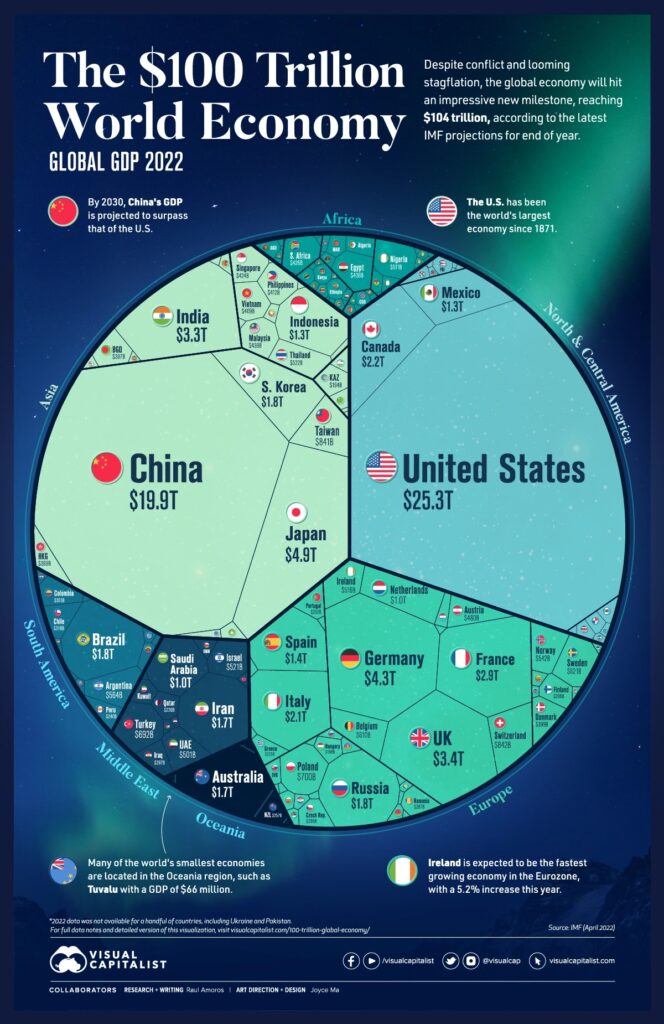
- Figure 10.15 The $100 Trillion Global Economy in One Chart, graphic by Joyce Ma, via Visual Capitalist, is used by permission of Visual Capitalist.
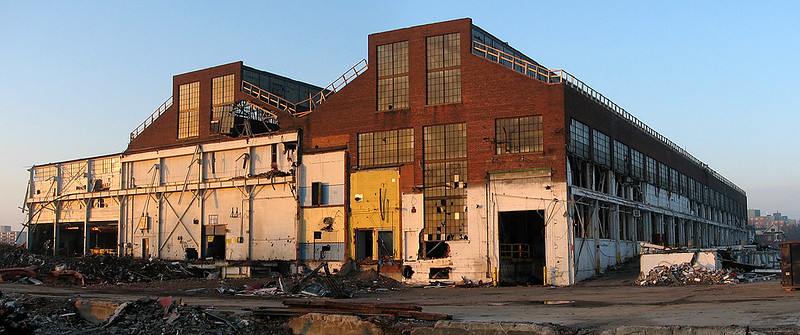
- Figure 10.16 Eve of Destruction by Rick Harris, via Flickr, is used under a CC BY-SA 2.0 licence.
- Figure 10.17 Flowchart of Rostow’s Stages of Economic Growth, by Thompson Rivers University, 2023, based on Knox & Marston (2013).
- Figure 10.18 World Trade Map by Lou Coban has been released into the public domain by its author, User:Naboc1.
- Figure 10.19 Global Income Inequality (Figure 2.4), in Chancel, et al. (2021, p. 57) is used under a CC BY 4.0 licence. [Original Sources and series: wir2022.wid.world/methodology and Chancel and Piketty (2021).]
- Figure 10.20 T-shirt roll call by Mika Meskanen, via Flickr, is used under a CC BY-NC 2.0 licence.
- Figure 10.21 Bangladesh-building by Coolloud, via Flickr, is used under a CC BY-NC-ND 2.0 licence.
