Chapter 14. Marriage and Family
14.3 Challenges Families Face
As the structure of family changes over time, so do the challenges families face. Events like divorce and remarriage present new difficulties for families and individuals. Other long-standing domestic issues, such as abuse, continue to strain the health and stability of families.
Divorce and Remarriage
Divorce, while fairly common and accepted in modern Canadian society, was once a word that would only be whispered and was accompanied by gestures of disapproval. Prior to the introduction of the Divorce Act in 1968 there was no federal divorce law in Canada. In provincial jurisdictions where there were divorce laws, spouses had to prove adultery or cruelty in court. The 1968 Divorce Act broadened the grounds for divorce to include mental and physical cruelty, desertion, and/or separation for more than three years, and imprisonment. In 1986, the Act was amended again to make “breakdown of marriage” the sole ground for divorce. Couples could divorce after one year’s separation, and there was no longer a requirement to prove “fault” by either spouse.
These legislative changes had immediate consequences on the divorce rate. In 1961, divorce was generally uncommon, affecting only 36 out of every 100,000 married persons. In 1969, the year after the introduction of the Divorce Act, the number of divorces doubled from 55 divorces per 100,000 population to 124. The divorce rate peaked in 1987, after the 1986 amendment, at 362 divorces per 100,000 population. Over the last quarter century divorce rates have dropped steadily, reaching 221 divorces per 100,000 population in 2005 (Kelly, 2010). The dramatic increase in divorce rates after the 1960s has been associated with the liberalization of divorce laws (as noted above); the shift in societal makeup, including the increase of women entering the workforce (Michael, 1978); and marital breakdowns in the large cohort of baby boomers (Kelly, 2010). The decrease in divorce rates can be attributed to two probable factors: an increase in the age at which people get married, and an increased level of education among those who marry — both of which have been found to promote greater marital stability.
| Province or Territory | 1961 | 1968 | 1969 | 1985 | 1986 | 1987 | 1990 | 1995 | 2000 | 2005 |
|---|---|---|---|---|---|---|---|---|---|---|
| Canada-wide | 36.0 | 54.8 | 124.2 | 238.9 | 298.8 | 362.3 | 282.3 | 262.2 | 231.2 | 220.7 |
| Newfoundland and Labrador | 1.3 | 3.0 | 20.0 | 96.6 | 118.8 | 193.7 | 175.5 | 170.6 | 169.9 | 153.5 |
| Prince Edward Island | 7.6 | 18.2 | 91.9 | 166.3 | 154.5 | 213.1 | 214.4 | 191.0 | 197.0 | 204.8 |
| Nova Scotia | 33.2 | 64.8 | 102.1 | 263.3 | 292.4 | 307.8 | 265.1 | 244.6 | 218.2 | 209.5 |
| New Brunswick | 32.4 | 22.9 | 55.3 | 187.3 | 237.6 | 273.1 | 228.7 | 191.6 | 227.3 | 192.2 |
| Québec | 6.6 | 10.2 | 49.2 | 236.4 | 282.5 | 324.7 | 291.6 | 274.5 | 231.2 | 203.0 |
| Ontario | 43.9 | 69.3 | 160.4 | 223.4 | 290.7 | 403.7 | 280.2 | 264.4 | 223.8 | 229.4 |
| Manitoba | 33.9 | 47.9 | 136.3 | 213.3 | 272.6 | 356.5 | 252.4 | 235.3 | 212.0 | 206.9 |
| Saskatchewan | 27.1 | 40.0 | 92.1 | 187.3 | 240.0 | 286.4 | 233.9 | 228.4 | 214.7 | 194.1 |
| Alberta | 78.0 | 125.7 | 221.0 | 336.0 | 391.8 | 390.2 | 332.1 | 276.6 | 271.7 | 246.4 |
| British Columbia | 85.8 | 110.8 | 205.0 | 278.6 | 374.1 | 397.6 | 296.1 | 275.0 | 246.8 | 233.8 |
| Yukon | 164.1 | 200.0 | 262.5 | 389.9 | 379.6 | 546.6 | 289.0 | 371.9 | 222.4 | 350.2 |
| Northwest Territories | 36.7 | 96.8 | 130.8 | 171.6 | 195.8 | 115.0 | 142.8 | 229.8 | 152.5 | |
| Nunavut (included in the Northwest Territories before 2000) | 25.5 | 33.3 |
So what causes divorce? While more young people are choosing to postpone or opt out of marriage, those who enter into the union do so with the expectation that it will last. A great deal of marital problems can be related to stress, especially financial stress. According to researchers participating in the University of Virginia’s National Marriage Project, couples who enter marriage without a strong asset base (like a home, savings, and a retirement plan) are 70% more likely to be divorced after three years than are couples with at least $10,000 in assets. This is connected to factors such as age and education level that correlate with low incomes.
The addition of children to a marriage creates added financial and emotional stress. Research has established that marriages enter their most stressful phase upon the birth of the first child (Popenoe and Whitehead, 2001). This is particularly true for couples who have multiples (twins, triplets, and so on). Married couples with twins or triplets are 17% more likely to divorce than those with children from single births (McKay, 2010). Another contributor to the likelihood of divorce is a general decline in marital satisfaction over time. As people get older, they may find that their values and life goals no longer match up with those of their spouse (Popenoe and Whitehead, 2004).
Divorce is thought to have a cyclical pattern. Children of divorced parents are 40% more likely to divorce than children of married parents. Children whose parents divorced and then remarried, the likelihood of their own divorce rises to 91% (Wolfinger, 2005). This might result from being socialized to a mindset that a broken marriage can be replaced rather than repaired (Wolfinger, 2005). That sentiment is also reflected in the finding that when both partners of a married couple have been previously divorced, their marriage is 90% more likely to end in divorce (Wolfinger, 2005).
Samuel Johnson is quoted as saying that getting married a second time was “the triumph of hope over experience.” In fact, according to the 2001 Statistics Canada General Social Survey, 43% of individuals whose first marriage failed married again, while 16% married again after the death of their spouse. Another 1 per cent of the ever-married population (people who have been married but may not currently be married), aged 25 and over, had been married more than twice (Clark and Crompton, 2006). American data show that most men and women remarry within five years of a divorce, with the median length for men (three years) being lower than for women (4.4 years). This length of time has been fairly consistent since the 1950s. The majority of those who remarry are between the ages of 25 and 44 (Kreider, 2006).
Marriage the second time around (or third or fourth time around) can be a very different process than the first. Remarriage lacks many of the classic courtship rituals of a first marriage. In a second marriage, individuals are less likely to deal with issues like parental approval, premarital sex, or desired family size (Elliot, 2010). Clark and Crompton suggest that second marriages tend to be more stable than first marriages, largely because the spouses are older and more mature. At the time of the Statistics Canada General Social Survey, 71% of the remarried couples surveyed were still together and had been for an average of 13 years. Couples tend to marry a second time more for intimacy-based reasons rather than external reasons and therefore enjoy a greater quality of relationship (Clark and Crompton, 2006).
Wallerstein and Blakeslee’s (1989) research on sixty sets of parents and children over a 10 year period indicate that marriage breakups endanger individuals’ sense of security and well-being but also present opportunities for future happiness and self-development. Divorce is a crisis in the life course of family members that can cause enduring anxieties and psychological issues, but in the self-reflexive manner of late modernity, it also provided subjects possibilities to “grow emotionally,” to “establish new competence and pride” and to “strengthen intimate relationships far beyond earlier capacities.”
Making Connections: Sociological Research
Do Half of All Marriages End in Divorce?

It is often cited that half of all marriages end in divorce. This statistic has made many people cynical when it comes to marriage, but it is misleading. A closer look at the data reveals a different story.
Using Statistics Canada data from 2008 that show a marriage rate of 4.4 (per 1,000 people) and a divorce rate of 2.11, it would appear that slightly less than one-half of all marriages failed (Employment and Social Development Canada, 2014a, 2014b). Similar United States data for 2003 showed more or less exactly 50% of marriages ending in divorce (Hurley, 2005). This reasoning is deceptive, however, because instead of tracing actual marriages to see their longevity (or lack thereof), this compares unrelated statistics. That is, the number of marriages in a given year does not have a direct correlation to the divorces occurring that same year. American research published in the New York Times took a different approach — determining how many people had ever been married, and of those, how many later divorced. The result? According to this analysis, American divorce rates have only gone as high as 41% (Hurley, 2005).
Another way to calculate divorce rates is the total divorce rate, which projects how many new marriages would be expected to fail after 30 years based on the divorce rate by marriage duration observed in a given year. In Canada, the total divorce rate figure reached a high of 50.6% in 1987, after the Divorce Act was amended to allow divorces after just one year of separation (rather than the mandatory three years previously). Since then, the total divorce rate has remained steady at between 35% and 42%. In 2008, 40.7% of marriages were projected to end before their 30th anniversary (Employment and Social Development Canada, 2014a).
Sociologists can also calculate divorce rates through a cohort study. For instance, research could determine the percentage of marriages that are intact after, say, five or seven years, compared to marriages that have ended in divorce after five or seven years. Sociological researchers must remain aware of research methods and how statistical results are applied. As illustrated, different methodologies and different interpretations can lead to contradictory, and even misleading results.
Children of Divorce and Remarriage
Divorce and remarriage can be stressful for partners and children alike. Divorce is often justified by the notion that children are better off in a divorced family than in a family with parents who do not get along. Others argue that parents who divorce sacrifice their children’s well-being to pursue their own happiness.
Research suggests that separating out particular factors of the divorce, especially whether or not the divorce is accompanied by parental conflict, is key to determining whether divorce has a significant negative impact on children (Amato and Keith, 1991). Certainly while marital conflict does not provide an ideal childrearing environment, going through a divorce can also be damaging. Children are often confused and frightened by the threat to their family security. They may feel responsible for the divorce and attempt to bring their parents back together, often by sacrificing their own well-being (Amato, 2000). Only in high-conflict homes do children benefit from divorce and the subsequent decrease in conflict. The majority of divorces however come out of lower-conflict homes, and children from those homes are more negatively impacted by the stress of the divorce than the stress of unhappiness in the marriage (Amato, 2000).
On the other hand, Amato and Keith have argued that the overall the effect of divorce on children’s well-being is relatively weak and has been declining over time. Children of divorces experience higher levels of well-being than children of intact, but highly conflictual marriages Divorces that are not accompanied by parental conflict do less harm to children (Amato and Keith, 1991). These findings would appear to lend credence to modern processes of family mediation in divorces where a neutral third party helps people to negotiate a settlement to their dispute (BC Ministry of Attorney General, 2003).
Children’s ability to deal with a divorce may depend on their age. Research has found that divorce may be most difficult for school-aged children, as they are old enough to understand the separation but not old enough to understand the reasoning behind it. Older teenagers are more likely to recognize the conflict that led to the divorce but may still feel fear, loneliness, guilt, and pressure to choose sides. Infants and preschool-age children may suffer the heaviest impact from the loss of routine that the marriage offered (Temke, 2006).
Proximity to parents also makes a difference in a child’s well-being after divorce. Boys who live or have joint arrangements with their fathers show less aggression than those who are raised by their mothers only. Similarly, girls who live or have joint arrangements with their mothers tend to be more responsible and mature than those who are raised by their fathers only. Nearly 70 per of the children of parents who are divorced have their primary residence with their mother, leaving many boys without a father figure residing in the home. Another 15% of the children lived with their father and 9 per cent moved back and forth between both parents equally (Sinha, 2014). Still, researchers suggest that a strong parent-child relationship can greatly improve a child’s adjustment to divorce (Temke, 2006).
There is empirical evidence that divorce has not discouraged children in terms of how they view marriage and family. In a survey conducted by researchers from the University of Michigan, about three-quarters of high school students said it was “extremely important” to have a strong marriage and family life. Over half believed it was “very likely” that they would be in a lifelong marriage (Popenoe, and Whitehead, 2001). These numbers have continued to climb over the last 25 years.
Violence and Abuse
Violence and abuse are among the most disconcerting of the challenges that today’s families face. Abuse can occur between spouses, between parent and child, as well as between other family members. The frequency of violence among families is difficult to determine because many cases of spousal abuse and child abuse go unreported. In any case, studies have shown that abuse (reported or not) has a major impact on families and society as a whole.
Domestic Violence
Domestic violence is a significant social problem in Canada. One in four victims of violent crime in Canada was victimized by a spouse or family member in 2010 (Sinha, 2012). Domestic violence is often characterized as violence between household or family members, specifically spouses. To include unmarried, cohabitating, and same-sex couples, sociologists have created the term intimate partner violence (IPV). Women are the primary victims of intimate partner violence. It is estimated that 1 in 4 women has experienced some form of IPV in her lifetime (compared to 1 in 7 men) (Catalano, 2007). In 2011, women in Canada had more than double the risk of men of becoming a victim of police-reported family violence (Sinha, 2012). IPV may include physical violence, such as punching, kicking, or other methods of inflicting physical pain; sexual violence, such as rape or other forced sexual acts; threats and intimidation that imply either physical or sexual abuse; and emotional abuse, such as harming another’s sense of self-worth through words or controlling another’s behaviour. IPV often starts as emotional abuse and then escalates to other forms or combinations of abuse (Centers for Disease Control, 2012).

In 2010, of IPV acts that involved physical actions against women, 71% involved physical assault (57% were common assaults including punching, slapping, and pushing, while another 10% were major assaults involving a weapon or causing major bodily injury); 3 per cent involved sexual assault; 10% involved uttering threats; 5 per cent indecent or threatening phone calls; and 9 per cent criminal harassment or stalking (Sinha, 2012). This is slightly different than IPV abuse patterns for men, which show that 79% of acts of IPV take the form of physical violence, and less than 1 per cent involve sexual assault (Sinha, 2012). Interestingly, in 2011, a slightly larger proportion of physical assaults against male intimate partners resulted in injury (55%) compared to female intimate partners (51% (Sinha, 2013). IPV affects women at greater rates than men because women often take the passive role in relationships and may become emotionally dependent on their partner. Perpetrators of IPV work to establish and maintain such dependence in order to hold power and control over their victims, making them feel stupid, crazy, or ugly — in some way worthless. Between 2000 and 2010, nearly one-quarter of women who were murdered by their intimate partners were murdered for reasons of jealousy — compared to 10% of male victims (Sinha, 2012).
IPV affects different segments of the population at different rates. The rate of self-reported IPV for Aboriginal women is about 2.5 times higher than for non-Aboriginal women (Sinha, 2013). The severity of intimate partner violence also differed. Nearly 6 in 10 Aboriginal women reported injury as a result of IPV compared to 4 in 10 non-Aboriginal women. As a result, Aboriginal female victims were also much more likely to report that they feared for their lives as a result of IPV (52% compared to 31% of non-Aboriginal women) (Sinha, 2013). On the other hand, visible minority and immigrant groups do not have significantly different levels of self-reported spousal violence than the rest of the population (Statistics Canada, 2011).
Those who are separated report higher rates of abuse than those with other marital statuses, as conflict is typically higher in those relationships. Similarly, those who are cohabitating or living in a common-law relationship are more likely than those who are married to experience IPV (Statistics Canada, 2011). American researchers have found that the rate of IPV doubles for women in low-income disadvantaged areas when compared to IPV experienced by women who reside in more affluent areas (Benson and Fox, 2004). In Canada, the statistics do not bear this relationship out. Household income and education levels appear to have little effect on experiencing spousal violence. Regardless of income level, the proportion of reported spousal violence was between 1 and 2 per cent. However, rates of IPV were nearly double in rural Canada than in the major metropolitan areas (542 incidents per 100,000 population compared to 294). Overall, women ages 25 to 34 are at the greatest risk of physical or sexual assault by an intimate partner (Statistics Canada, 2011).
Accurate statistics on IPV are difficult to determine, as less than one-quarter of victims report incidents to the police (Statistics Canada, 2011). It is not until victims choose to report crimes that patterns of abuse are exposed. Two-thirds of victims in Statistics Canada self-reported victimization studies stated that abuse had occurred more than once prior to their first police report. Nearly 3 in 10 stated that they had been abused more than 10 times prior to reporting (Statistics Canada, 2011).
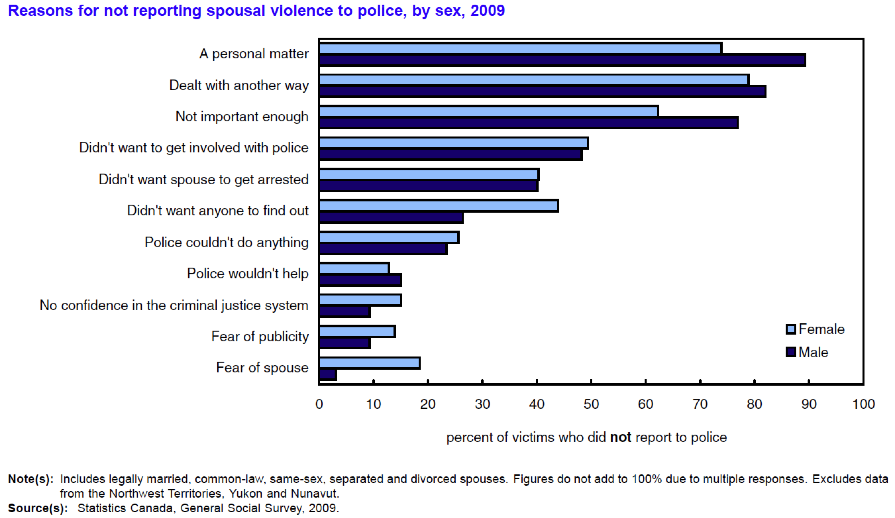
According to the Statistics Canada General Social Survey (2009) , victims cite varied reasons why they are reluctant to report abuse, as shown in the table in Figure 14.22.
IPV has significant long-term effects on individual victims and on society. Studies have shown that IPV damage extends beyond the direct physical or emotional wounds. Extended IPV has been linked to unemployment among victims, as many have difficulty finding or holding employment. Additionally, nearly all women who report serious domestic problems exhibit symptoms of major depression (Goodwin, Chandler, and Meisel, 2003). Female victims of IPV are also more likely to abuse alcohol or drugs, suffer from eating disorders, and attempt suicide (Silverman et al., 2001).
IPV is indeed something that impacts more than just intimate partners. In a survey, 34% of respondents said they have witnessed IPV, and 59% said that they know a victim personally (Roper Starch Worldwide, 1995). Many people want to help IPV victims but are hesitant to intervene because they feel that it is a personal matter or they fear retaliation from the abuser — reasons similar to those of victims who do not report IPV.
Making Connections: Social Policy and Debate
Corporal Punishment

News reports in June 2013 broke the sensational story of dozens of children being apprehended by Child and Family Services from a small Old Order Mennonite community in southern Manitoba. Several members of the community were charged by police with assault when they received reports that children had been disciplined using a leather strap, whip, and cattle prod (Hitchen, 2013). At one point, all the children except for one 17-year-old had to be apprehended by authorities (CBC News, 2013). The 1892 law that permits the use of corporal punishment for children in Canada was upheld by a Supreme Court ruling in 2004 within certain restrictions, but corporal punishment remains a controversial issue in Canada (CBC News, 2004).
Physical abuse of children may come in the form of beating, kicking, throwing, choking, hitting with objects, burning, or other methods. Injury inflicted by such behaviour is considered abuse even if the parent or caregiver did not intend to harm the child. Other types of physical contact that are characterized as discipline (spanking, for example) are not considered abuse as long as no injury results. The Supreme Court ruling stated that teachers and parents can use reasonable corrective force against children between the ages of 2 and 12 years old as long as the force is “minor” and of “a transitory and trifling nature” (CBC News, 2004). The court ruled that it was unacceptable to strike a child with an object, like a strap or whip, and striking a child in the head was also unacceptable.
This issue is controversial among modern-day Canadians. While some parents feel that physical discipline, or corporal punishment, is an effective way to respond to bad behaviour, others feel that it is a form of abuse. According to a 2005 study of mothers with preschoolers in Manitoba and Ontario, 70% of respondents reported using corporal punishment. One-third of them used it at least once a week. A poll conducted by the Globe and Mail in 2007 found that 78% of Canadian parents with children under 18 believed that parents do not discipline their children enough, and another 42% believed spanking benefited child development (Pearce, 2012).
However, studies have shown that spanking is not an effective form of punishment and may lead to aggression by the victim, particularly in those who are spanked at a young age (Berlin, 2009). A meta-analysis of research conducted over two decades published in the Canadian Medical Association Journal found that spanking was no better than other parenting methods at eliciting compliance in children and was in fact linked not only to increased levels of childhood aggression but also to long-term effects such as depression, emotional and behavioural problems, and drug and alcohol use in adulthood (Durrant and Ensom, 2012). This research led the editor-in-chief of the journal to call for the repeal of the spanking law from the Criminal Code. “It is time for Canada to remove this anachronistic excuse for poor parenting from the statute book” (Fletcher, 2012, p. 1339).
Child Abuse and Corporal Punishment
Children are among the most helpless victims of abuse. In 2010, more than 18,000 children and youth under the age of 17 were victims of police-reported family violence in Canada, accounting for nearly a quarter of all violent offences against children and youth (Sinha, 2012). Child abuse may come in several forms, the most common being neglect, followed by physical abuse, sexual abuse, psychological maltreatment, and medical neglect (Child Help, 2011). Whereas the overall rate of violent crime involving children and youth is lower than the rate for the population as a whole, the rate of sexual assault is five times higher (Sinha, 2012). Level 1 sexual assault (not involving a weapon or aggravated assault) comprised 75% of these offences, while child-specific sexual crimes including sexual interference, invitation to sexual touching, luring a child via a computer, and corrupting children comprised another 22%. Girls were 37% more likely than boys to be the victim of family violence (and almost twice as likely by the time they reached ages 12 to 17 years). In large part, this is because girls are almost four times as likely to be a victim of sexual assault by a family member than boys are.
Twenty-five per cent of all violent crime against children and youth was perpetrated by a family member (parent, sibling, extended family member, or spouse), while another 54% involved an accused known to the victim (casual acquaintances, close friends, or dating partners) (Sinha, 2012). Fifty-nine per cent of family violence against children was committed by parents, 19% by siblings, and 22% by other family members (Statistics Canada, 2011). Understandably, these figures vary with the age of the child. As Sinha (2012) notes, “among youth aged 12 to 17 who had been victimized, about one in five (18%) were violently victimized by someone within their own family network. This compares to 47% of child victims aged 3 to 11 years, and 70% of infant and toddler victims under the age of 3 years.”
In terms of child abuse reported to provincial and territorial child welfare authorities, infants (children less than 1 year old) were the most victimized population with an incident rate of 52 investigations per 1,000 children, compared to 43 per 1,000 for 1- to 3-year-olds, the next highest category (Public Health Agency of Canada, 2010). Infants younger than 1 year are also the most vulnerable to family homicide, 98% of which were committed by parents (27 per million between 2000 and 2010, compared to 9 per million for 1-to 3-year olds, the next highest category) (Sinha, 2012). This age group is particularly vulnerable to neglect because they are entirely dependent on parents for care. Some parents do not purposely neglect their children; factors such as cultural values, standard of care in a community, and poverty can lead to hazardous levels of neglect. If information or assistance from public or private services are available and a parent fails to use those services, child welfare services may intervene (Public Health Agency of Canada, 2010).

Infants are also often victims of physical abuse, particularly in the form of violent shaking. This type of physical abuse is referred to as shaken-baby syndrome, which describes a group of medical symptoms such as brain swelling and retinal hemorrhage resulting from forcefully shaking or causing impact to an infant’s head. A baby’s cry is the number one trigger for shaking. Parents may find themselves unable to soothe a baby’s concerns and may take their frustration out on the child by shaking him or her violently. Other stress factors such as a poor economy, unemployment, and general dissatisfaction with parental life may contribute to this type of abuse. Shaken-baby syndrome was attributed as the cause of nearly one-third (31%) of family-related homicides of infants less than 1 year between 2000 and 2010 (Sinha, 2012).
Image Descriptions
Figure 14.22 image description:
| Reason for not reporting spousal abuse | Percentage of men who did not report (%) | Percentage of women who did not report (%) |
|---|---|---|
| A personal matter | 90 | 75 |
| Dealt with another way | 82 | 77 |
| Not important enough | 76 | 64 |
| Didn’t want to get involved with police | 49 | 50 |
| Didn’t want spouse to get arrested | 41 | 41 |
| Didn’t want anyone to find out | 28 | 44 |
| Police couldn’t do anything | 24 | 26 |
| Police wouldn’t help | 15 | 12 |
| No confidence in the criminal justice system | 10 | 15 |
| Fear of publicity | 10 | 13 |
| Fear of spouse | 3 | 19 [Return to Figure 14.22] |
Media Attributions
- Figure 14.20 Old Ebbit Grill by Daniel Lobo, via Flickr, is used under a CC BY 2.0 licence.
- Figure 14.21 Creating the crime scene by Kathy Kimpel [kkimpel], via Flickr, is used under a CC BY 2.0 licence.
- Figure 14.22 Chart 1.1 Victims of self-reported spousal violence within the past 5 years, by province, 2009, in Family Violence in Canada: A Statistical Profile [PDF], Statistics Canada Catalogue no. 85-224-X (p. 9), is used under the Statistics Canada Open Licence. [Original data source: Statistics Canada, General Social Survey, 2009.]
- Figure 14.23 You’ve got to be cruel to be kind… by HA! Designs – Artbyheather, is used under a CC BY 2.0 licence.
- Figure 14.24 This CT scan is an example of Subdural haemorrhage caused by trauma, by Glitzy queen00 at English Wikipedia, via Wikipedia, has been released into the public domain by its author.
