Chapter 9. Social Inequality
9.2. Social Inequality
Sociologists define social class as a grouping based on the relationship to the means of production or productive property (i.e., capital). However, individuals’ subjective experience of class in 21st century Canada is defined largely by the sense of sharing similar social characteristics like wealth, income, education, occupation, and lifestyle. As noted above, there is dispute within sociology about the relative importance of different criteria for characterizing economic class position. Whether the Marxist emphasis on property ownership is more important than the Weberian emphasis on gradations of occupational status is a matter for debate. Each definition captures some aspects of the experience of inequality in modern society but misses others. Either way, the concept of class implies a shared standard of living based on social factors like wealth, income, education, and occupation. These factors also affect how much power and prestige a person has. In most cases, having more money means having more power, privileges, and opportunities.
Standard of Living

“When you’ve set up a place to sleep for the night, someone comes along and threatens you or forces you to leave, it’s no way to live. It’s tiring to be forced to move every day or every night when you’re cold and wet and have no place to go.” (Testimony of Drug War Survivors member Harvey Clause, as quoted in Hollett, 2015)
In the last century, Canada has seen a steady rise in the standard of living: the level of wealth available to acquire the material necessities and comforts to maintain one’s lifestyle. Osberg (2021) reports that in the post-war era, the Gross Domestic Product (GDP) per capita in Canada went from $16,179 in 1946 to $60,918 in 2019; an increase in standard of living of almost 400%.
The standard of living is unevenly distributed, however, based on factors such as income, employment, class status, poverty rates, and affordability of housing. Because standard of living is closely related to quality of life, it can represent factors such as the ability to afford a home, own a car, and take vacations. It affects health and longevity.
Similarly, access to a standard of living that enables people to participate on an equal basis in community life is not equally distributed. The irony of rising standards of living is that one does not have to live in absolute poverty — “a severe deprivation of basic human needs, including food, safe drinking water, sanitation facilities, health, shelter, education and information” (United Nations, 1995) — to be marginalized and socially excluded. Relative poverty refers to the minimum amount of income or resources needed to participate in the “ordinary living patterns, customs, and activities” of a society (Townsend, 1979). People do not need to be destitute to experience the exclusions of living in relative poverty in a wealthy society like Canada.
In Canada, a small portion of the population has the means to the highest standard of living. Statistics Canada data from 2012 showed that only 20% of the population earned 50% of all income and held 70% of Canadian’s wealth (Macdonald, 2014). In 2016, the top 87 families held as much wealth as the lowest 12,000,000 Canadians, about one third of the population. The top 87 families were, on average, 4,448 times wealthier than the average Canadian, and 10,000 times wealthier than the median Canadian (the Canadian who was exactly in the middle of the wealth distribution in the country) (Macdonald, 2018). Wealthy people receive the most schooling, have better health, and consume the most goods and services.
Wealthy people also wield decision-making power. One aspect of their decision-making power comes from their positions as owners or top executives of corporations and banks. They are able to grant themselves salary raises and bonuses. By 2010, only two years into the economic crisis of 2008, the executive pay of CEOs at Canada’s top 100 corporations jumped by 13% (McFarland, 2011), while negotiated wage increases in 2010 amounted to only 1.8% (HRSDC, 2010). Executive pay has steadily increased since then (Macdonald, 2021).
Many people think of Canada as a “middle class” society. They think a few people are rich, a few are poor, and most are pretty well off, existing in the middle of the social strata. But as the data above indicate, the distribution of wealth is not even. Millions of women and men struggle to pay rent, buy food, and find work that pays a living wage. Moreover, the share of the total income claimed by those in the middle-income ranges has been shrinking since the early 1980s, while the share taken by the wealthiest has been growing (Osberg, 2021).
Making Connections: Sociological Research
Measuring Levels of Poverty
Statistics Canada produces two relative measures of poverty: the low income measure (LIM) and the low income cut-off (LICO) measure. In 2019, a third, absolute measure of poverty — the market basket measure (MBM) — was adopted as Canada’s Official Poverty Line. According to the MBM, a family lives in poverty if it does not have enough income to purchase a specific basket of goods and services in its community. Sociologists need to be careful in choosing which measure of poverty they use, because each measure produces different estimates of the number of poor in Canada.
Low income measure (LIM): The LIM is defined as half the median family income. A person whose income is below that level is said to be on a low income. The LIM is adjusted for family size.
Low income cut-off (LICO): The LICO is the income level below which a family would devote at least 20 percentage points more of their income to food, clothing, and shelter than an average family would. People are said to be in the low income group if their income falls below this threshold. The threshold varies by family size and community size, as well as if income is calculated before or after taxes. For example, a single individual in a city with a population of over 500,000 would be said to be living with a low income if their 2019 after-tax income was below $21,899.
Market basket measure: The MBM is a measure of the disposable income a family would need to be able to purchase a basket of goods that includes food, clothing, shelter, transportation, and other basic needs. The dollar value of the MBM varies by family size and composition, as well as community size and location. MBM data are available since 2000 only.
The three measures produce different results. In 2009, according to each measure, the following numbers of Canadians were living in low income:
- LICO—3.2 million (9.6% of the population)
- MBM—3.5 million (10.6%)
- LIM—4.4 million (13.3%)
Figure 9.14 shows, in a table format, how the three measures also produce different results over time. Using the LICO measure results in a decreasing share of people in low income from 1996 to 2007, followed by a slight upturn in 2008 and 2009. The LIM measure results in a share of people in low income that has increased since 1990. The MBM, which has data starting only in 2000, shows results similar to the LICO but with a sharper upturn in 2008 and 2009.
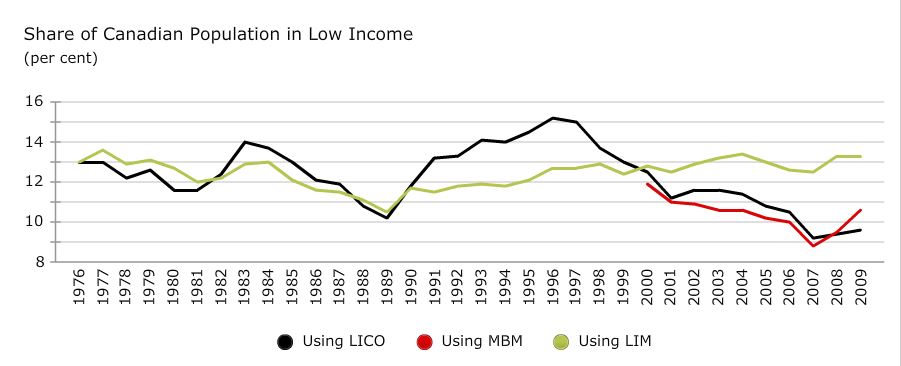
Figure 9.14 and Figure 9.15, from 2019 (Statistics Canada, 2021), show that the poverty rate declined from 2018 based on the MBM and LIM measures. According to the market basket measure (MBM), about 3.7 million Canadians, or 10.1% of the population, lived below the poverty line in 2019, down from 11.0% in 2018, whereas the low income measure (LIM) recorded about 4.5 million Canadians, or 12.1% of the population in 2019, slightly down from 12.3% in 2018. Depending on which measure a sociologist uses, the estimated numbers of the poor vary significantly.
Trends in Social Inequality
Sociological research into inequality shows that the gap in income and wealth between the rich and the poor has been increasing in Canada over the last 40 years (Osberg, 2021). In 1982, the median income earner in the top 1% of incomes earned seven times more than the median income earner in the other 99%. In 2010, the median income earner in the top 1% earned ten times more. Moreover, while the median income for the top 1% increased from $191,600 to $283,000 in constant dollars (i.e., adjusted for inflation), the median income for the bottom 99% only increased from $28,000 to $28,400 (Osberg, 2008). In the early 1980s, the top 1% of income earners accounted for 7% of the total income generated in Canada, whereas in 2010 they accounted for 10.6%, down slightly from 12.1% in 2006 (Statistics Canada, 2013).
This is similar to the trend in the United States and the United Kingdom. In the US, the top 1% share went from 10.7% to 19.8%, and in the United Kingdom from 5.9% to 12.5% over the same time period (Alvaredo et al. 2018). In Canada, between 1981 and 2019, the average income of the top 1% doubled whereas for those between the median and the 90th percentile income increased only 10% and actually declined for those in the bottom half of the income distribution (Osberg, 2021). For the most wealthy, the top 0.01%, the average income gain was $5,187,956 — a 189% increase during this period. In effect, the incomes for middle-income earners remained flat over the last 40 years, while the incomes for the top 1% increased significantly both in absolute terms and as a proportion of all incomes.
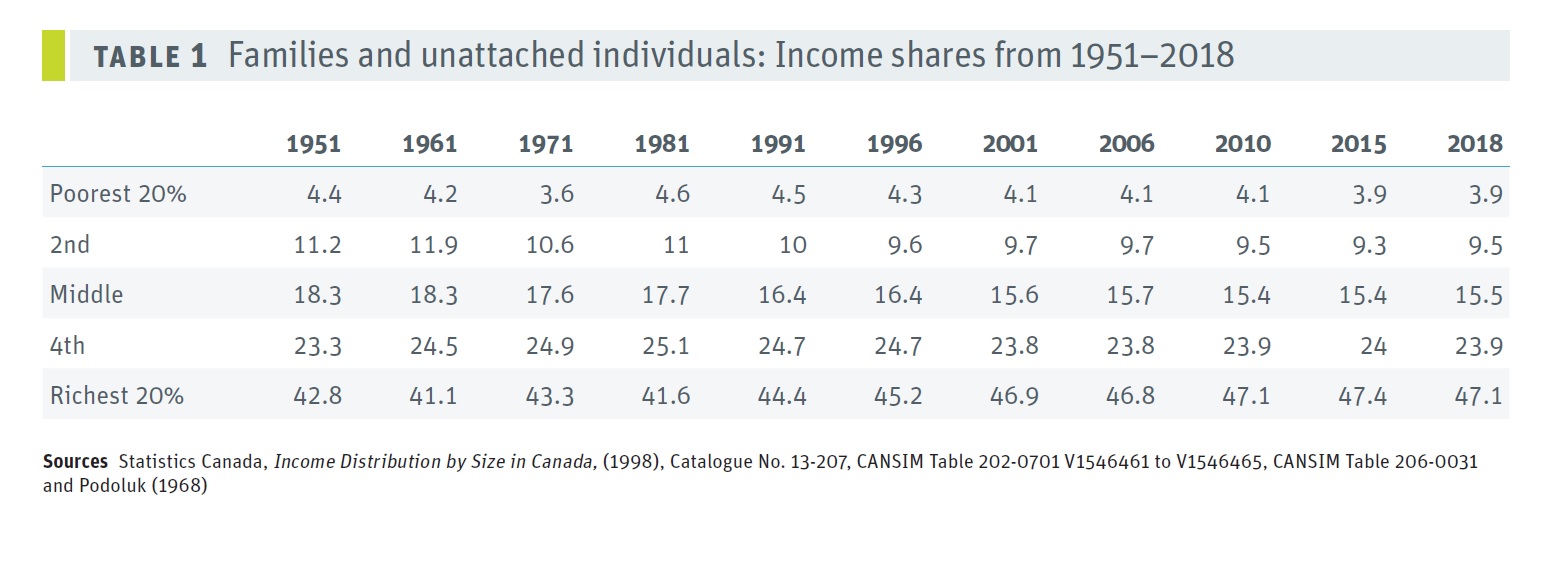
This discrepancy does not simply mean that the very rich are increasing their share of the wealth at the expense of the very poor — the middle classes are also losing their share of the wealth. One way to analyze this trend is to examine the changing distribution of income in Canada over time. In Figure 9.15 (labelled Table 1, above), changes in inequality are measured by looking at how the total annual income is distributed between each fifth (or “quintile”) of Canadian families from the lowest earning to highest earning for different years (Osberg, 2008). If perfect equality of income existed, each quintile would have earned exactly 20% of the total income. Instead, Figure 9.15 shows that between 1951 and 1981 the top 20% of family units received around 42% of total income, but after 1981 this figure steadily increased to 47%. On the other hand, the share of income of the middle 60% of families declined by 4.7%, going from 53.8% in 1981 to 48.9% in 2018. The lowest 20% also lost 0.7% of their already tiny share, going from 4.6% to 3.9%. Although the majority of people in Canada have not seen any growth in real income in four decades, the average income of the top 1% grew by about 200% (Osberg, 2021). Over the period from 1980–2010, the share of the total income received by the top 1% has doubled, the top 0.1% has tripled, and the top 0.01% has quintupled (Yalnizyan, 2010).
Why is this news? For several decades, Lars Osberg notes that the joke was that the study of income inequality was like watching grass grow because nothing ever happened (2008). Between 1946 and 1981, changes in income inequality were small despite the fact the Canadian economy went through a massive transformation. It went from an agricultural base to an industrial base; the population urbanized and doubled in size; the overall production of wealth measured by the GDP increased by 4.5%; and per capita output increased by 227% (Osberg, 2008). As Osberg puts it, the key question was why did economic inequality not change during this period of massive transformation? From 1981 until the present, during another period of rapid and extensive economic change in which the overall production of wealth continued to expand, economic inequality has increased dramatically. What happened?
The main explanatory factor is that between 1946 and 1981 real wages increased in pace with the growth of the economy, but since 1981 only the top 20% of families have seen any meaningful increase in real income while the very wealthy have seen huge increases. The taxable income of the top 1% of families increased by 80% between 1982 and 2004 (Osberg, 2008). Neo-liberal policies of reduced state expenditures and tax cuts have been major factors in defining the difference between these two eras. The neo-liberal theory that tax cut benefits to the rich would “trickle down” to the middle class and the poor has proven false. The biggest losers with regard to neo-liberal policy, of course, are the very poor. As Osberg notes, it was not until the 1980s and 1990s that the homeless — those forced to beg in the streets and those dependent on food banks — began to appear in Canada in significant numbers (2008).
Measuring Degrees of Social Inequality
Some have argued that to the degree that equality of opportunity exists, inequality of condition or inequality of “outcome” is perhaps not fair, but it is justifiable. Others have argued that because capitalism is built on the basis of structural inequality, equality of conditions is impossible and growing inequality is inevitable. The idea that equality of opportunity or meritocracy, actually exists and that it leads to a meaningful access to social mobility, the free movement of people from one social position to another, is debatable, as is discussed below. But it is important to note that even if total equality of condition — a world where everyone’s social position and financial rewards would be exactly the same — is unlikely, varying degrees of social inequality are possible. In fact, degrees of social inequality vary significantly historically and between countries based on social policy decisions.
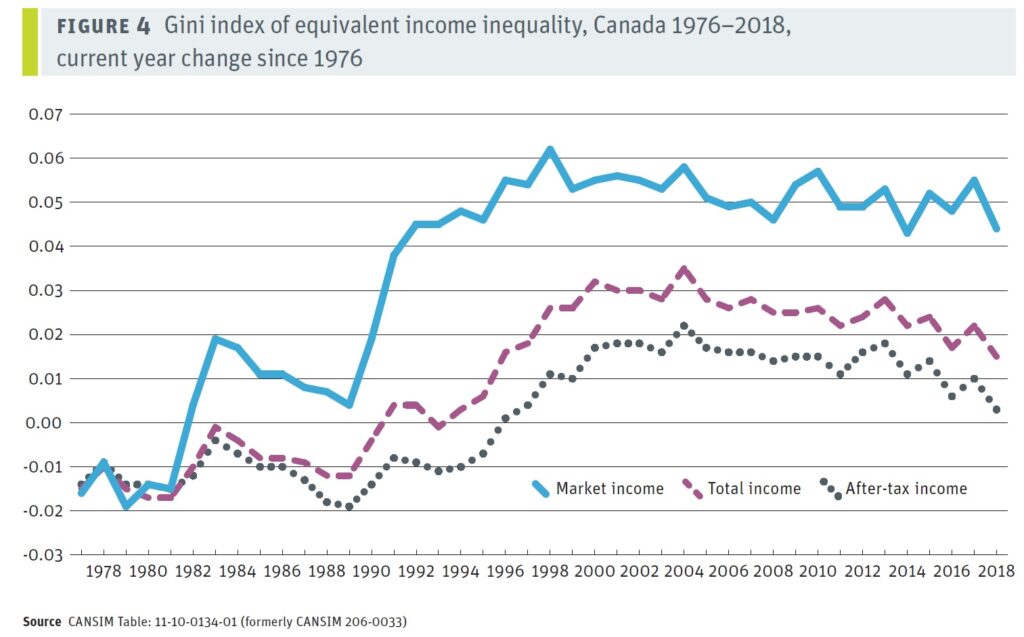
The Gini Index is a measure of income inequality in which zero is absolute equality and one is absolute inequality. The table in Figure 9.16 represents the percentage change in the Gini Index from 1976 to 2018. It shows that Canada’s degree of inequality based on market income increased by 5% between 1980 and 2018 (Osberg, 2021).
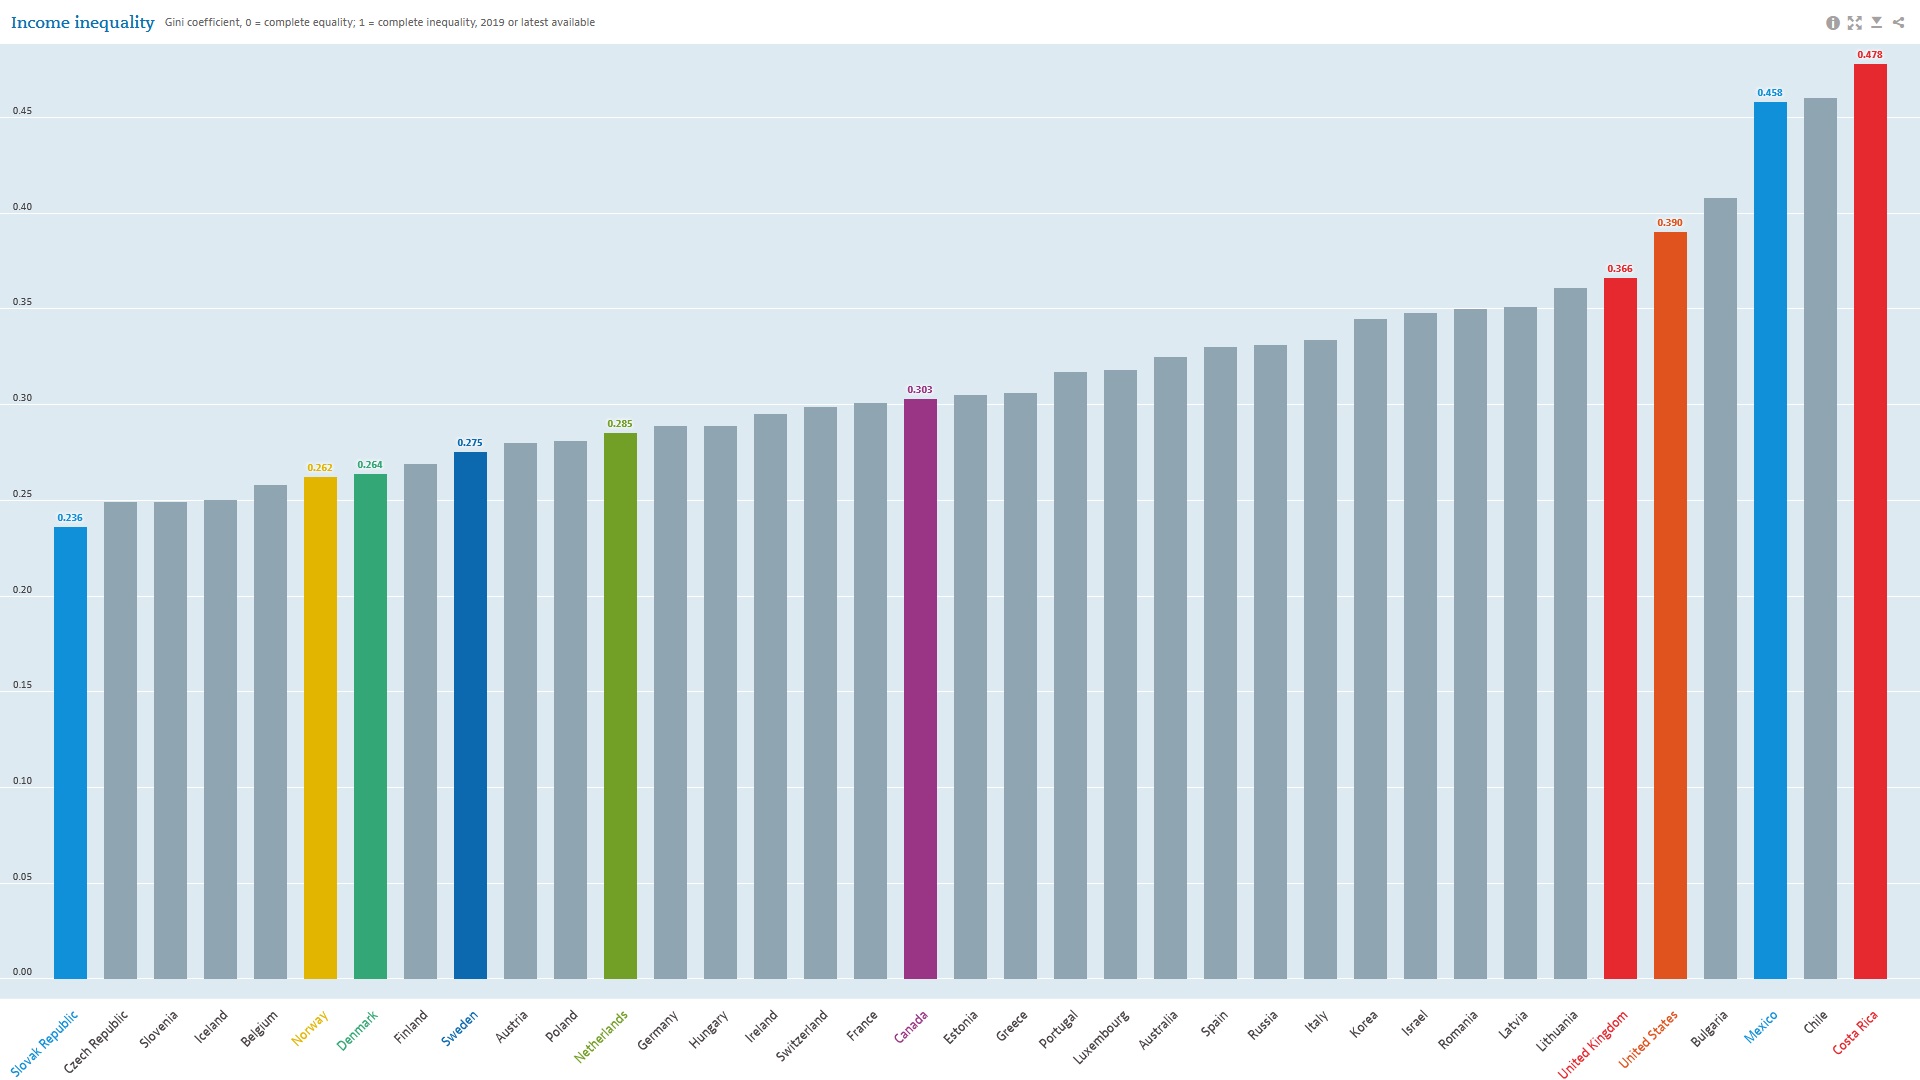
For a comparative perspective, see the bar graph in Figure 9.17. Canada’s Gini Index (0.303) is much higher than many European countries but is lower than the extremes of inequality in the United States (0.390) and Mexico (0.458), who are Canada’s free trade partners in the United States–Mexico–Canada Agreement (USMCA). This comparison indicates that a much greater equality of conditions can exist even under the same pressures of globalization if different social and economic policy models are chosen. Even though the countries with some of the lowest levels of inequality — Norway (0.262), Denmark (0.264), Sweden (0.275), and the Netherlands (0.285) — have progressive tax systems and strong welfare states, they are able to maintain high levels of employment and economic growth while remaining “competitive” in the global economy (Osberg, 2010). If addressing poverty and inequality rather than promoting tax policies that transfer wealth to the rich is a reasonable goal, a variety of viable policy alternatives are available from which Canadians can choose.
Media Attributions
- Figure 9.12 Genius Scheme by Kyle Pearce, via Flickr, is used under a CC BY-SA 2.0 licence.
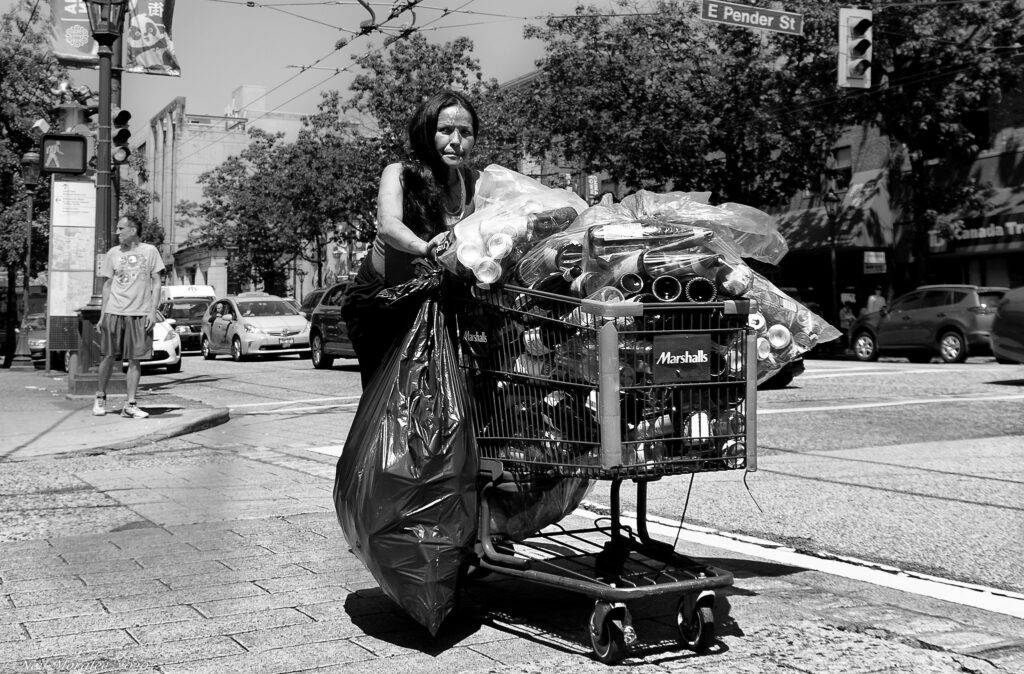
- Figure 9.13 No Place for Heroe’s by Neil Moralee, via Flickr, is used under a CC BY-NC-ND 2.0 licence.
- Figure 9.14 “Measuring Levels of Poverty” excerpted from The Conference Board of Canada Canadian Income Inequality: Is Canada becoming more unequal? (2011), used under the Conference Board of Canada’s Terms of Use.
- Figure 9.15 Table 1: Families and unattached individuals: Income shares from 1951–2018 by Osberg (2021, p. 18) is used under the CC BY-NC-ND 3.0 licence on the CCPA website.
- Figure 9.16 Gini Index of Inequality: 1976-2018 [Figure 4] by Osberg (2021, p. 16) is used under the CC BY-NC-ND 3.0 licence on the CCPA website.
- Figure 9.17 OECD, 2019, Gini Coefficients of Income Concentration in 37 OECD Countries, Income Inequality Data, https://doi/10.1787/459aa7f1-en, is used under the OECD Terms and Conditions for Data.
