Chapter 9. Social Inequality
9.3 Social Classes in Canada
The concept of social class was discussed earlier in the chapter. Below, the major divisions of Canadian social class and their key subcategories are developed in more detail.
The Owning Class
The owning class is considered Canada’s highest elite. Members of the owning class can afford to live, work, and play in exclusive places designed for luxury and comfort. Only the very powerful get to see the view from there. In Canada, the richest 87 families account for 0.002% of the population, but in 2016 they had accumulated the equivalent wealth of everyone in Newfoundland and Labrador, Prince Edward Island and New Brunswick combined (including all savings, investments, pensions, houses, cottages, cars, etc. minus mortgages and debts). The combined net worth of these 87 families added up to $259 billion in 2016, which equaled the net worth of the lowest 12 million Canadians (Macdonald, 2018).
What is the source of the owning class’s wealth? Among the wealthiest families in Canada are also many of the top paid CEOs in the country. For example, among the top 20 wealthiest families, including the Thomsons, Westons, Saputos, Desmarais and Southerns, are nine of the 100 top paid CEOs in the country (Macdonald, 2018). In 2019, the average income of the top 100 CEOs in Canada was $10.8 million (Mcdonald, 2021). It is significant that a large portion of this income is paid in the form of non-cash bonuses like corporate shares and stock options because these are taxed at half the rate of salaries and cash bonuses. In 2019, only 12% of top-100 CEO pay came in the form of a salary while 82% of it came in some form of a bonus.
But income from work is not the most important source of wealth for the owning class. In Marx’s definition, it is ownership of capital that distinguishes the owning class from the other classes. Ownership of capital increases wealth in three primary ways: (1) capital gains from the buying and selling of assets such as businesses or real estate; (2) dividends from corporate investments and stock shares; (3) interest from investments, such as savings, bonds and GICs (Guaranteed Investment Certificates) (Macdonald, 2018). In Canada, income generated from capital gains and corporate dividends is taxed at about 50% and 75%, respectively, of the tax rate for ordinary wage labour income. In addition, the owning class benefits from numerous “aggressive tax planning approaches” like the use of private corporations, trusts and offshore tax havens to hide income from Canadian taxation (Macdonald, 2018).
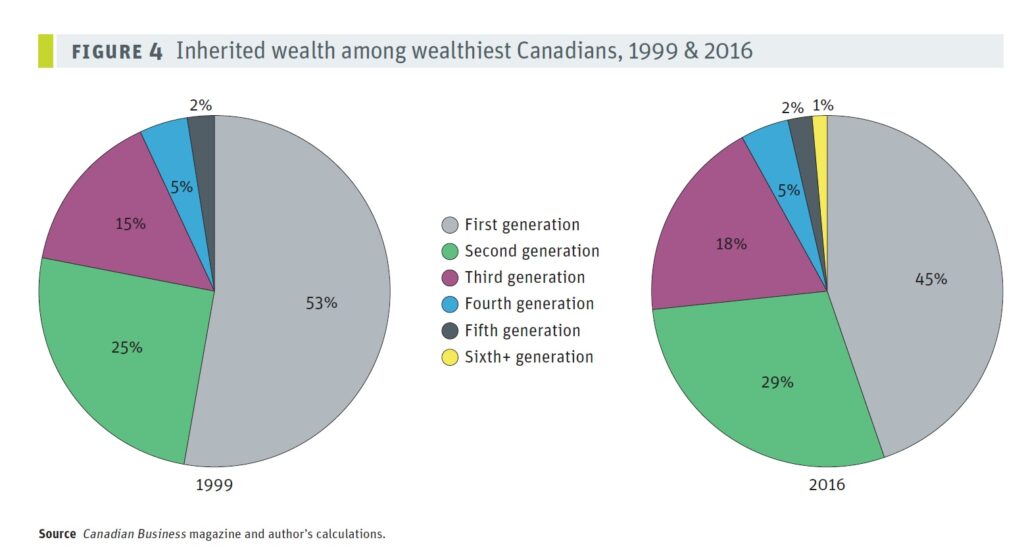
Finally, inheritance is also a key source of the owning class’ wealth. In 2016, within the wealthiest 87 families, 39 (45%) were first generation wealth holders, meaning that they did not inherit their wealth, whereas the other 55% did, sometimes through multiple generations (see Figure 9.14). Incidentally, Canada is the only country in the G7 without inheritance taxes.
Canadian society has historically distinguished between “old money” (inherited wealth passed from one generation to the next) and “new money” (first generation wealth holders). While both types may have equal net worth, they have traditionally signified different social standing. People of old money, firmly situated in the upper class for generations, hold high prestige. Their families have socialized them to know the customs, norms, and expectations (or habitus) that come with wealth. New money members of the owning class are not oriented to the customs and mores of the elite. They have not gone to the most exclusive schools. They have not established old money social ties. As a result, people with new money are often ostentatious, flaunting their wealth by buying sports cars and mansions, for example, while still exhibiting behaviours attributed to the middle and lower classes. Toronto politicians Rob and Doug Ford are estimated to hold family assets worth $50 million, yet they present themselves as just “average guys” who stand with their blue-collar constituents against “rich elitist people” (McArther, 2013; Warner, 2014). Before his death in 2016, Rob Ford’s infamous crack cocaine smoking, public binge drinking, and use of foul language would not have made him at home within the circles of old money in Canada, even if they otherwise shared similar class interests and goals.
Wealth provides not just access to material goods, but also access to power. Canada’s owning class wields a lot of power. Whereas democracy works on the one person, one vote principle, corporations work on the principle that each share gives its owner a vote in corporate decision making. However, as share ownership is highly concentrated among a few major shareholders, including wealthy families, corporations, and institutional investors, these few shareholders effectively control corporate decision making. As corporate leaders, their investment decisions affect the job status of millions of people. As media owners, they shape the narratives of current events and the collective identity of the nation. As philanthropists, they establish foundations to support social causes they believe in. They also fund think tanks like the C. D. Howe Institute and the Fraser Institute which promote the values and interests of business elites. As campaign contributors, they influence politicians and fund campaigns, which partially explains why tax policies in recent decades have been crafted to serve their economic interests.
Making Connections: Social Policy and Debate
Fractions of the Capitalist Class: The Rise of Carbon Capital
Just as social inequality has been growing in Canada, corporate concentration has also been growing. Brennan (2012) showed that the share of corporate profit of the 60 largest Canadian corporations on the Toronto Stock Exchange increased from 35% in 1961 to 60% in 2010. Fewer corporations are controlling the wealth generated in Canada.
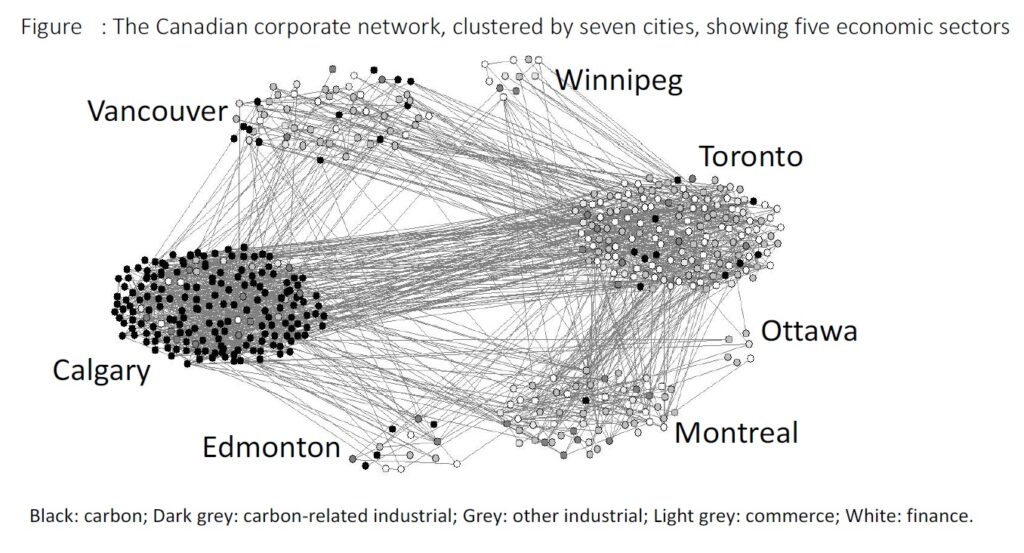
But it is interesting that the owning class, small as it is, is not completely unified in its hegemonic interests. Hegemony refers to the ability of a dominant group in society to secure consent to its rule by successfully presenting its own interests, values, and norms as the common sense values of everybody. There is often conflict between different “fractional” interests that make up the owning class. In Weber’s definition of class, the “life chances” one shares in common with others by virtue of one’s possession of goods or opportunities for income defines ones class position. As the value of different types of capital or property (e.g., industrial, real estate, financial, etc.) goes up and down according to changes in the market, it means that the interests of different types or fractions of capital do not coincide.
In his study of the rise to prominence of “carbon capital” — the oil and gas sector in Canada — Carroll (2017/2021) notes that there are at least five distinct class interests or fractions within Canada’s owning class, based on competing sectors of the economy: (1) carbon capital, (2) carbon-related industrial capital, including petrochemicals, electricity, steel, transport and the automobile industry, (3) Non-carbon industry, including non-carbon resource extraction, pharmaceuticals and biotech, food and beverage production, equipment manufacture, software, communication and media, (4) commercial capital, including chain stores and the sale of commodities, retail goods and services, and (5) finance capital, including banking, loans, insurance, financial products and services (see Figure 9.15).
These interests do not necessarily coincide. For example, the dominance of the interests of carbon capital in the Canadian economy lead to a Canadian version of the process referred to as the “Dutch disease.” International investment of capital in Alberta oil and gas drove up the value of the Canadian dollar at the expense of manufacturing in Ontario, which struggled to find markets for its suddenly expensive Canadian-manufactured products. Similarly, the subsequent collapse in international markets for oil and gas lead to capital flight from Canada, as international investors withdrew their capital from Canada to invest in more profitable ventures elsewhere in the world. This had negative consequences for the entire economy, but a lower exchange rate with the US benefited export-oriented manufacturing interests in Eastern Canada.
Overall, the hegemonic dominance of the carbon sector in Canada through the first two decades of the 21st century has meant that the interests of carbon capital segment of the owning class are represented as the interests of all Canadians. From a critical sociological perspective, this poses obstacles to transitioning to “a socially just, low-carbon future” in response to climate change (Carroll, 2017/21).
The Middle Class and the Traditional Working Class

Many people call themselves middle class, but there are differing ideas about what that means. People with annual incomes of $150,000 call themselves middle class, as do people who annually earn $30,000. That helps explain why some sociologists divide the middle class into upper and lower subcategories. But is the middle class actually a class grouping or is it a status grouping?
The divisions of “upper” and “lower” are largely based on gradations of status defined by levels of education, types of work, types of cultural capital, and the lifestyles afforded by income. Therefore upper-middle-class people tend to hold bachelor’s and postgraduate degrees in subjects such as business, management, law, or medicine that lead to occupations in the professions. Professions are occupations that claim high levels of specialized technical and intellectual expertise and are governed and regulated by autonomous professional organizations (like the Canadian Medical Association or legal bar associations). Lower-middle-class members hold bachelor’s degrees or vocational associate’s degrees from two-year community or technical colleges that lead to various types of white-collar, service, administrative, or paraprofessional occupations that do not hold the same level of prestige and power over working conditions of professions.
The common denominator that ties the two categories together is the status of white-collar occupations. White-collar refers to the traditional white-collared shirts worn by employees engaged in various types of “mental” or non-manual work, including professional, intellectual, technical, service and administrative work.
On this basis the middle class can be distinguished from the traditional working class. The traditional working class is usually equated with blue-collar types of jobs: “wage-workers who are engaged in the production of commodities, the extraction of natural resources, the production of food, the operation of the transportation network required for production and distribution, the construction industry, and the maintenance of energy and communication networks” (Veltmeyer, 1986, p. 83). The work is considered blue-collar because it is hands-on and often physically demanding. The term “blue-collar” comes from the traditional blue coveralls worn by manual labourers.
There are some problems with this distinction however. On one hand, as noted earlier, members of the middle class who earn an income from salaries or wages are, in Marx’s definition, members of the working class, even if they do not see themselves that way. As wage or salary workers, they are distinct from both the owning class and from the small business people, farmers and ranchers, and private contractors who are Marx’s petite bourgeoisie or “small owners.” They share a common class position with the traditional working class, which explains to some degree why all middle-income earners, regardless of manual or mental work, have lost a share of the total income with respect to the owning class. Marxist sociologists would explain this as a product of the dynamics of class conflict and class power in Canada.
On the other hand, skilled labour and trades in the traditional working class — skilled carpenters, mechanics, plumbers, electricians, pipe welders, etc. — often earn as much or more than white-collar workers and enjoy a higher standard of living. The median income of families and unattached individuals in Canada in 2019 was $62,900 (Statistics Canada, 2021), whereas the average income of electricians and plumbers was $65,890 and $59,222 respectively (2016 figures) (Statistics Canada, 2019).
If there is a class distinction to be made within middle-income earners in Canada it might make more sense to describe it in terms of degree of control over one’s work circumstances. Abercrombie and Urry (1983) note that there is growing a division within the white-collar occupations between a “service class” of credentialed or professional workers who enjoy relative autonomy and authority at work, and a subordinate group of deskilled nonprofessional white-collar workers such as clerical workers and salespeople who do not. In the lower-middle-class, people hold jobs supervised by members of the upper middle class. They fill technical, lower-level management or administrative support positions. This is roughly parallel to the control that credentialed blue-collar tradespeople enjoy over their work compared to those without trades tickets.
Compared to non-trades traditional working-class work, lower-middle-class jobs might carry more prestige and come with slightly higher paycheques. But for both groups, their incomes afford them a decent, mainstream lifestyle, even if they struggle to maintain it. They generally do not have enough income to build significant savings. In addition, their grip on class status is more precarious than in the upper tiers of the class system. When budgets are tight, lower-middle-class people and non-trades traditional working-class workers are often the ones to lose their jobs.
The Working Poor and the Under Class

Beneath those in the working class are the working poor. Like some sections of the working class, they have unskilled, low-paying employment. However, their jobs rarely offer benefits or enough income for retirement planning, and their positions are often precarious, seasonal or temporary. They work as migrant farm workers, house cleaners, and day labourers. Some are high school dropouts. Some are illiterate, unable to read job ads. Many do not vote because they do not believe that any politician will help change their situation (Beeghley, 2008).
How can people work full work weeks and still be poor? Even working full time, more than a million of the working poor earn incomes too meagre to support a family. In 2012, 1.8 million working people (including 540,000 working full time year round) earned less than Statistic Canada’s low income cut-off level or LICO measure or poverty (Johnstone & Cooper, 2013). Minimum wage varies from province to province, from $9.95/h in Alberta to $11/h in Nunavut and Ontario (Retail Council of Canada, 2014). However, it is estimated that a living wage — based on a 35-hour work week — was $19.50/hr in Vancouver in 2019, $22.08/hr in Toronto, and $21.80/hr in Halifax in 2020 (differences due to the difference in cost of living and government policies in these locations) (Ivanova and Saugstad, 2019; Ontario Living Wage Network, 2020; Driscoll and Saulnier, 2020). A living wage is the amount needed to meet a family’s basic needs and enable them to participate in community life (Johnstone & Cooper, 2013). Even for a single person, minimum wage is low. A married couple with children will have a hard time covering expenses.
The underclass or Marx’s “lumpenproletariat” is Canada’s lowest tier. Members of the underclass live mainly in inner cities. Many are unemployed or underemployed. Those who do hold jobs typically perform menial tasks for little pay. Some of the underclass are homeless. For many, welfare systems provide a much-needed support through food assistance, medical care, housing, and the like, but they live in relative poverty.
Social Mobility
Social mobility refers to the ability to change positions within a social stratification system. When people improve or diminish their economic status in a way that affects social class, they experience social mobility. This is a key concept in describing whether inequalities of condition limit people’s life chances or whether there is actual equality of opportunity. A high degree of social mobility, upwards or downwards, would suggest that the stratification system of a society is in fact “open” and that there is equality of opportunity.
Upward mobility refers to an increase — or upward shift — in social class. In Canada, people applaud the rags-to-riches achievements of celebrities like Guy Laliberté who went from street busking in Quebec to being the CEO of Cirque du Soleil, with a net worth of $2.5 billion. Actor and comedian Jim Carey lived with his family in camper van at one point growing up in Scarborough, Ontario, but in 2021 it was estimated that his net worth was about $180 million (Celebrity Net Worth, 2021). Ron Joyce was a beat policemen in Hamilton before he co-founded Tim Hortons. CEO of Magna International Frank Stronach immigrated to Canada from Austria in 1955 with only $50 to his name. There are many stories of people from modest beginnings rising to fame and fortune. But the truth is that relative to the overall population, the number of people who launch from poverty to wealth is miniscule. Still, upward mobility is not only about becoming rich and famous. In Canada, people who earn a university degree, get a job promotion, or marry someone with a good income may move up socially. Downward mobility indicates a lowering of one’s social class. Some people move downward because of business setbacks, unemployment, or illness. Dropping out of school, losing a job, or becoming divorced may result in a loss of income or status and, therefore, downward social mobility.
Upward and downward mobility can be refined into intergenerational, intragenerational and structural mobility. Intergenerational mobility explains a difference in social class between different generations of a family. Children may make a higher (or lower) standard of living than their parents and grandparents. Measures of intergenerational mobility describe the likelihood that a child from the bottom or top of the income distribution ends up at the bottom or top of the distribution as an adult. For example, an upper-class executive may have parents who belonged to the middle class. In turn, those parents may have been raised in the lower class. This is different from intragenerational mobility, which describes a change in social class within one’s adult life time or differences in mobility between members of the same generation. For example, the change in wealth and prestige experienced by one person may be quite different from that of their siblings. Finally, structural mobility happens when societal changes enable a whole group of people to move up or down the social class ladder. Structural mobility is attributable to changes in society as a whole, not individual changes. In the first half of the 20th century industrialization expanded the Canadian economy, which raised the standard of living of industrial workers and led to their upward mobility as a group. In today’s work economy, the recession and the outsourcing of jobs overseas have contributed to deindustrialization and high unemployment rates among industrial workers. Many people have experienced economic setbacks, creating a wave of downward structural mobility in this segment.
Measuring Social Mobility
Many Canadians believe that people move up in class because of individual efforts and move down by their own doing. This is the myth of the self-made man or woman, a term coined by a United States senator Henry Clay in 1832 (Wyllie, 1954). In the ideal of equality of opportunity, one’s access to rewards would exactly equal one’s personal efforts and merits toward achieving those rewards. One’s class position or other social characteristics (gender, race, ethnicity, etc.) would not skew the relationship between merit and rewards. Others argue that equality of opportunity is itself a myth, designed to keep people motivated to work hard, while getting them to accept social inequality as the legitimate outcome of personal achievement. It is an ideology that masks real and permanent structural inequality in society. The rich stay rich, and the poor stay poor. Data that measures social mobility suggest that the truth is a bit of both.
Typically social mobility is measured by comparing either the occupational status or the earnings between parents and children (i.e., intergenerational mobility). If children’s earnings or status remain the same as their parents then there is no social mobility. If children’s earnings or status moves up or down with respect to their parents, then there is social mobility. Corak and colleagues compared “intergenerational earnings elasticity” (IGE) between fathers and sons in Canada and the United States (2010). (Some data are available on daughters as well, but it is less common and therefore difficult to use to make cross-national comparisons). Intergenerational earnings elasticity gives a percentage figure that indicates the degree to which fathers’ income predicts sons’ income (i.e., the degree of intergenerational “stickiness” or lack of social mobility). The data show that there is a much lower degree of social mobility in the United States than in Canada. While earnings elasticity (from 2006 data) in the United States was 0.47, meaning that almost one half of the fathers’ earning advantage (or disadvantage) was passed on to their sons, in Canada the figure was 0.19, meaning that less than one-fifth of the father’s earnings advantage or disadvantage was passed on. This suggests that Canada has a relatively high rate of social mobility and equality of opportunity compared to the United States, where almost 50 per cent of sons remain at the same income level as their fathers. In an international comparison, the United Kingdom had even lower social mobility than the United States with an earnings elasticity of 0.50, while Finland, Norway, and Denmark had greater social mobility than Canada with earnings elasticities of 0.18, 0.17, and 0.15 respectively.
Recent research show that intergenerational mobility in Canada has been declining over time however. Connolly, Haeck and Lapierre (2021) compared the intergenerational mobility of birth cohorts born at 5 year intervals from 1963 to 1982 (i.e., the social mobility of people born in 1963 compared to those born in 1967, compared to those born in 1972, etc.). When people’s income is divided into ranks or percentiles, the correlation between an adult child’s income and their parent’s income has been steadily increasing from 18.9% for those born between 1963 and 1966 to 23.4% for those born between 1982 and 1985. In other words, the greater the correlation between adult children and parents, the lower the social mobility. This was even more pronounced for children of the lowest 20% of earners where the correlation increased from 27.1% to 32.6% between 1963 to 1982. Regionally, Connolly, Haeck and Lapierre (2021) show that social mobility is highest in Atlantic Canada, lowest in Manitoba, and decreased the most in Saskatchewan over this time period.
One of the key factors that distinguishes Canada’s degree of social mobility from that of the United States is that the United States has a much greater degree of social inequality to begin with. A higher degree of social inequality is linked to a lower degree of social mobility. This is referred to as the Great Gatsby Curve which predicts that the greater the overall inequality in a society, the lower the intergenerational mobility (Connolly, Haeck and Lapierre, 2021). Therefore, the main factor that contributes to the difference in the intergenerational earnings elasticity figures between Canada and the United States is that there is a great degree of intergenerational social immobility at the lower and higher ranges of the income scale in the United States. For example, over 25 per cent of sons born to fathers in the top 10 per cent of income earners remain in the top 10 percent, compared to about 18 per cent in Canada. On the other hand, in the United States, 22 per cent of sons born to fathers in the bottom 10 per cent of income earners remain in the bottom 10 percent, while another 18 per cent only move up to the bottom 10 to 20 per cent of income earners. The figures for Canada are 16 per cent and 14 per cent respectively (Corak et al., 2010).
However, these data also show that Canada has by no means “perfect” social mobility or equality of opportunity. Class background significantly affects one’s chances to get ahead. For example, the chance that a son born to a father in the 30 to 40 per cent or 40 to 50 per cent ranges of income earners (i.e., in 2004 families averaging $42,000 or $55,000 a year respectively) would move up into the top 50 per cent of income earners (i.e., families averaging $65,000 a year or more) was about 50 per cent (Yalnizyan, 2007). In contrast, a son from the bottom 20 per cent of income earners had only a 38 per cent chance of moving into the top 50 per cent of income earners. For the bottom 20 per cent of families, 62 per cent of sons remained within the bottom 50 per cent of income earners (Corak et al., 2010).
Media Attributions
- Figure 9.18 Inherited wealth among wealthiest Canadians, 1999 & 2016 [Figure 4] by Macdonald (2018) is used under the CC BY-NC-ND 3.0 licence on the CCPA website.
- Figure 9.19 The Canadian corporate network, clustered by seven cities, showing five economic sectors. by William Carroll (2021, p. 152), via AU Press is used under a CC BY-NC-ND 4.0 licence.
- Figure 9.20 Reservoir Pigs by Fanboy30, via Flickr, is used under a CC BY-NC-SA 2.0 licence.
- T-shirt roll call by Mika Meskanen is used under a CC BY-NC 2.0 licence.
- Figure 9.21 Restaurant chains outsource cleaning by David Bruce Jr., via Flickr, is used under a CC BY 2.0 licence.
