Chapter 8. Deviance, Crime, and Social Control
8.3. Crime and the Law
What Is Crime?

Although deviance is a violation of social norms, it is not always punishable, and it is not necessarily bad. Crime, on the other hand, is a behaviour that violates official law and is punishable through formal sanctions. Walking to class backwards is a deviant behaviour. Driving with a blood alcohol percentage over the province’s limit is a crime. Like other forms of deviance, however, ambiguity exists concerning what constitutes a crime and whether all crimes are, in fact, “bad” and deserve punishment.
For example, in 1946 Viola Desmond refused to sit in the balcony designated for blacks at a cinema in New Glasgow, Nova Scotia, where she was unable to see the screen. She was dragged from the cinema by two men who injured her knee, and she was then arrested, obliged to stay overnight in the male cell block, tried without counsel, and fined.
The court ruling ended up ignoring the laws concerning racial segregation in Canada, which was the reason why she was removed from the cinema. Instead her crime was determined to be tax evasion because she had not paid the 1 cent difference in tax between a balcony ticket and a main floor ticket. She took her case to the Supreme Court of Nova Scotia where she lost. In hindsight, and long after her death, she was posthumously pardoned, because the application of the law was clearly in violation of norms of social equality.
As noted above, all societies have informal and formal ways of maintaining social control. Within these systems of norms, societies have legal codes that maintain formal social control through laws, which are rules adopted and enforced by a political authority. Those who violate these rules incur negative formal sanctions in the form of fines, jail or court ordered retribution. Normally, punishments are relative to the degree of the crime and the importance to society of the value underlying the law. There are, however, other factors that influence criminal sentencing.
Types of Crimes
Not all crimes are given equal weight. Society generally socializes its members to view certain crimes as more severe than others. As discussed earlier, John Hagen distinguished between serious consensus crimes, like murder and sexual assault, about which there is near-unanimous public agreement, and conflict crimes, like prostitution or recreational drugs, which may be illegal but about which there is considerable public disagreement concerning their seriousness. Even within the category of crimes on which there is consensus, there is disagreement about levels of seriousness and punishment. For example, most people would consider murdering someone to be far worse than stealing a wallet and would expect a murderer to be punished more severely than a thief. In modern North American society, crimes are typically classified as one of two types based on their severity. Violent crimes (also known as “crimes against a person”) are based on the use of force or the threat of force. Rape, murder, and armed robbery fall under this category. Nonviolent crimes involve the destruction or theft of property, but do not use force or the threat of force. Because of this, they are also sometimes called “property crimes.” Larceny, car theft, and vandalism are all types of nonviolent crimes. If you use a crowbar to break into a car, you are committing a nonviolent crime; if you mug someone with the crowbar, you are committing a violent crime.
As noted earlier in the section on critical sociological approaches, when people think of violent and non-violent crime, they often picture street crime, or offenses committed by ordinary people against other people or organizations, usually in public spaces. An often overlooked category of non-violent crime is corporate crime (or “suite crime”), crime committed by white-collar workers in a business environment. Embezzlement, insider trading, ponzi schemes and fraud are all types of corporate crime. Although these types of offences rarely receive the same amount of media coverage as street crimes, they can be far more damaging. The 2008 world economic recession was the ultimate result of a financial collapse triggered by corporate crime. An often-debated third type of crime is victimless crime. These are called victimless because the perpetrator is not explicitly harming another person. As opposed to battery or theft, which clearly have a victim, a crime like drinking a beer at age 17 or selling a sexual act do not result in injury to anyone other than the individual who engages in them, although they are illegal. While some claim acts like these are victimless, others argue that they actually do harm society. Prostitution may foster abuse toward women by clients or pimps. Drug use may increase the likelihood of employee absences. Such debates highlight how the interpretation of the deviant and criminal nature of actions develops through ongoing public discussion.
Making Connections: Sociological Research
Hate Crimes
In the early morning of January 4, 1998, Nirmal Singh Gill, a 65-year-old Sikh caretaker in Surrey, B.C. was beaten to death in the parking lot of the Guru Nanak Sikh temple by five white-supremacist skinheads, aged 17 to 25, as he was about to open the temple for early morning worship. The skinheads were part of a group that called itself White Power. They had been to an all-night drinking party when they decided they were going to vandalize some cars in the temple parking lot. They encountered the caretaker Nirmal Singh Gill and took turns attacking him. In trial it came out that the eldest of the skinheads had recently been released from the military because of his racist beliefs. Another had a large Nazi flag pinned to the wall of his apartment. In a telephone call intercepted during the investigation that led to the skinheads’ arrest, one skinhead was recorded as saying, “Can’t go wrong with a Hindu death cause it always sends a f’n message” (R. v. Miloszewski, 1999). Gill was not Hindu, but Sikh.
Attacks motivated by hate based on a person’s race, religion, or other characteristics are known as hate crimes. The category of hate crimes grew out of the provisions in the Criminal Code that prohibit hate propaganda (sections 318 and 319) including advocating genocide, public incitement of hatred, or the willful promotion of hatred against an identifiable group. In 1996, section 718.2 of the Criminal Code was amended to introduce hate motivation as an aggravating factor in crime that needed to be considered in sentencing (Silver et al., 2004).
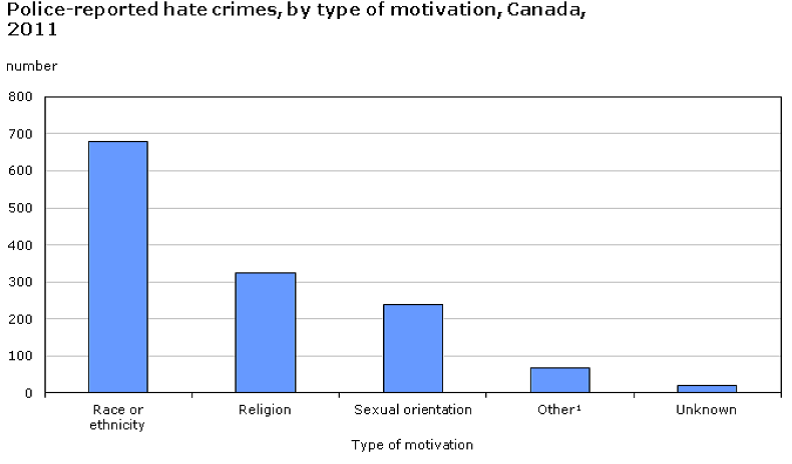
In 2009 Statistics Canada’s General Social Survey on Victimization reported that 5 per cent of the offenses experienced by victims of crime in Canada were believed by the victims to be motivated by hate (approximately 399,000 incidents in total) (Perreault & Brennan, 2010). However, police reported hate crimes totaled only 1,473 incidents in 2009. About one-third of the General Social Survey respondents said they reported the hate-motivated incidents to the police. In 2011 police-reported hate crimes had dropped to 1,322 incidents. The majority of these were racially or ethnically motivated, but many were based on religious prejudice (especially anti-Semitic) or sexual orientation. A significant portion of the hate-motivated crimes (50 per cent) involved mischief (vandalism, graffiti, and other destruction of property). This figure increased to 75 per cent for religious-motivated hate crimes. Violent hate crimes constituted 39 per cent of all hate crimes (22 per cent accounted for by violent assault specifically). Sexual-orientation-motivated hate crimes were the most likely to be violent (65 per cent) (Allen & Boyce, 2013).
The number of police-reported hate crimes in Canada increased by 37% during the first year of the pandemic, rising from 1,951 incidents in 2019 to 2,669 in 2020 (Statistics Canada, 2021). This marks the largest number of police-reported hate crimes since comparable data became available in 2009. Police-reported hate crimes targeting race or ethnicity almost doubled (+80%) compared with the previous year, accounting for the vast majority of the national increase in hate crimes.
Crime Statistics
What crimes are people in Canada most likely to commit, and who is most likely to commit them? The first step to understanding criminal statistics, is understanding how these statistics are collected. Since 1962, Statistics Canada has been collecting and publishing an archive of crime statistics known as the Uniform Crime Reports Survey (UCR). These annual publications contain data from all the police agencies in Canada. Although the UCR contains comprehensive data on police reports, it fails to take into account the fact that many crimes go unreported due to the victims’ unwillingness to report them, largely based on fear, shame, or distrust of the police. The accuracy of the data collected by the UCR also varies greatly. Because police and other authorities decide which criminal acts they are going to focus on in their policing strategies, the data reflects the priorities of the police rather than actual levels of crime per se. For example, if police decide to focus on gun-related crimes, chances are that more gun-related crimes will be discovered and counted. Similarly, changes in legislation that introduce new crimes or change the categories under which crimes are recorded will also alter the statistics.
To address some of these problems, in 1985, Statistics Canada began to publish a separate report known as the General Social Survey on Victimization (GSS). The GSS is a self-report study. A self-report study is a collection of data acquired using voluntary response methods, based on telephone interviews. In 2019, for example, survey data were gathered from 20,000 respondents across Canada on the frequency and type of crime they experience in their daily lives (Statistics Canada, 2019). The surveys are thorough, providing a wider scope of information than was previously available. This allows researchers to examine crime from more detailed perspectives and to analyze the data based on factors such as the relationship between victims and offenders, the consequences of the crimes, and substance abuse involved in the crimes. Demographics are also analyzed, such as age, ethnicity, gender, location, and income level.
The GSS reports a higher rate of crime than the UCR, especially for less serious crimes, because not all crime is reported to the police. In the 2009 GSS on Victimization, only 31 per cent of criminal incidents experienced by respondents were reported to police (Perreault & Brennan, 2010). Though the GSS is a critical source of statistical information, disadvantages exist. “Non-response,” or a victim’s failure to participate in the survey or a particular question, is among them. Inability to contact important demographics, such as those who do not have access to phones or who frequently relocate, also skews the data. For those who participate, memory issues can be problematic for the data sets. Some victims’ recollection of the crimes can be inaccurate or simply forgotten over time.
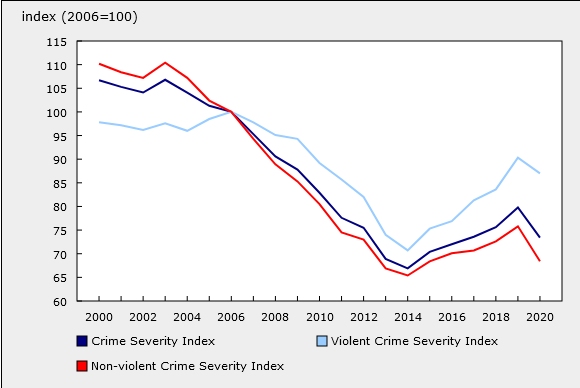
A third statistical measure, the Crime Severity Index was introduced by Statistics Canada in 2009 (Statistics Canada, 2009). This measures changes in the amounts of serious crime, or the overall seriousness of crime in a given year, by calculating a rate based on weighting the relative seriousness of crimes committed. Crimes that receive higher sentences are considered more serious than other types of crime, so 1st degree murder and sexual assault are weighted the highest, whereas disturbing the peace and cannabis possession are weighted relatively low. Because traditional crime rate measures are heavily influenced by fluctuations in high-volume, less serious offenses —about 40% of police-reported crime in Canada comes from two relatively less serious offenses: thefts under $5,000 and mischief — the Crime Severity Index provides a standardized measure of whether serious crime is increasing or decreasing. The Index is standardized to “100,” using 2006 as a base year. Figures higher than 100 would indicate that crime is more severe than it was in 2006. Figures less than 100 mean that crime is less severe than it was in 2006.
The Declining Crime Rate in Canada
While none of these measures can take into account all of the crimes committed in the country, some general trends may be noted. Crime rates were on the rise after 1960, but following an all-time high in the 1980s and 1990s, rates of violent and nonviolent crimes started to decline. In 2012 they reached their lowest level since 1972 (Perreault, 2013).
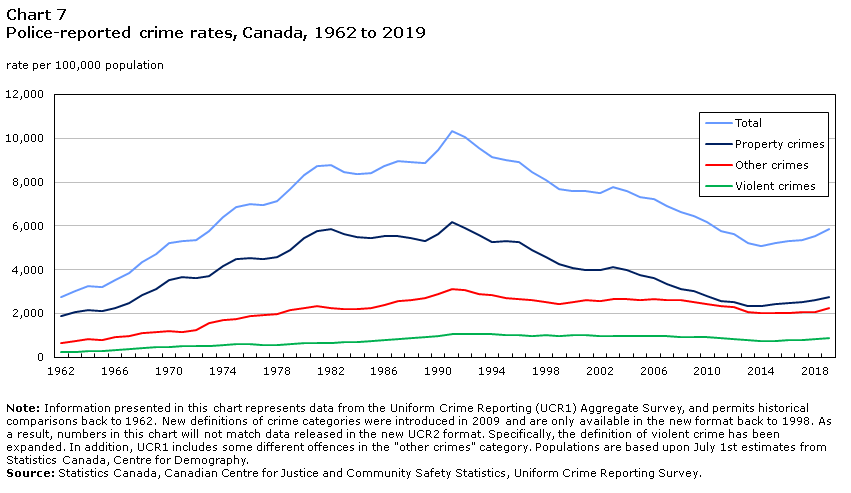
In 2012, approximately 2 million crimes occurred in Canada. Of those, 415,000 were classified as violent crimes, the majority being assault and robbery. The rate of violent crime reached its lowest level since 1987, led by decreases in sexual assault, common assault, and robbery. The homicide rate fell to its lowest level since 1966. An estimated 1.58 million nonviolent crimes also took place; the most common being theft under $5,000 and mischief. The major contribution to the declining crime rate has been decreases in nonviolent crime, especially decreases in mischief, break-ins, disturbing the peace, theft of a motor vehicle, and possession of stolen property. As noted above, however, only 31 per cent of violent and nonviolent crimes were reported to the police. Since 2012, crime rates have increased slightly. In 2019, there were over 2.2 million police-reported Criminal Code incidents (not including traffic violations), about 164,700 more incidents than in 2018. At 5,874 incidents per 100,000 population, the police-reported crime rate—which measures the volume of crime—increased 7% in 2019. This rate, however, was still 9% lower than a decade earlier in 2009 (Moreau, Jaffray and Armstrong, 2020).
What accounts for the general decreases in the crime rate since the early 1990s? During the period of lowest crime rates, opinion polls showed that a majority of Canadians believed that crime rates, especially violent crime rates, were rising (Edmiston, 2012), even though the statistics showed a steady decline since 1991. Where is the disconnect? There are three primary reasons for the decline in the crime rate. Firstly, it reflects the demographic changes to the Canadian population. The post-war baby boom continued into the early 1960s but the birth rate fell afterwards and has remained low since the 1970s. As most crime is committed by people aged 18 to 34 and this age cohort has declined in size since 1991, it makes sense statistically that the crime rate has fallen. Property crimes, which are predominantly associated with teenagers and young adults, leveled off during the 80’s, while violent crimes, associated with teenagers and young adults but also middle aged adults, decreased in the 90s. The number of people aged 20 to 34 dropped by 18% Canada between 1990 and 1999 (Oimet, 2004).
Secondly, male unemployment is highly correlated with the crime rate, especially property crimes. Unemployment rates were high in the 1980s and again in the early 1990s, correlating with trends in property crime (Pottie Bunge, Johnson and Baldé, 2005). Following the recession of 1990–1991, better economic conditions improved male unemployment. The total unemployment rate dropped by 27% in Canada between 1991 and 1999, meaning that the economic situation for young adults improved (Oimet, 2004).
Thirdly, police methods have arguably improved since 1991, including having a more targeted approach to particular sites and types of crime. Strategies such as “hot-spot policing ” and “focused deterrence,” as well as collaboration with non-police organizations such as private security, neighbourhood watch programs, local health professionals, community and municipal groups, and other government organizations have proven effective (Council of Canadian Academies, 2014). Similarly, the shift to community policing and a more problem solving rather than reactive approaches improves relationships between police and citizens and lowers crime rates (Pottie Bunge, Johnson and Baldé, 2005).
A fourth, more controversial, reason for declining crime rates was the legalization of abortion in Canada in 1969. Levitt (2004) argues that legalizing abortion resulted in fewer unwanted children who would have been at a greater risk of crime when they reached their teen and adult years.
Corrections
The corrections system, more commonly known as the prison system, is tasked with supervising individuals who have been arrested, convicted, and sentenced for a criminal offence. At the end of 2011, approximately 38,000 adults were in prison in Canada, while another 125,000 were under community supervision or probation (Dauvergne, 2012). By way of contrast, seven million Americans were behind bars in 2010 (Bureau of Justice Statistics, 2011). Canada’s rate of adult incarceration in 2011 was 140 per 100,000 population. In the United States in 2008, the incarceration rate was approximately 1,000 per 100,000 population. More than 1 in 100 U.S. adults were in jail or prison, the highest benchmark in U.S. history. While Americans account for 5 per cent of the global population, they have 25 per cent of the world’s inmates, the largest number of prisoners in the world (Liptak, 2008). While Canada’s rate of incarceration is far lower than that of the United States, there are nevertheless some disturbing features of the Canadian corrections system.
As noted in Chapter 1. An Introduction to Sociology, from 2010 to 2011, Indigenous Canadians were 10 times more likely to be incarcerated than the non-Indigenous population. While Indigenous people accounted for about 4 per cent of the Canadian population, in 2013, they made up 23.2 per cent of the federal penitentiary population. Indigenous women made up 33.6 per cent of incarcerated women in Canada. This problem of overrepresentation of Indigenous people in the corrections system — the difference between the proportion of Indigenous people incarcerated in Canadian correctional facilities and their proportion in the general population — continues to grow appreciably despite a Supreme Court ruling in 1999 (R. vs. Gladue) that the social history of Indigenous offenders should be considered in sentencing. Section 718.2 of the Criminal Code states, “all available sanctions other than imprisonment that are reasonable in the circumstances should be considered for all offenders, with particular attention to the circumstances of Aboriginal offenders.” Prison is supposed to be used only as a last resort. Nevertheless, between 2003 and 2013, the Indigenous population in prison grew by 44 per cent (Correctional Investigator Canada, 2013).
Hartnagel (2004) summarised the literature on why Indigenous people are overrepresented in the criminal justice system. Firstly, Indigenous people are disproportionately poor and poverty is associated with higher arrest and incarceration rates. Unemployment in particular is correlated with higher crime rates. Secondly, Indigenous lawbreakers tend to commit more detectable street crimes than the less detectable white collar or suite crimes of other segments of the population. Thirdly, the criminal justice system disproportionately profiles and discriminates against Indigenous people. It is more likely for Indigenous people to be apprehended, processed, prosecuted, and sentenced than non-Indigenous people. Fourthly, the legacy of colonization has disrupted and weakened traditional sources of social control in Indigenous communities. The informal social controls that effectively control criminal and deviant behaviour in intact communities have been compromised in Indigenous communities due to the effects of forced assimilation, the residential school system, and migration to poor inner city neighbourhoods.
Although black Canadians are a smaller minority of the Canadian population than Indigenous people, they experience a similar problem of overrepresentation in the prison system. Blacks represent approximately 2.9 per cent of the Canadian population, but accounted for 9.5 per cent of the total prison population in 2013, up from 6.3 per cent in 2003–2004 (Correctional Investigator Canada, 2013). A survey revealed that blacks in Toronto are subject to racial profiling by the police, which might partially explain their higher incarceration rate (Wortley, 2003). Racial profiling occurs when police single out a particular racial group for extra policing, including a disproportionate use of stop-and-search practices (i.e.,”carding”), undercover sting operations, police patrols in racial minority neighbourhoods, and extra attention at border crossings and airports. Survey respondents revealed that blacks in Toronto were much more likely to be stopped and searched by police than were whites or Asians. Moreover, in a reverse of the situation for whites, older and more affluent black males were more likely to be stopped and searched than younger, lower-income blacks. As one survey respondent put it: “If you are black and drive a nice car, the police think you are a drug dealer or that you stole the car. They always pull you over to check you out” (Wortley, 2003).
Prisons and their Alternatives
Recent public debates in Canada on being “tough on crime” often revolve around the idea that imprisonment and mandatory minimum sentences are effective crime control practices. It seems intuitive that harsher penalties will deter offenders from committing more crimes after their release from prison. However research shows that punitive “tough on crime” policies do not reduce crime rates (Pottie Bunge, Johnson and Baldé, 2005; Pratt and Cullen, 2005). Nor does serving prison time reduce the propensity to re-offend after the sentence has been completed. In general the effect of imprisonment on recidivism — the likelihood for people to be arrested again after an initial arrest — was either non-existent or actually increased the likelihood of re-offence in comparison to non-prison sentences (Nagin, Cullen, & Jonson, 2009). In particular, first time offenders who are sent to prison have higher rates of recidivism than similar offenders sentenced to community service (Nieuwbeerta, Nagin, & Blockland, 2009).
Moreover, the collateral effects of the imprisonment of one family member include negative impacts on the other family members and communities, including increased aggressiveness of young sons (Wildeman, 2010) and increased likelihood that the children of incarcerated fathers will commit offences as adults (van de Rakt & Nieuwbeerta, 2012). As noted above, some researchers have spoken about a penal-welfare complex to describe the creation of inter-generational criminalized populations who are excluded from participating in society or holding regular jobs on a semi-permanent basis (Garland, 1985). The painful irony for these groups is that the petty crimes like theft, public consumption of alcohol, drug use, etc. that enable them to get by in the absence of regular sources of security and income are increasingly targeted by zero tolerance and minimum sentencing policies of crime control.
There are a number of alternatives to prison sentences used as criminal sanctions in Canada including fines, electronic monitoring, probation, and community service. These alternatives divert offenders from forms of penal social control, largely on the basis of principles drawn from labelling theory. They emphasize to varying degrees compensatory social control, which obliges an offender to pay a victim to compensate for a harm committed; therapeutic social control, which involves the use of therapy to return individuals to a normal state; and conciliatory social control, which reconciles the parties of a dispute to mutually restore harmony to a social relationship that has been damaged.
Many non-custodial sentences involve community-based sentencing, in which offenders serve a conditional sentence in the community, usually by performing some sort of community service. The argument for these types of programs is that rehabilitation is more effective if the offender is in the community rather than prison. A version of community-based sentencing is restorative justice conferencing, which focuses on establishing a direct, face-to-face connection between the offender and the victim. The offender is obliged to make restitution to the victim, thus “restoring” a situation of justice. Part of the process of restorative justice is to bring the offender to a position in which they can fully acknowledge responsibility for the offence, express remorse, and make a meaningful apology to the victim (Department of Justice, 2013).
In special cases where the parties agree, Aboriginal sentencing circles involve victims, the Aboriginal community, and Aboriginal elders in a process of deliberation with Aboriginal offenders to determine the best way to find healing for the harm done to victims and communities. The emphasis is on forms of traditional Aboriginal justice, which center on healing and building community rather than retribution. These might involve specialized counseling or treatment programs, community service under the supervision of elders, or the use of an Aboriginal nation’s traditional penalties (Aboriginal Justice Directorate, 2005).
It is difficult to find data in Canada on the effectiveness of these types of programs. However, a large meta-analysis study that examined ten studies from Europe, North America, and Australia was able to determine that restorative justice conferencing was effective in reducing rates of recidivism and in reducing costs to the criminal justice system (Strang et al., 2013). The authors suggest that recidivism was reduced between 7 and 45 per cent from traditional penal sentences by using restorative justice conferencing.
Rehabilitation and recidivism are of course not the only goals of the corrections systems. Many people are skeptical about the capacity of offenders to be rehabilitated and see criminal sanctions more importantly as a means of (a) deterrence to prevent crimes, (b) retribution or revenge to address harms to victims and communities, or (c) incapacitation to remove dangerous individuals from society.
Media Attributions
- Figure 8.17 Viola Desmond, Halifax, Nova Scotia by Winnipeg Free Press, via Wikimedia Commons, is in the public domain.
- Figure 8.18 Police reported hate crimes by type of motivation, Canada, 2011, Chart 2, by Allen and Boyce (2020), via Statistics Canada. Use is governed by the Statistics Canada Open Licence Agreement.
- Figure 8.19 Police reported crime rates, Canada, 1962-2019 by Moreau, Jaffray and Armstrong (2020), via Statistics Canada. Use is governed by the Statistics Canada Open Licence Agreement.
- Figure 8.20 Crime Severity Indexes based on police reported crime rates from 2000 to 2020 in Canada by Statistics Canada. (2021a). Use is governed by the Statistics Canada Open Licence Agreement.
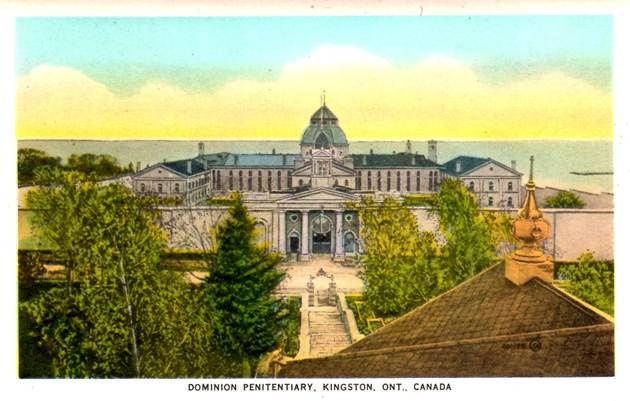
- Figure 8.21 Kingston ON – Dominion Penitentiary by R Orville Lyttle, via Flickr, is used under CC BY SA 2.0 licence.
