Chapter 13. Aging and the Elderly
13.1 Who Are the Elderly? Aging in Society
Think of the movies and television shows that have played recently. Did any of them feature older actors? What roles did they play? How were these older actors portrayed? Were they cast as main characters in a love story? Grouchy old people? How were older women portrayed? How were older men portrayed?
Many media portrayals of the elderly reflect negative cultural attitudes toward aging. In North America, society tends to glorify youth, associating it with beauty and sexuality. In comedies, the elderly are often associated with grumpiness or hostility. Rarely do the roles of older people convey the fullness of life experienced by seniors—as employees, lovers, or the myriad roles they have in real life. What values does this reflect?
One hindrance to society’s fuller understanding of aging is that people rarely understand it until they reach old age themselves. (As opposed to childhood, for instance, which people can all look back on). Therefore, myths and assumptions about the elderly and aging are common. Many stereotypes exist surrounding the realities of being an older adult. While individuals often encounter stereotypes associated with race and gender and are thus more likely to think critically about them, many people accept age stereotypes without question (Levy et al., 2002). Each culture has a certain set of expectations and assumptions about aging, all of which are part of our socialization.
While the landmarks of maturing into adulthood are a source of pride, signs of natural aging can be cause for shame or embarrassment. Some people try to fight off the appearance of aging with cosmetic surgery. Although many seniors report that their lives are more satisfying than ever, and their self-esteem is stronger than when they were young, they are still subject to cultural attitudes that make them feel invisible and devalued.
Gerontology is a field of science that seeks to understand the process of aging and the challenges encountered as seniors grow older. Gerontologists investigate age, aging, and the aged. Gerontologists study what it is like to be an older adult in a society and the ways that aging affects members of a society. As a multidisciplinary field, gerontology includes the work of medical and biological scientists, social scientists, and even financial and economic scholars.
Social gerontology refers to a specialized field of gerontology that examines the social (and sociological) aspects of aging. Researchers focus on developing a broad understanding of the experiences of people at specific ages, such as mental and physical well-being, plus age-specific concerns such as the process of dying. Social gerontologists work as social researchers, counselors, community organizers, and service providers for older adults. Because of their specialization, social gerontologists are in a strong position to advocate for older adults.
Scholars in these disciplines have learned that aging reflects not just the physiological process of growing older, but also people’s attitudes and beliefs about the aging process. Many have likely seen online calculators that promise to determine their “real age” as opposed to their chronological age. These ads target the notion that people may feel a different age than their actual years. Some 60-year-olds feel frail and elderly, while some 80-year-olds feel sprightly.
Equally revealing is that as people grow older, they define “old age” in terms of greater years than their current age (Logan, 1992). Many people want to postpone old age, regarding it as a phase that will never arrive. Some older adults even succumb to stereotyping their own age group (Rothbaum, 1983).
In North America, the experience of being elderly has changed greatly over the past century. In the late 1800s and early 1900s, many North American households were home to multigenerational families, and the experiences and wisdom of elders was respected. They offered wisdom and support to their children and often helped raise their grandchildren (Sweetser, 1984).
Today, with most households confined to the nuclear family, attitudes toward the elderly have changed. In 2011, of the 13,320,615 private households in the country, only about 400,000 of them (3.1%) were multigenerational (Statistics Canada, 2012b). It is no longer typical for older relatives to live with their children and grandchildren.
Attitudes toward the elderly have also been affected by large societal changes that have happened over the past 100 years. Researchers believe industrialization and modernization have contributed greatly to lowering the power, influence, and prestige the elderly once held.
The elderly have both benefited and suffered from these rapid social changes. In modern societies, a strong economy created new levels of prosperity for many people. Health care has become more widely accessible, and medicine has advanced, allowing the elderly to live longer. However, older people are not as essential to the economic survival of their families and communities as they were in the past. While the average person now lives 20 years longer than they did 90 years ago (Statistics Canada, 2010), the prestige associated with age has declined.
Studying Aging Populations
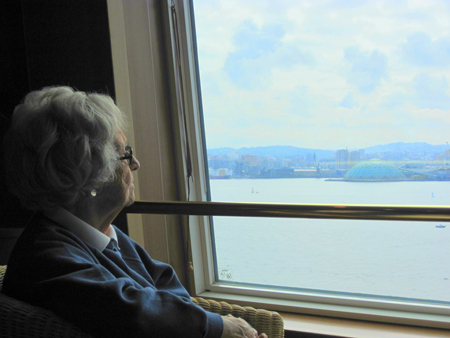
The first census in Canada was conducted in 1666 on the colony’s 3,215 inhabitants and included questions about age as well as sex, marital status, and occupation. Since the first national census in 1871, the Canadian government has been tracking age in the population every 10 years (Statistics Canada, 2013a). Age is an important factor to analyze with accompanying demographic figures, such as income and health. The population pyramid below shows projected age distribution patterns for the next several decades.
Statisticians use data to calculate the median age of a population, that is, the number that marks the halfway point in a group’s age range. In Canada, the median age is about 40 (Statistics Canada, 2013b). That means that about half of Canadians are under 40 and about half are over 40. The median age of women is higher than men, 41.1 compared to 39.4, due to the persistent higher life expectancy of women (although the gap between genders has been diminishing).
Overall, the median age of Canadians has been increasing, indicating that the population is growing older. It is interesting to note, however, that the proportion of senior citizens in Canada is lower than most of the other G8 countries. In 2013, 15.3% of Canadians were over 65 while 25% of Japanese, 21% of Germans, 21% of Italians, 17% of French, and 16% of British were over 65. Only the United States (14%) and Russia (13%) had lower proportions (Statistics Canada, 2013c).
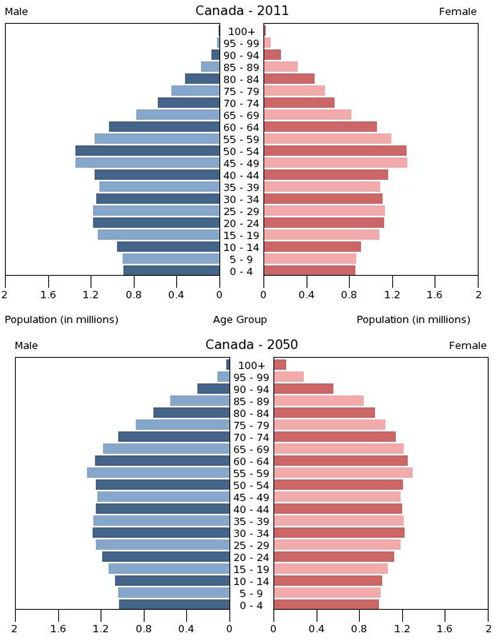
A cohort is a group of people who share a statistical or demographic trait. People belonging to the same age cohort were born in the same time frame. The population pyramids in Figure 13.3 show the different composition of age cohorts in the population, comparing the population in 2011 with figures projected for 2050. The bulge in the pyramid clearly becomes more rounded in the future, indicating that the proportion of senior cohorts will continue to increase with respect to the younger cohorts in the population. Understanding a population’s age composition can point to certain social and cultural factors and help governments and societies plan for future social and economic challenges. This is key to planning for everything from the funding of pension plans and health care systems to calculating the number of immigrants needed to replenish the workforce.
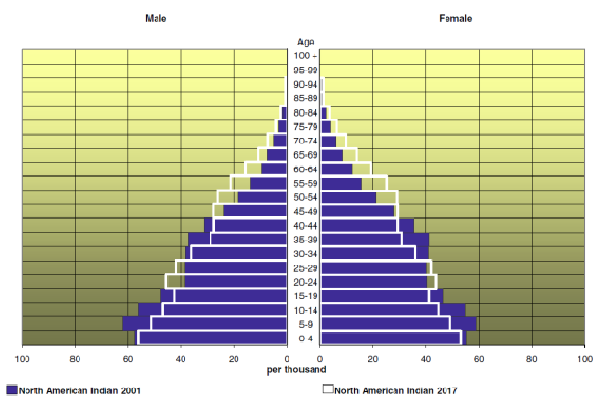
The population pyramid in Figure 13.4 compares the age distribution of the Aboriginal population of Canada in 2001 to projected figures for 2017. It is much more pyramidal in form than the graphs for the Canadian population as a whole (see Figure 13.3) reflecting both the higher birth rate of the aboriginal population and the lower life expectancy of aboriginal people. The aboriginal population is much younger than the Canadian population, with a median age of 24.7 years in 2001 (projected to increase to 27.8 in 2017). Sociological studies on aging might help explain the difference between Native American age cohorts and the general population. While Native American societies have a strong tradition of revering their elders, they also have a lower life expectancy because of lack of access to quality health care.
Phases of Aging: The Young-Old, Middle-Old, and Old-Old
In Canada, all people over age 18 are considered adults, but there is a large difference between a person aged 21 and a person who is 45. More specific breakdowns, such as “young adult” and “middle-aged adult,” are helpful. In the same way, groupings are helpful in understanding the elderly. The elderly are often lumped together, grouping everyone over the age of 65. But a 65-year-old’s experience of life is much different than a 90-year-old’s.
The older adult population can be divided into three life-stage subgroups: the young-old (approximately 65–74), the middle-old (ages 75–84), and the old-old (over age 85). Today’s young-old age group is generally happier, healthier, and financially better off than the young-old of previous generations. In North America, people are better able to prepare for aging because resources are more widely available.
Also, many people are making proactive quality-of-life decisions about their old age while they are still young. In the past, family members made care decisions when an elderly person reached a health crisis, often leaving the elderly person with little choice about what would happen. The elderly are now able to choose housing, for example, that allows them some independence while still providing care when it is needed. Living wills, retirement planning, and medical powers of attorney are other concerns that are increasingly handled in advance.
However, the gender imbalance in the sex ratio of men to women is increasingly skewed toward women as people age. In 2013, 67% of Canadians over the age of 85 were women (Statistics Canada, 2013b). This imbalance in life expectancy has larger implications because of the economic inequality between men and women. The population of old-old women are the cohort with the greatest needs for care, but because many women did not work outside the household during their working years and those who did earned less on average than men, they receive the least retirement benefits.
The Greying of Canada
What does it mean to be elderly? Some define it as an issue of physical health, while others simply define it by chronological age. The Canadian government, for example, typically classifies people aged 65 years old as elderly, at which point citizens are eligible for federal benefits such as Canada Pension Plan and Old Age Security payments. The World Health Organization has no standard, other than noting that 65 years old is the commonly accepted definition in most core nations, but it suggests a cut-off somewhere between 50 and 55 years old for semi-peripheral nations, such as those in Africa (World Health Organization, 2012). CARP (formerly the Canadian Association of Retired Persons, now just known as CARP) no longer has an eligible age of membership because they suggest that people of all ages can begin to plan for their retirement. It is interesting to note CARP’s name change; by taking the word “retired” out of its name, the organization can broaden its base to any older Canadians, not just retirees. This is especially important now that many people are working to age 70 and beyond.
There is an element of social construction, both local and global, in the way individuals and nations define who is elderly; that is, the shared meaning of the concept of elderly is created through interactions among people in society. This is exemplified by the truism that one is only as old as one feels.
Demographically, the Canadian population over age 65 increased from 5% in 1901 (Novak, 1997) to 14.4% in 2011. Statistics Canada estimates that by 2051 the percentage will increase to 25.5% (Statistics Canada, 2010). This increase has been called “the greying of Canada,” a term that describes the phenomenon of a larger and larger proportion of the population getting older and older.
There are several reasons why Canada is greying so rapidly. One of these is life expectancy: the average number of years a person born today may expect to live. When reviewing Statistics Canada figures that group the elderly by age, it is clear that in Canada, at least, people are living longer. Between 1983 and 2013, the number of elderly citizens over 85 increased by more than 100%. In 2013 the number of centenarians (those 100 years or older) in Canada was 6,900, almost 20 centenarians per 100,000 persons, compared to 11 centenarians per 100,000 persons in 2001 (Statistics Canada, 2013b).
Another reason for the greying of Canada can be attributed to the aging of the baby boomers. Nearly a third of the Canadian population was born in the generation following World War II (between 1946 and 1964) when Canadian families averaged 3.7 children per family (compared to 1.7 today) (Statistics Canada, 2012a). Baby boomers began to reach the age of 65 in 2011. Finally, the proportion of old to young can be expected to continue to increase because of the below-replacement fertility rate (i.e., the average number of children per woman). A low birth rate contributes to the higher percentage of older people in the population.
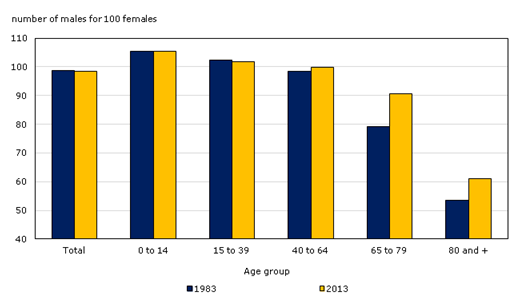
As noted above, not all Canadians age equally. Most glaring is the difference between men and women — as Figure 13.6 shows, women have longer life expectancies than men. In 2013, there were ninety 65-to-79-year-old men per one hundred 65- to 79-year-old women. However, there were only sixty 80+ year-old men per one hundred 80+ year-old women. Nevertheless, as the graph shows, the sex ratio increased over time, indicating that men are closing the gap between their life spans and those of women (Statistics Canada, 2013c).
Baby Boomers
Of particular interest to gerontologists right now are the consequences of the aging population of baby boomers, the cohort born between 1946 and 1964 and just now reaching age 65. Coming of age in the 1960s and early 1970s, the baby boom generation was the first group of children and teenagers with their own spending power and therefore their own marketing power (Macunovich, 2000). The youth market for commodities such as music, fashion, movies, and automobiles was a major factor in creating a youth-oriented culture. As this group has aged, it has redefined what it means to be young, middle-aged, and now, old. People in the boomer generation do not want to grow old the way their grandparents did. The result is a wide range of products designed to ward off the effects — or the signs — of aging. Previous generations of people over 65 were “old.” Baby boomers are in “later life” or “the third age” (Gilleard and Higgs, 2007).
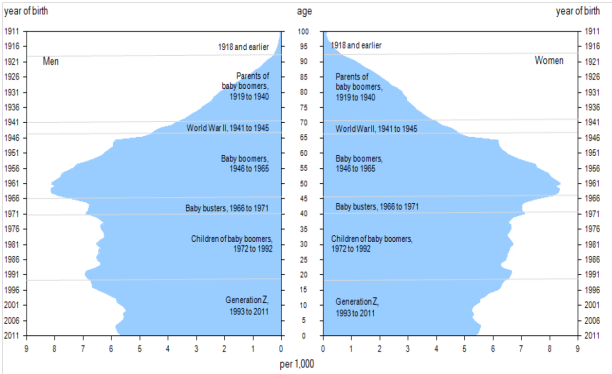
The baby boom generation is the cohort driving much of the dramatic increase in the over-65 population. As we can see in Figure 13.7, the biggest bulge in the population pyramid for 2011 (representing the largest population group) is in the age 45 to 55 cohort. As time progresses, the population bulge moves up in age. In 2011, the oldest baby boomers were just reaching the age at which Statistics Canada considers them elderly. In 2020, the baby boom bulge, as predicted, continued to rise up the pyramid, making the largest Canadian population group between 65 and 85 years old.
This aging of the baby boom cohort has serious implications for society. Health care is one of the areas most impacted by this trend. For years, hand-wringing has abounded about the additional burden the boomer cohort will place on the publicly funded health care system. The report by the Commission on the Future of Health Care in Canada noted in 2001 that the combined public and private expenditure per person each year for medical care was approximately three times as much for persons over 65 than for the average person ($10,834 per person versus $3,174). As health care costs increase with age, the reasoning is that more people entering the 65 and older age group will increase the cost of medical care dramatically. In fact, the cost to the health care system specifically due to aging is projected to be no more than 1% per year (Romanow, 2002). The main sources of cost increase to the health care system come from inflation, rising overall population, and advances in medical technologies (new pharmaceutical drugs, surgical techniques, diagnostic and imaging techniques, and end-of-life care). With respect to end-of-life care, the average Canadian now receives approximately one and a half times more health care services than the average Canadian did in 1975 (Lee, 2007). Even with modest economic growth, existing levels of health care service can be maintained without difficulty if the total increase in costs of health care from all sources, including aging, result in an annual increase in health care budget expenditures of 4.4% over the medium term as expected (Lee, 2007).
Other studies indicate that aging boomers will bring economic growth to the health care industries, particularly in areas like pharmaceutical manufacturing and home health care services (Bierman, 2011). Further, some argue that many of medical advances of the past few decades are a result of boomers’ health requirements. Unlike the elderly of previous generations, boomers do not expect that turning 65 means their active lives are over. They are not willing to abandon work or leisure activities, but they may need more medical support to keep living vigorous lives. This desire of a large group of over-65-year-olds wanting to continue with a high activity level is driving innovation in the medical industry (Shaw, 2012). It is not until the final year of life that health care expenditures undergo a dramatic increase. Approximately one-third to one-half of a typical person’s total health care expenditures occur in the final year of life (Lee, 2007). The implication is that with people living increasingly longer and healthier lives, the issue of the cost of health care and aging needs to be refocused on end-of-life care options.
The economic impact of aging boomers is also an area of concern for many observers. Although the baby boom generation earned more than previous generations and enjoyed a higher standard of living, they also spent their money lavishly and did not adequately prepare for retirement. According to a 2013 report from the Bank of Montreal, the average baby boomer falls about $400,000 short of adequate savings to maintain their lifestyles in retirement. The average senior couple spends approximately $54,000 a year, requiring accumulated savings of $1,352,000 to sustain themselves (not taking into account Canada Pension Plan and Old Age Pension payments). Canadian boomers anticipated they needed savings of $658,000 to feel financially secure in retirement but had only saved an average of $228,000. 71% of boomers said they plan to work part time in retirement (BMO Financial Group, 2013). This will have a ripple effect on the economy as boomers work and spend less.
Just as some observers are concerned about the possibility of the health care system being overburdened, the Canada and Quebec Pension Plans are also considered to be at risk given the longer life spans of seniors and low interest rates, according to the Auditor General’s 2014 report (CBC News, 2014). The Canada and Quebec Pension Plans are government-run retirement programs funded primarily through payroll taxes. In addition, seniors receive support from the Old Age Security (OAS) program and the Guaranteed Income Supplement (for those with low incomes). Together the pension plans, OAS, and Guaranteed Income Supplements are credited with successfully reducing old age poverty. Poverty rates for elderly couples were reduced from 17.7% to 2.4% between 1976 and 2011, for single men over 65 from 55.9% to 12.2%, and for single women over 65, from 68.1% to 16.1% (MacKenzie, 2014). Observers acknowledge that the systems are run very well, but their payments do not cover cost-of-living expenses, and in the absence of adequate retirement savings, the economic situation of retirees is threatened. With the aging boomer cohort starting to receive pension benefits, and with fewer workers paying into the pension trust fund, it is estimated that by 2021 the fund will have to start drawing on its investment income in order to make payments (Davidson, 2013). As a result, the government has raised the retirement age (the age at which people could start receiving retirement benefits) from 65 to 67, and many are arguing that CPP payments should be increased to ensure the system’s sustainability.
Aging Around the World

From 1950 to approximately 2010, the global population of individuals aged 65 and older increased by a range of 5 to 7% (Lee, 2009). This percentage is expected to increase and will have a huge impact on the dependency ratio: the number of productive working citizens to non-productive (young, with a disability, elderly) (Bartram and Roe, 2005). One country that will soon face a serious aging crisis is China, which is on the cusp of an “aging boom”: a period when its elderly population will dramatically increase. The number of people above age 60 in China today is about 178 million, which amounts to 13.3% of its total population (Xuequan, 2011). By 2050, nearly a third of the Chinese population will be age 60 or older, putting a significant burden on the labour force and impacting China’s economic growth (Bannister, Bloom, and Rosenberg, 2010).
As health care improves and life expectancy increases across the world, elder care will be an emerging issue. Wienclaw (2009) suggests that with fewer working-age citizens available to provide home care and long-term assisted care to the elderly, the costs of elder care will increase.
Worldwide, the expectation governing the amount and type of elder care varies from culture to culture. For example, in Asia the responsibility for elder care lies firmly on the family (Yap, Thang, and Traphagan, 2005). This is different from the approach in most Western countries, where the elderly are considered independent and are expected to tend to their own care. It is not uncommon for family members to intervene only if the elderly relative requires assistance, often due to poor health. Even then, caring for the elderly is considered voluntary. In North America, decisions to care for an elderly relative are often conditionally based on the promise of future returns, such as inheritance or, in some cases, the amount of support the elderly provided to the caregiver in the past (Hashimoto, 1996).
These differences are based on cultural attitudes toward aging. In China, several studies have noted the attitude of filial piety (deference and respect to one’s parents and ancestors in all things) as defining all other virtues (Hamilton, 1990; Hsu, 1971). Cultural attitudes in Japan prior to approximately 1986 supported the idea that the elderly deserve assistance (Ogawa and Retherford, 1993). However, seismic shifts in major social institutions (like family and economy) have created an increased demand for community and government care. For example, the increase in women working outside the home has made it more difficult to provide in-home care to aging parents, leading to an increase in the need for government-supported institutions (Raikhola and Kuroki, 2009).
In North America, by contrast, many people view caring for the elderly as a burden. Even when there is a family member able and willing to provide for an elderly family member, 60% of family caregivers are employed outside the home and are unable to provide the needed support. At the same time, however, many middle-class families are unable to bear the financial burden of “outsourcing” professional health care, resulting in gaps in care (Bookman and Kimbrel, 2011). Chinese Canadians, for example, are thought to have a higher sense of filial responsibility and to perceive providing family assistance for the elderly as a more normal aspect of life than Caucasian Canadians (Funk, Chappell, and Liu, 2013). It is important to note that even within a country, not all demographic groups treat aging the same way. While most Americans are reluctant to place their elderly members into out-of-home assisted care, demographically speaking, the groups least likely to do so are Latinos, African Americans, and Asians (Bookman and Kimbrel, 2011).
Globally, Canada and other wealthy nations are well equipped to handle the demands of an exponentially increasing elderly population. However, peripheral and semi-peripheral nations face similar increases without comparable resources. Poverty among elders is a concern, especially among elderly women. The feminization of the aging poor, evident in peripheral nations, is directly due to the number of elderly women in those countries who are single, illiterate, and not a part of the labour force (Mujahid, 2006).
In 2002, the Second World Assembly on Aging was held in Madrid, Spain, resulting in the Madrid Plan, an internationally coordinated effort to create comprehensive social policies to address the needs of the worldwide aging population. The plan identifies three themes to guide international policy on aging: 1) publicly acknowledging the global challenges caused by, and the global opportunities created by, a rising global population; 2) empowering the elderly; and 3) linking international policies on aging to international policies on development (Zelenev, 2008).
The Madrid Plan has not yet been successful in achieving all its aims. However, it has increased awareness of the various issues associated with a global aging population, as well as raising the international consciousness to the way that the factors influencing the vulnerability of the elderly (social exclusion, prejudice and discrimination, and a lack of socio-legal protection) overlap with other developmental issues (basic human rights, empowerment, and participation), leading to an increase in legal protections (Zelenev, 2008).
Media Attributions
- Figure 13.2 Thoughtful Moment by Sean and Lauren Spectacular, via Flickr, is used under a CC BY 2.0 licence.
- Figure 13.3 Population pyramid from U.S. Census Bureau, International Data Base is in the public domain.
- Figure 13.4 Figure 2 Portrait of generations, using the age pyramid, Canada, 2011, Statistics Canada, Census of Population, 2011 is used under the Statistics Canada Open Licence.
- Figure 13.5 Raging Grannies by Philip, via Flickr, is used under CC BY NC 2.0 licence.
- Figure 13.6 Chart 2.5 Sex ratio by age group, 1995 and 2015, Canada is used under the Statistics Canada Open Licence.
- Figure 13.7 Figure 2 Portrait of generations, using the age pyramid, Canada, 2011 is used under the Statistics Canada Open Licence.
- Figure 13.8 Old Man Working by Tom Coppen, via Flickr, is used under a CC BY 2.0 licence.

