Chapter 17 Shorelines
17.1 Waves
Waves form on the ocean and on lakes because energy from the wind is transferred to the water. The stronger the wind, the longer it blows, and the larger the area of water over which it blows (the fetch), the larger the waves are likely to be.
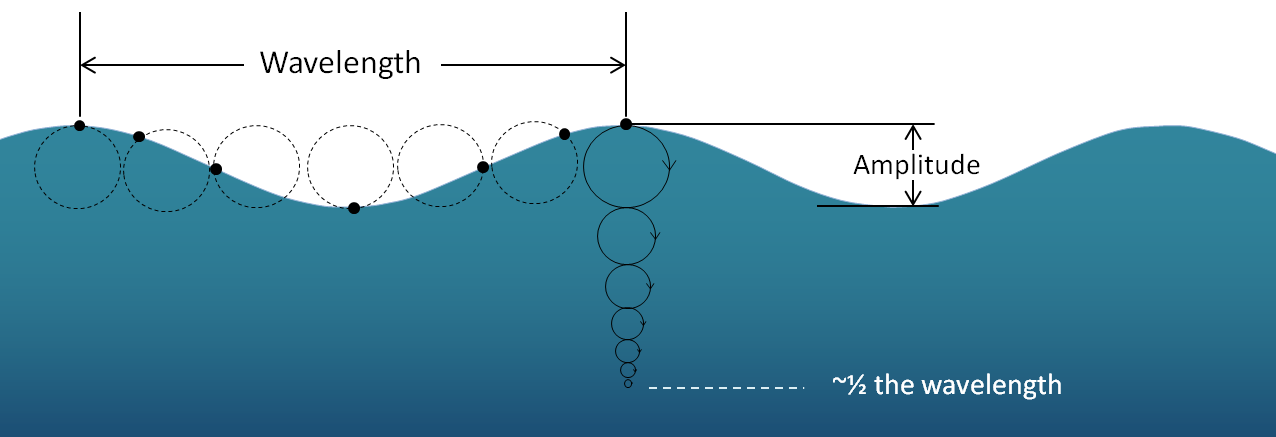
The important parameters of a wave are the wavelength (the horizontal distance between two crests or two troughs), the amplitude (the vertical distance between a trough and a crest), and the wave velocity (the speed at which wave crests move across the water) (Figure 17.1.1).

The typical sizes and speeds of waves in situations where they have had long enough to develop fully are summarized in Table 17.1. In a situation where the fetch is short (say 19 km on a lake) and the wind is only moderate (19 km/h), the waves will develop fully within 2 hours, but they will remain quite small (average amplitude about 27 cm, wavelength 8.5 m). On a large body of water (the ocean or a very large lake) with a fetch of 139 km and winds of 37 km/h, the waves will develop fully in 10 hours; the average amplitude will be around 1.5 m and average wavelength around 34 m. In the open ocean, with strong winds (92 km/h) that blow for at least 69 hours, the waves will average nearly 15 m high and their wavelengths will be over 200 m. Small waves (amplitudes under a metre) tend to have relatively shallow slopes (amplitude is 3% to 4% of wavelength), while larger waves (amplitudes over 10 m) have much steeper slopes (amplitude is 6% to 7% of wavelength). In other words, not only are large waves bigger than small ones, they are also generally more than twice as steep, and therefore many times more impressive—and potentially dangerous. It is important to recognize, however, that amplitudes decrease with distance from the area where the waves were generated. Waves on our coast that are generated by a storm near Japan will have similar wavelengths but lower amplitudes than those generated by a comparable storm just offshore.
| [Skip Table] | |||||||
| Wind Speed (kilometres per hour) | Fetch (kilometres) | Duration (hours) | Amplitude (metres) | Wavelength (metres) | Wave Period (seconds) | Wave Velocity (metres per second) | Wave Velocity (kilometres per hour) |
|---|---|---|---|---|---|---|---|
| 19 | 19 | 2 | 0.27 | 8.5 | 3.0 | 2.8 | 10.2 |
| 37 | 139 | 10 | 1.5 | 33.8 | 5.7 | 5.9 | 19.5 |
| 56 | 518 | 23 | 4.1 | 76.5 | 8.6 | 8.9 | 32.0 |
| 74 | 1,313 | 42 | 8.5 | 136 | 11.4 | 11.9 | 42.9 |
| 92 | 2,627 | 69 | 14.8 | 212 | 14.3 | 14.8 | 53.4 |
Exercise 17.1 Wave height versus length
This table shows the typical amplitudes and wavelengths of waves generated under different wind conditions. The steepness of a wave can be determined from these numbers and is related to the ratio: amplitude/wavelength.
- Calculate these ratios for the waves shown. The first one is done for you.
- How would these ratios change with increasing distance from the wind that produced the waves?
| Amplitude (metres) | Wavelength (metres) | Ratio (amplitude divided by wavelength) |
|---|---|---|
| 0.27 | 8.5 | 0.03 |
| 1.5 | 33.8 | |
| 4.1 | 76.5 | |
| 8.5 | 136 | |
| 14.8 | 212 |
See Appendix 3 for Exercise 17.1 answers.
Relatively small waves move at up to about 10 km/h and arrive on a shore about once every 3 seconds. Very large waves move about five times faster (over 50 km/h), but because their wavelengths are so much longer, they arrive less frequently—about once every 14 seconds.
As a wave moves across the surface of the water, the water itself mostly just moves up and down and only moves a small amount in the direction of wave motion. As this happens, a point on the water surface describes a circle with a diameter that is equal to the wave amplitude (Figure 17.1.2). This motion is also transmitted to the water underneath, and the water is disturbed by a wave to a depth of approximately one-half of the wavelength. Wave motion is illustrated quite clearly on the Wikipedia “Wind wave” site. If you look carefully at that animation, and focus on the small white dots in the water, you should be able to see how the amount that they move decreases with depth.
The one-half wavelength depth of disturbance of the water beneath a wave is known as the wave base. Since ocean waves rarely have wavelengths greater than 200 m, and the open ocean is several thousand metres deep, the wave base does not normally interact with the bottom of the ocean. However, as waves approach the much shallower water near the shore, they start to “feel” the bottom, and they are affected by that interaction (Figure 17.1.3). The wave “orbits” are both flattened and slowed by dragging, and the implications are that the wave amplitude (height) increases and the wavelength decreases (the waves become much steeper). The ultimate result of this is that the waves lean forward, and eventually break (Figure 17.1.4).

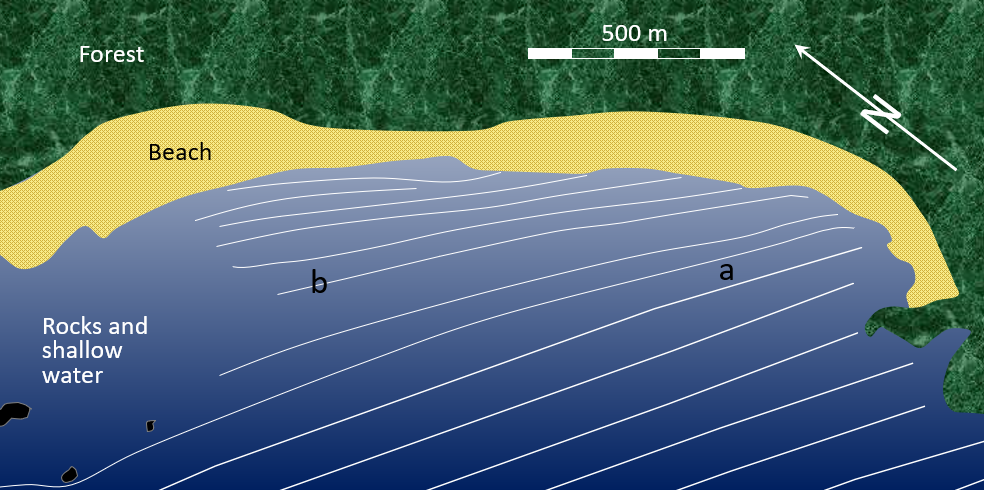
Waves normally approach the shore at an angle, and this means that one part of the wave feels the bottom sooner than the rest of it, so the part that feels the bottom first slows down first. This process is illustrated in Figure 17.1.5, which is based on an aerial photograph showing actual waves approaching Long Beach on Vancouver Island. When the photo was taken, the waves (with crests shown as white lines in the diagram) were approaching at an angle of about 20° to the beach. The waves first reached shore at the southern end (“a” on the image). As they moved into shallow water they were slowed, and since the parts of the waves still in deep water (“b” on the image) were not slowed they were able catch up, and thus the waves became more parallel to the beach.
In open water, these waves had wavelengths close to 100 m. In the shallow water closer to shore, the wavelengths decreased to around 50 m, and in some cases, even less.
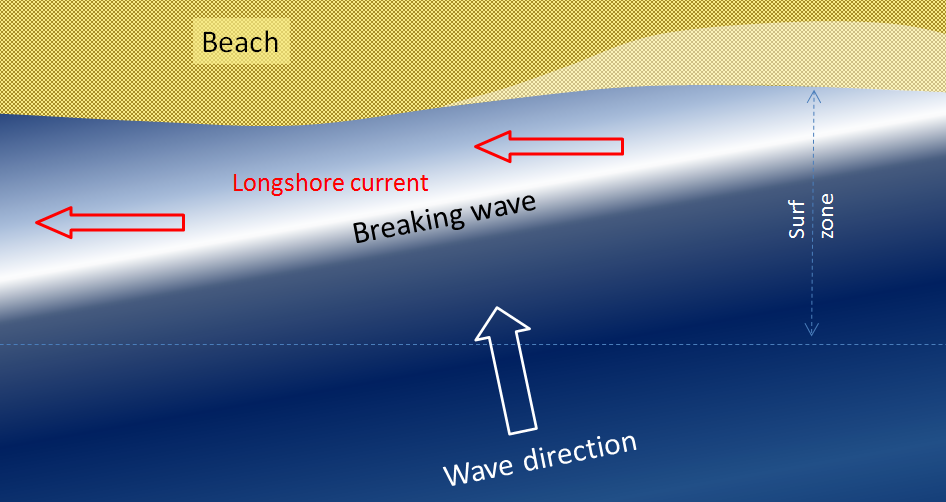
Even though they bend and become nearly parallel to shore, most waves still reach the shore at a small angle, and as each one arrives, it pushes water along the shore, creating what is known as a longshore current within the surf zone (the areas where waves are breaking) (Figure 17.1.6).
Exercise 17.2 Wave refraction

A series of waves (dashed lines) is approaching the coast on the map shown here.
The location of the depth contour that is equivalent to 1/2 of the wavelength is shown as a red dashed line.
Draw in the next several waves, showing how their patterns will change as they approach shallow water and the shore.
Show, with arrows, the direction of the resulting longshore current.
See Appendix 3 for Exercise 17.2 answers.
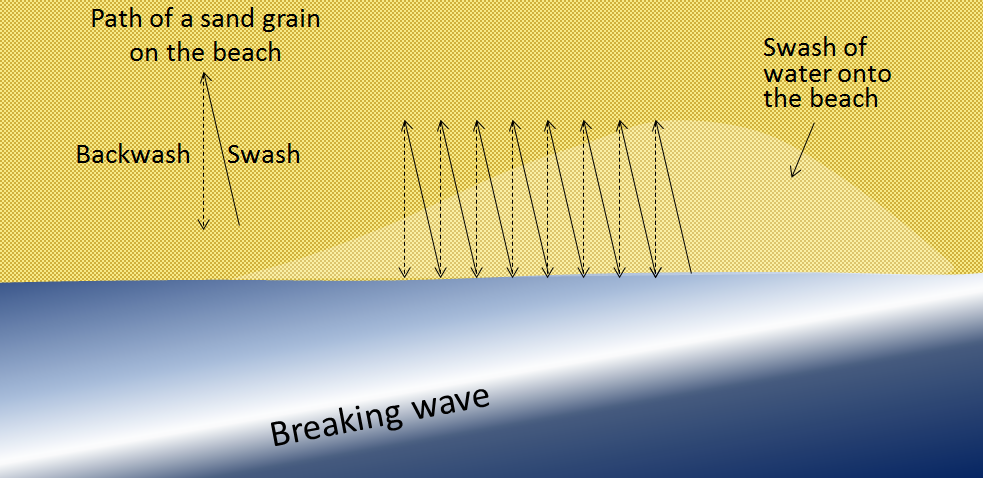
Another important effect of waves reaching the shore at an angle is that when they wash up onto the beach, they do so at an angle, but when that same wave water flows back down the beach, it moves straight down the slope of the beach (Figure 17.1.8). The upward-moving water, known as the swash, pushes sediment particles along the beach, while the downward-moving water, the backwash, brings them straight back. With every wave that washes up and then down the beach, particles of sediment are moved along the beach in a zigzag pattern.
The combined effects of sediment transport within the surf zone by the longshore current and sediment movement along the beach by swash and backwash is known as longshore drift. Longshore drift moves a tremendous amount of sediment along coasts (both oceans and large lakes) around the world, and it is responsible for creating a variety of depositional features that we’ll discuss in section 17.3.
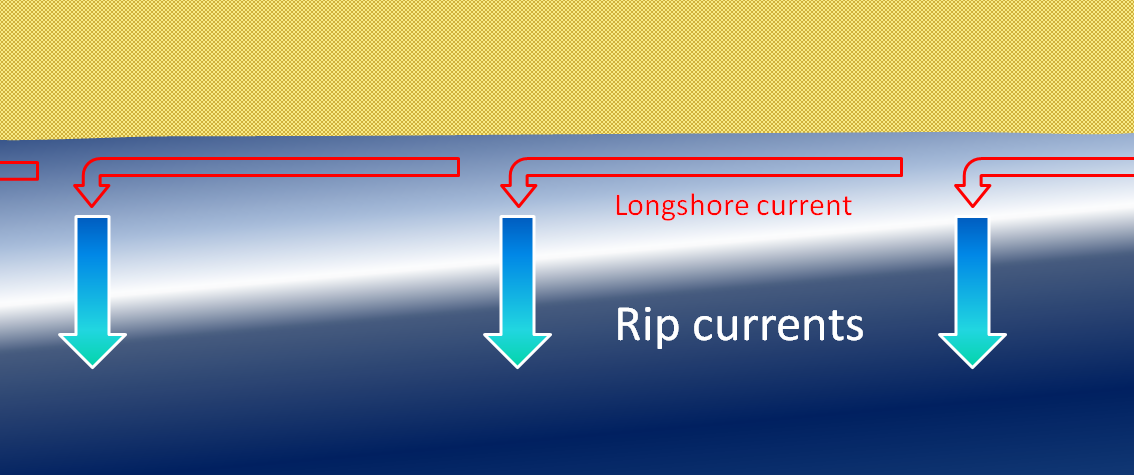
A rip current is another type of current that develops in the nearshore area, and has the effect of returning water that has been pushed up to the shore by incoming waves. As shown in Figure 17.1.9, rip currents flow straight out from the shore and are fed by the longshore currents. They die out quickly just outside the surf zone, but can be dangerous to swimmers who get caught in them. If part of a beach does not have a strong unidirectional longshore current, the rip currents may be fed by longshore currents going in both directions.
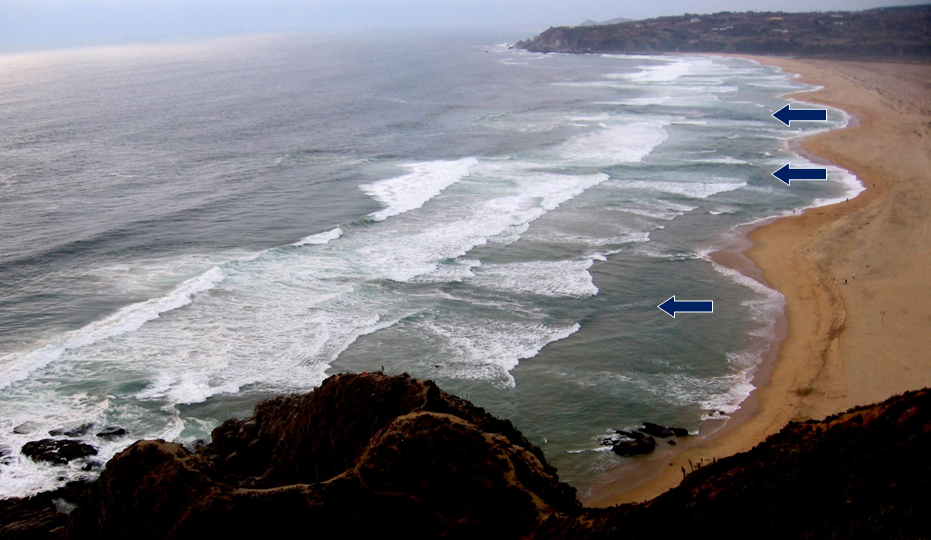
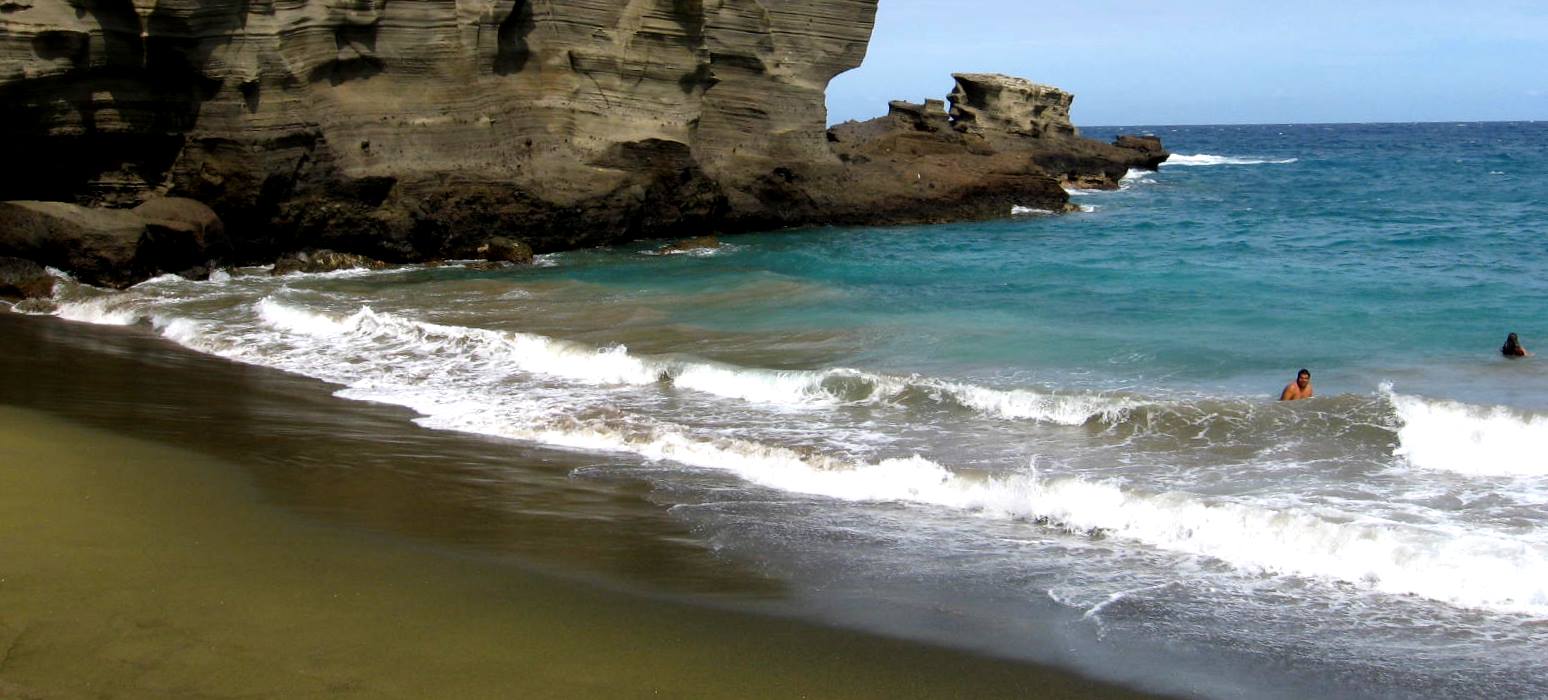
Rip currents are visible in Figure 17.1.10, a beach at Tunquen in Chile near Valparaiso. As is evident from the photo, the rips correspond with embayments in the beach profile. Three of them are indicated with arrows, but it appears that there may be several others farther along the beach.
Tides are related to very long-wavelength but low-amplitude waves on the ocean surface (and to a much lesser extent on very large lakes) that are caused by variations in the gravitational effects of the Sun and Moon. Tide amplitudes in shoreline areas vary quite dramatically from place to place. On the west coast of Canada, the tidal range is relatively high, in some areas as much as 6 m, while on most of the east coast the range is lower, typically around 2 m. A major exception is the Bay of Fundy between Nova Scotia and New Brunswick, where the daily range can be as great as 16 m. Anomalous tides like that are related to the shape and size of bays and inlets, which can significantly enhance the amplitude of the tidal surge. The Bay of Fundy has a natural oscillation cycle of 12.5 hours, and that matches the frequency of the rise and fall of the tides in the adjacent Atlantic Ocean. Ungava Bay, on Quebec’s north coast, has a similarly high tidal range.
As the tides rise and fall they push and pull a large volume of water in and out of bays and inlets and around islands. They do not have as significant an impact on coastal erosion and deposition as wind waves do, but they have an important influence on the formation of features within the intertidal zone, as we’ll see in the following sections.
Media Attributions
- Figures 17.1.1, 17.1.2, 17.1.3, 17.1.6, 17.1.7, 17.1.8, 17.1.9: © Steven Earle. CC BY.
- Figure 17.1.10: “Tunquen Chile” by Cecilia and Randy Lascody. Public domain.
- Table by Steven Earle from data at: http://en.wikipedia.org/wiki/Wind_wave] ↵
the distance over which wind blows to form waves
the distance between the crests of two waves
for any type of wave, the difference in height between a crest and the adjacent trough
the lowest point of a wave
the highest point on a wave
the depth of water that is affected by the sub-surface orbital motion of wave action (approximately one-half of the wavelength)
the movement of water along a shoreline produced by the approach of waves at an angle to the shore
the near-shore zone where waves are breaking into surf
the upward motion of a wave on a beach (typically takes place at the same angle that the waves are approaching the shore)
the wash of wave water down the slope of a beach
the movement of sediment along a shoreline resulting from a longshore current and also from the swash and backwash on a beach face
a strong flow of water outward from a beach
