Chapter 19 Climate Change
19.1 What Makes the Climate Change?
There are two parts to climate change, the first one is known as climate forcing, which is when conditions change to give the climate a little nudge in one direction or the other. The second part of climate change, and the one that typically does most of the work, is what we call a feedback. When a climate forcing changes the climate a little, a whole series of environmental changes take place, many of which either exaggerate the initial change (positive feedbacks), or suppress the change (negative feedbacks).
An example of a climate-forcing mechanism is the increase in the amount of carbon dioxide (CO2) in the atmosphere that results from our use of fossil fuels. CO2 traps heat in the atmosphere and leads to climate warming. Warming changes vegetation patterns; contributes to the melting of snow, ice, and permafrost; causes sea level to rise; reduces the solubility of CO2 in sea water; and has a number of other minor effects. Most of these changes contribute to more warming. Melting of permafrost, for example, is a strong positive feedback because frozen soil contains trapped organic matter that is converted to CO2 and methane (CH4) when the soil thaws. Both these gases accumulate in the atmosphere and add to the warming effect. On the other hand, if warming causes more vegetation growth, that vegetation should absorb CO2, thus reducing the warming effect, which would be a negative feedback. Under our current conditions—a planet that still has lots of glacial ice and permafrost—most of the feedbacks that result from a warming climate are positive feedbacks and so the climate changes that we cause get naturally amplified by natural processes.
What is a greenhouse gas?
Throughout this chapter we’ll be talking about the role of greenhouse gases (GHGs) in controlling the climate, so it’s important to understand what greenhouse gases are and how they work. As you know, the dominant gases of the atmosphere are nitrogen (as N2) and oxygen (as O2). These gas molecules have only two atoms each and are not GHGs. Some of the other important gases of the atmosphere are water vapour (H2O), carbon dioxide (CO2), and methane (CH4). All of these have more than two atoms, and they are GHGs.
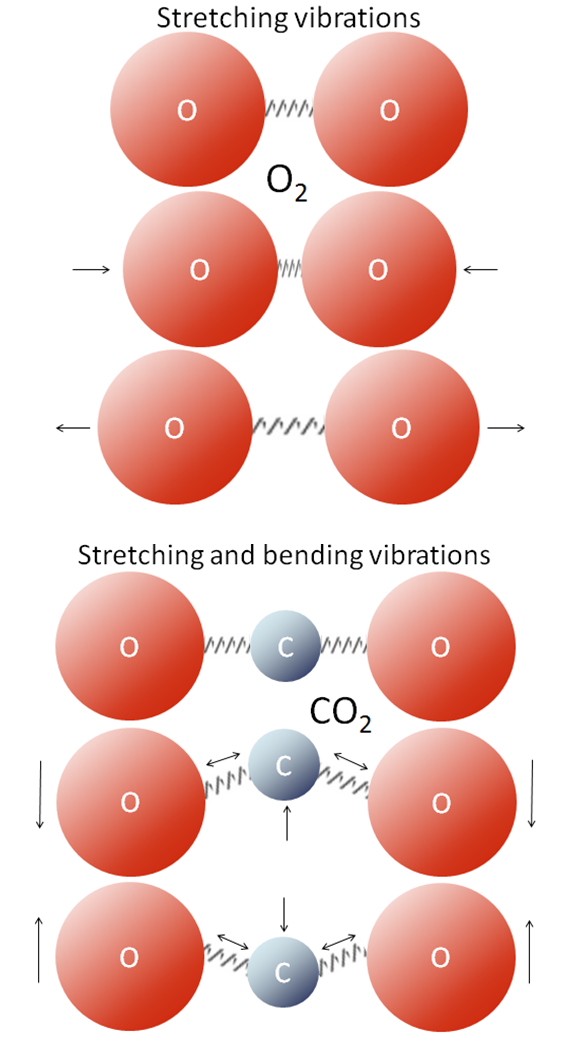
All molecules vibrate at various frequencies and in various ways, and some of those vibrations take place at frequencies within the range of the infrared (IR) radiation that is emitted by Earth’s surface. Gases with two atoms, such as O2, can only vibrate by stretching (back and forth), and those vibrations are much faster than the IR radiation (Figure 19.1.1). Gases with three or more atoms (such as CO2) vibrate by stretching as well, but they can also vibrate in other ways, such as by bending. Those vibrations are slower and match IR radiation frequencies.
When IR radiation interacts with CO2 or with one of the other GHGs, the molecular vibrations are enhanced because there is a match between the wavelength of the IR light and the vibrational frequency of the molecule. This makes the molecule vibrate more vigorously, heating the surrounding air in the process. These molecules also emit IR radiation in all directions, some of which reaches Earth’s surface. The heating caused by the more vigorous vibrations of GHGs is the greenhouse effect.
Natural Climate Forcing
Natural climate forcing has been going on throughout geological time. A wide range of processes has been operating at widely different time scales, from a few years to billions of years.
The longest-term natural forcing variation is related to the evolution of the Sun. Like most other stars of a similar mass, our Sun is evolving. For the past 4.57 billion years, its rate of nuclear fusion has been increasing, and it is now emitting about 40% more energy (as light) than it did at the beginning of geological time (Figure 19.1.2). A difference of 40% is big, so it’s a little surprising that the temperature on Earth has remained at a reasonable and habitable temperature for all of this time. The mechanism for that relative climate stability has been the evolution of our atmosphere from one that was dominated by CO2, and also had significant levels of CH4—both GHGs—to one with only a few hundred parts per million of CO2 and just under 1 part per million of CH4. Those changes to our atmosphere have been no accident; over geological time, life and its metabolic processes have evolved and changed the atmosphere to conditions that remained cool enough to be habitable. A scientific explanation for how this could happen is known as the Gaia hypothesis.
The Gaia hypothesis

The Gaia hypothesis, developed by British scientist and environmentalist James Lovelock in the 1960s, is the theory that organisms evolve in ways that contribute to ensuring that their environment remains habitable. It does not include any sort of coordination of effort among organisms or any consciousness of a need to make changes. Gaia is not a superorganism. A way of understanding Gaia is through Lovelock’s simple Daisyworld model. A planet with a warming star is populated only by two types of daisies, white ones and black ones (Figure 19.1.3). The black ones contribute to warming because they absorb solar energy, while the white ones reflect light and contribute to cooling. As the star’s luminosity gradually increases, the white daisies have better outcomes because their reflectivity cools their local environment, while the black daisies, suffering from the heat, do not reproduce as well. Over time white daisies gradually dominate the population, but eventually the star becomes so bright that even white daisies cannot compensate, and all of the daisies perish. Obviously Earth is not Daisyworld, but similar processes—such as the evolution of photosynthetic bacteria that consume CO2—have taken place that influence the atmosphere and moderate the climate.
Plate tectonic processes contribute to climate forcing in several different ways, and on time scales ranging from tens of millions to hundreds of millions of years. One mechanism is related to continental position. For example, we know that Gondwana (South America + Africa + Antarctica + Australia) was positioned over the South Pole between about 450 and 250 Ma, during which time there were two major glaciations (Andean-Saharan and Karoo) affecting the South polar regions (Figure 16.1.1) and cooling the rest of the planet at the same time. Another mechanism is related to continental collisions. As described in Chapter 16, the collision between India and Asia, which started at around 50 Ma, resulted in massive tectonic uplift. The consequent accelerated weathering of this rugged terrain consumed CO2 from the atmosphere and contributed to gradual cooling over the remainder of the Cenozoic. Also, as described in Chapter 16, the opening of the Drake Passage — due to plate-tectonic separation of South America from Antarctica — led to the development of the Antarctic Circumpolar Current, which isolated Antarctica from the warmer water in the rest of the ocean and thus contributed to Antarctic glaciation starting at around 35 Ma.
As we discussed in Chapter 4, volcanic eruptions don’t just involve lava flows and exploding rock fragments; various particulates and gases are also released, the important ones being sulphur dioxide and CO2. Sulphur dioxide is an aerosol that reflects incoming solar radiation and has a net cooling effect that is short lived (a few years in most cases, as the particulates settle out of the atmosphere within a couple of years), and doesn’t typically contribute to longer-term climate change. Volcanic CO2 emissions can contribute to climate warming but only if a greater-than-average level of volcanism is sustained over a long time (at least tens of thousands of years). It is widely believed that the catastrophic end-Permian extinction (at 250 Ma) resulted from warming initiated by the eruption of the massive Siberian Traps over a period of at least a million years.
Exercise 19.1 Climate change at the K-Pg boundary
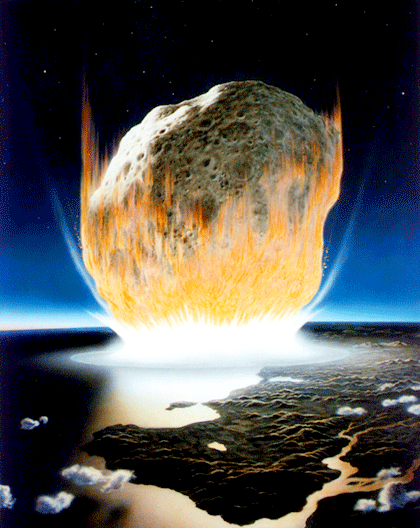
The large extraterrestrial impact at the end of the Cretaceous (Cretaceous-Paleogene or K-Pg boundary, a.k.a. K-T boundary) is thought to have produced a massive amount of dust, which may have remained in the atmosphere for several years, and also a great deal of CO2. What do you think would have been the short-term and longer-term climate-forcing implications of these two factors?
See Appendix 3 for Exercise 19.1 answers.
Earth’s orbit around the Sun is nearly circular, but like all physical systems, it has natural oscillations. First, the shape of the orbit changes on a regular time scale — close to 100,000 years — from being close to circular to being very slightly elliptical. But the circularity of the orbit is not what matters; it is the fact that as the orbit becomes more elliptical, the position of the Sun within that ellipse becomes less central or more eccentric (Figure 19.1.5a). Eccentricity is important because when it is high, the Earth-Sun distance varies more from season to season than it does when eccentricity is low.
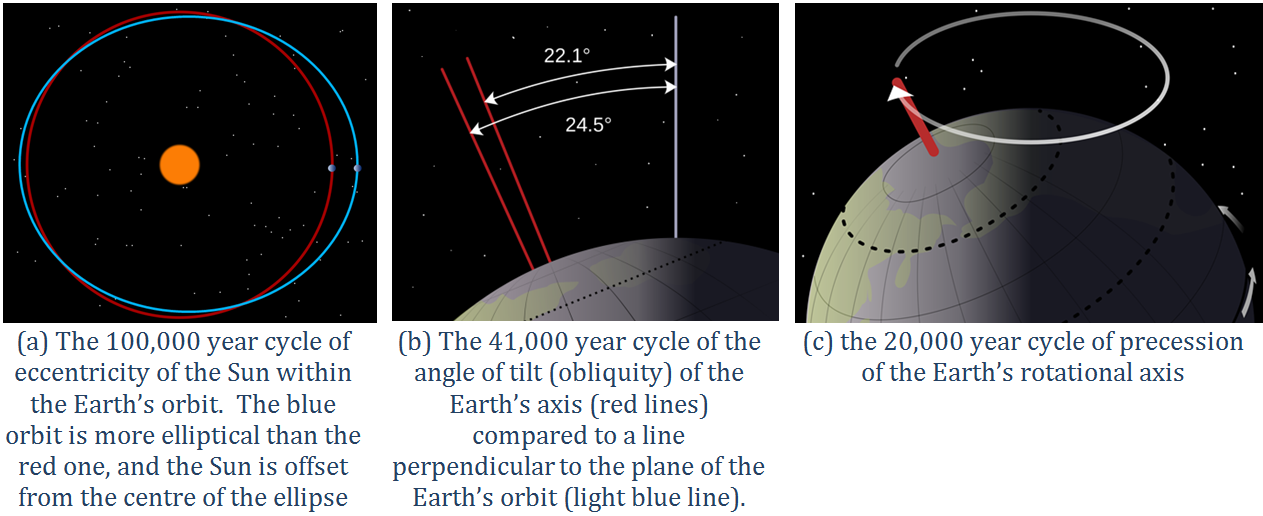
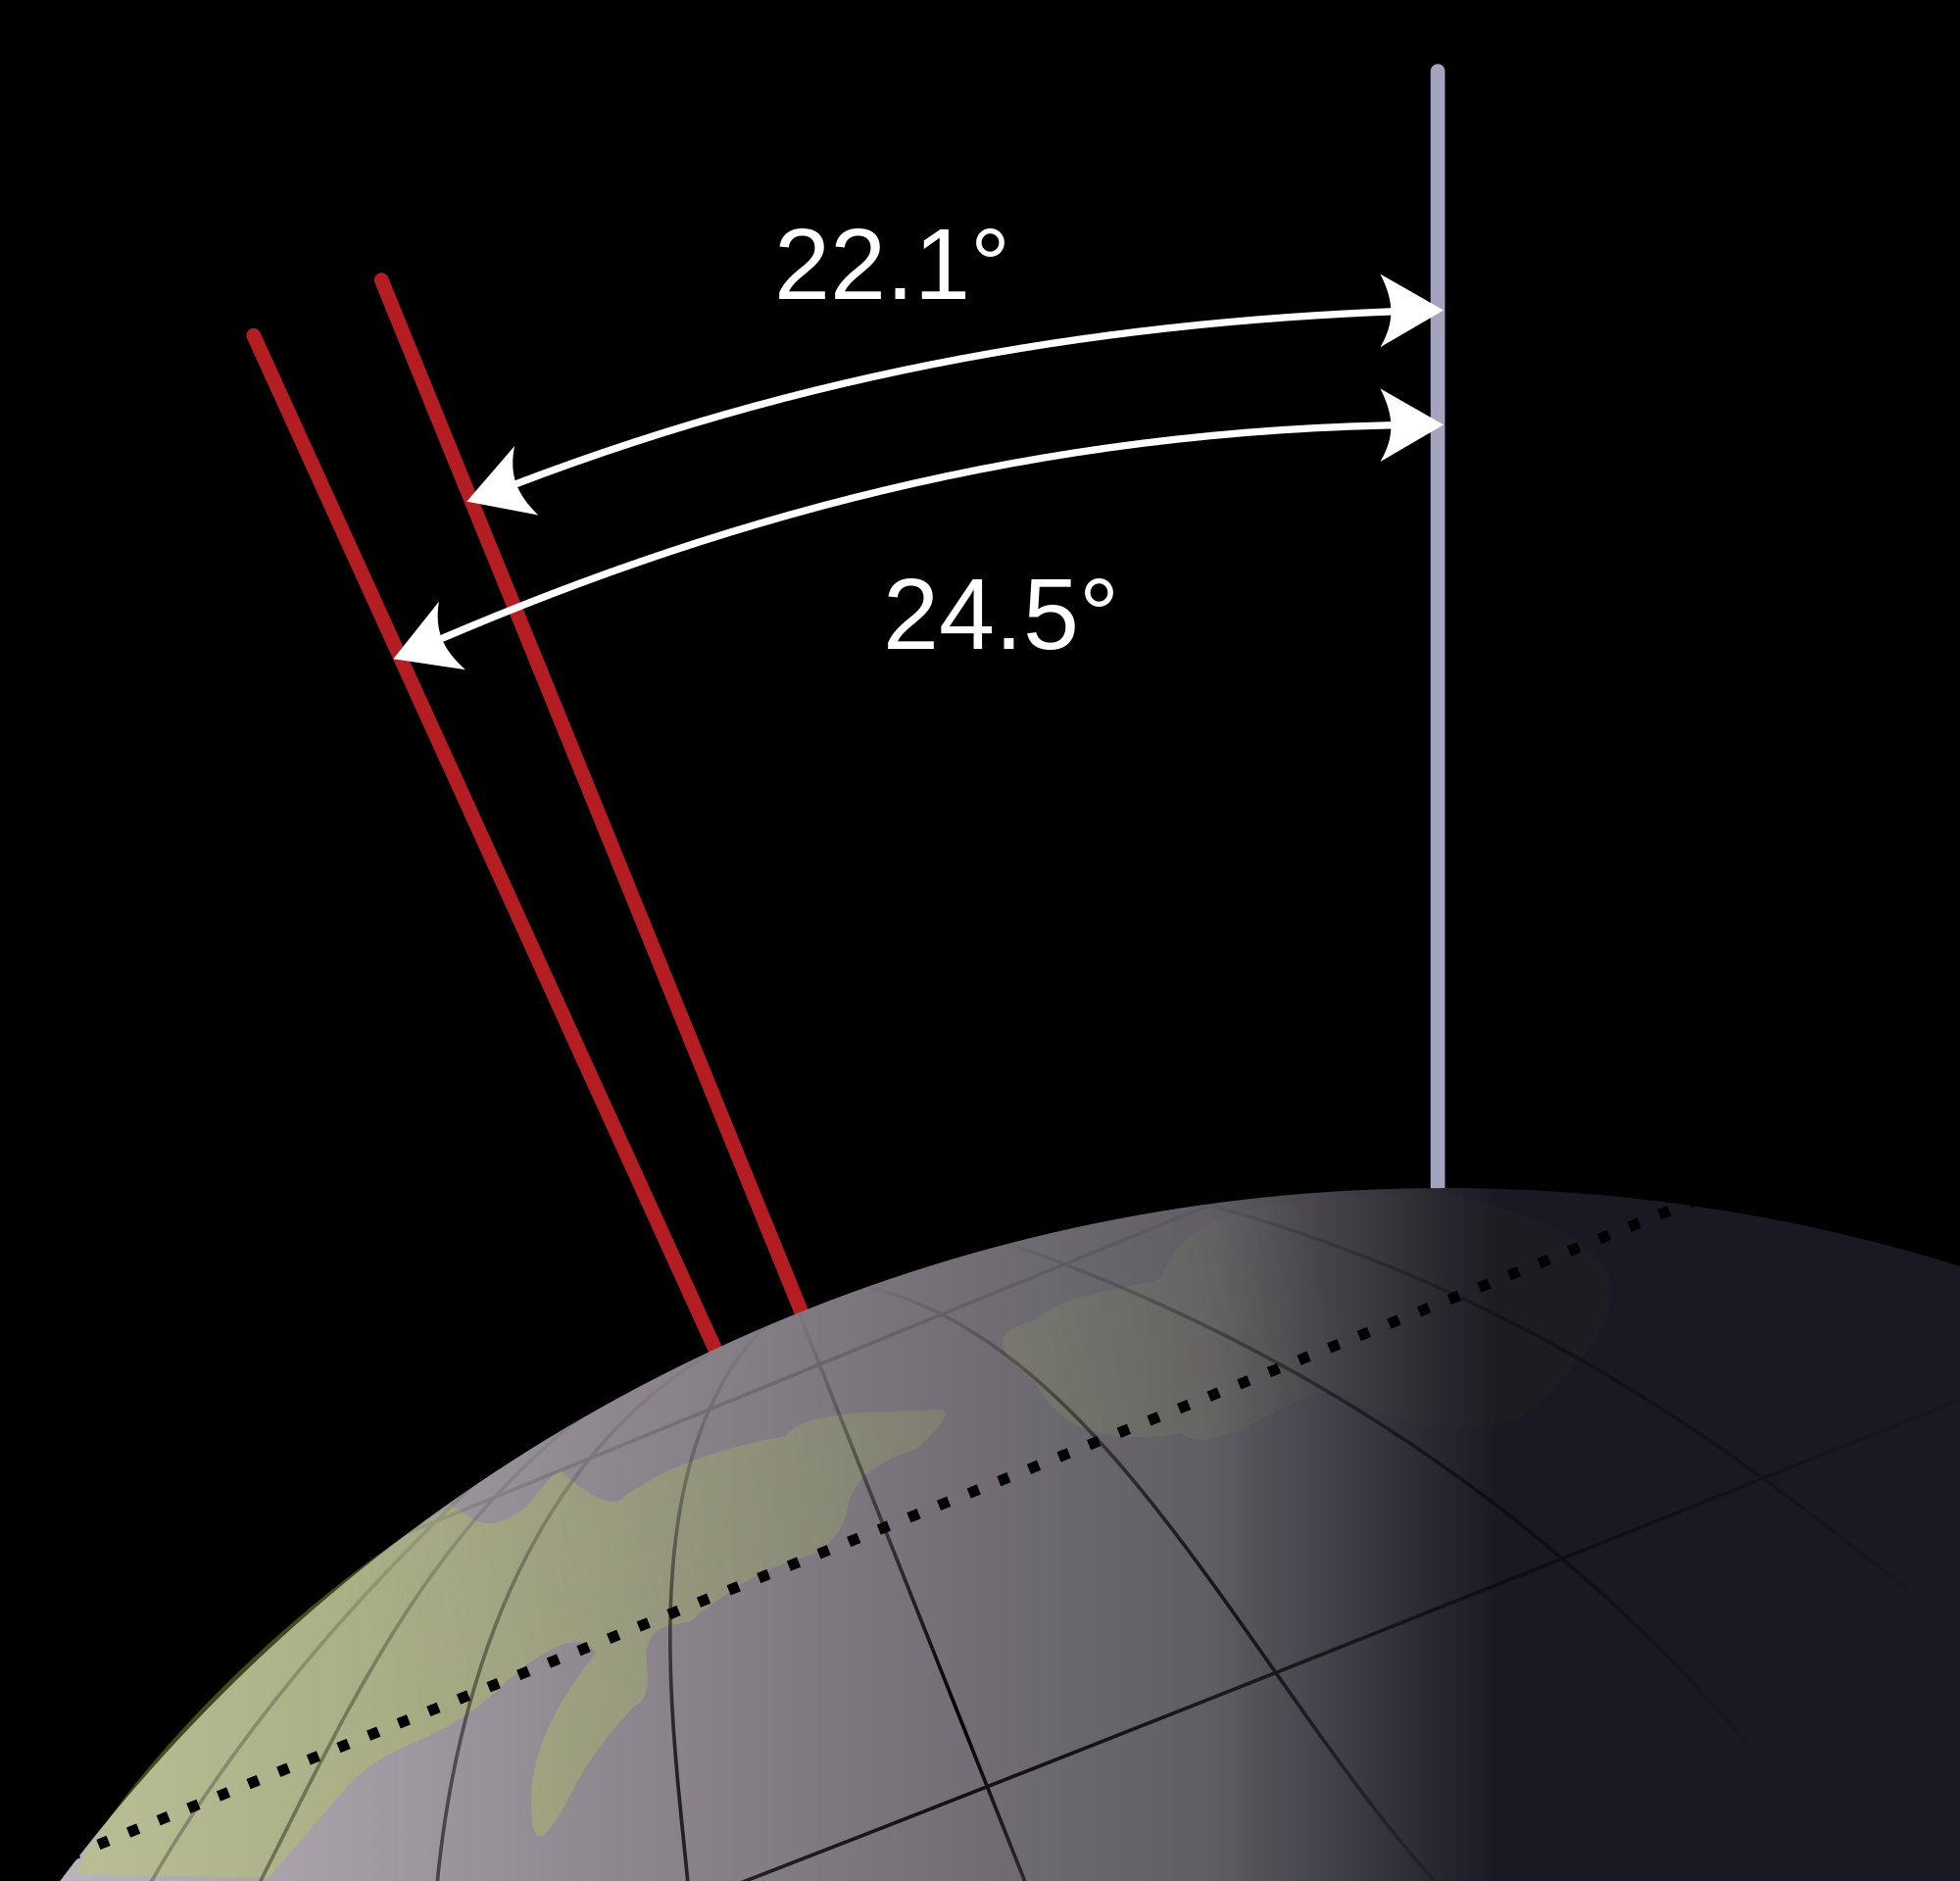
Second, Earth rotates around an axis through the North and South Poles, and that axis is at an angle to the plane of Earth’s orbit around the Sun (Figure 19.1.5b). The angle of tilt (also known as obliquity) varies on a time scale of 41,000 years. When the angle is at its maximum (24.5°), Earth’s seasonal differences are accentuated. When the angle is at its minimum (22.1°), seasonal differences are minimized. The current hypothesis is that glaciation is favoured at low seasonal differences as summers would be cooler and snow would be less likely to melt and more likely to accumulate from year to year.
Third, the direction in which Earth’s rotational axis points also varies, on a time scale of about 20,000 years (Figure 19.1.5c). This variation, known as precession, means that although the North Pole is presently pointing to the star Polaris (the pole star), in 10,000 years it will point to the star Vega.
The importance of eccentricity, tilt, and precession to Earth’s climate cycles (now known as Milankovitch Cycles) was first pointed out by Yugoslavian engineer and mathematician Milutin Milankovitch in the early 1900s. Milankovitch recognized that although the variations in the orbital cycles did not affect the total amount of insolation (light energy from the Sun) that Earth received, it did affect where on Earth that energy was strongest. Glaciations are most sensitive to the insolation received at latitudes of around 65°, and with the current configuration of continents, it would have to be 65° north (because there is almost no land at 65° south).
The most important aspects are whether the northern hemisphere is pointing toward the Sun at its closest or farthest approach, and how eccentric the Sun’s position is in Earth’s orbit. Two opposing situations are illustrated in Figure 19.1.6. In the upper panel, the northern hemisphere is at it farthest distance from the Sun during summer, which means cooler summers. In the lower panel, the northern hemisphere is at its closest distance to the Sun during summer, which means hotter summers. Cool summers—as opposed to cold winters—are the key factor in the accumulation of glacial ice, so the upper scenario in Figure 19.1.6 is the one that promotes glaciation. This factor is greatest when eccentricity is high.
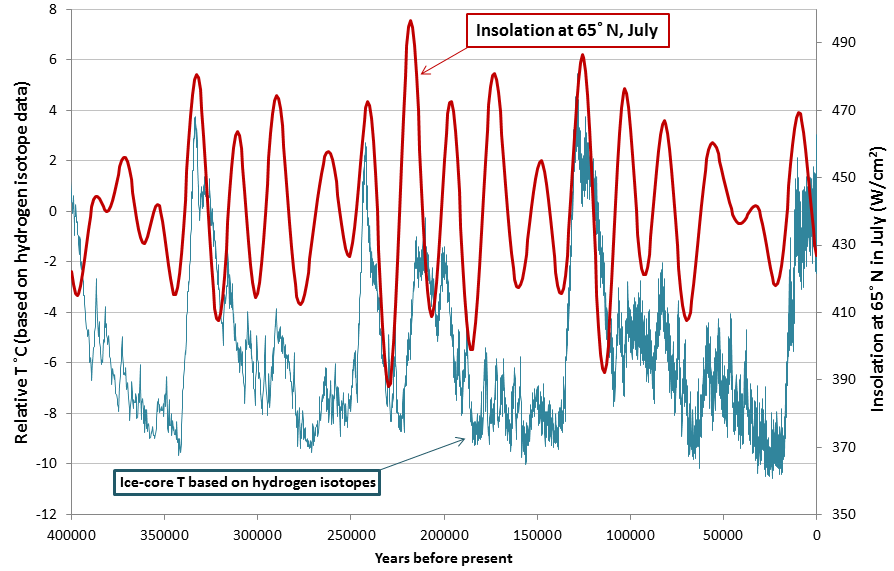
Data for tilt, eccentricity, and precession over the past 400,000 years have been used to determine the insolation levels at 65° north, as shown in Figure 19.1.7. Also shown in Figure 19.1.7 are Antarctic ice-core temperatures from the same time period. The correlation between the two is clear, and it shows up in the Antarctic record because when insolation changes lead to growth of glaciers in the northern hemisphere, southern-hemisphere temperatures are also affected.
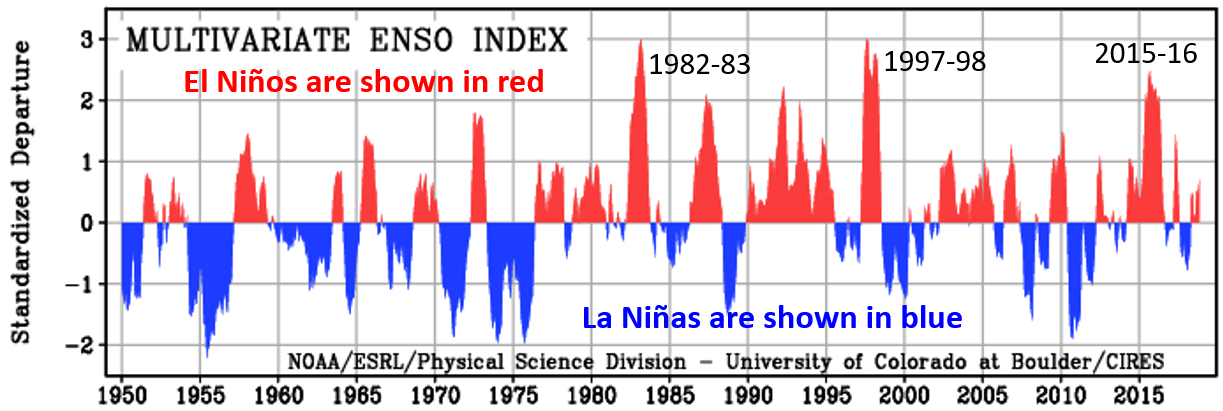
Ocean currents are important to climate, and currents also have a tendency to oscillate. Glacial ice cores show clear evidence of changes in the Gulf Stream (and other parts of the thermohaline circulation system) that affected global climate on a time scale of about 1,500 years during the last glaciation. The east-west changes in sea-surface temperature and surface pressure in the equatorial Pacific Ocean—known as the El Niño Southern Oscillation or ENSO—varies on a much shorter time scale of between two and seven years. These variations tend to garner the attention of the public because they have significant climate implications in many parts of the world. The past 65 years of ENSO index values are shown in Figure 19.1.8. The strongest El Niños in recent decades were in 1983 and 1998, and those were both very warm years from a global perspective. During a strong El Niño, the equatorial Pacific sea-surface temperatures are warmer than normal and heat the atmosphere above the ocean, which leads to warmer-than-average global temperatures.
Climate Feedbacks
As already stated, climate feedbacks are critically important in amplifying weak climate forcings into full-blown climate changes. When Milankovitch published his theory in 1924, it was widely ignored, partly because it was evident to climate scientists that the forcing produced by the orbital variations was not strong enough to drive the significant climate changes of the glacial cycles. Those scientists did not recognize the power of positive feedbacks. It wasn’t until 1973, 15 years after Milankovitch’s death, that sufficiently high-resolution data were available to show that the Pleistocene glaciations were indeed driven by the orbital cycles, and it became evident that the orbital cycles were just the forcing that initiated a range of feedback mechanisms that made the climate change.
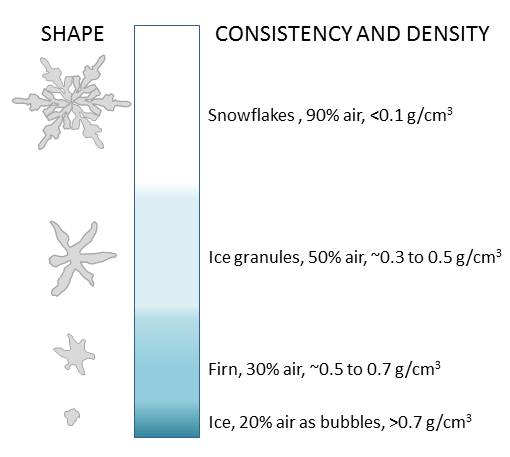
Since Earth still has a very large volume of ice — mostly in the continental ice sheets of Antarctica and Greenland, but also in alpine glaciers and permafrost — melting is one of the key feedback mechanisms. Melting of ice and snow leads to several different types of feedbacks, an important one being a change in albedo. Albedo is a measure of the reflectivity of a surface. Earth’s various surfaces have widely differing albedos, expressed as the percentage of light that reflects off a given material. This is important because most solar energy that hits a very reflective surface is not absorbed and therefore does little to warm Earth. Water in the oceans or on a lake is one of the darkest surfaces, reflecting less than 10% of the incident light, while clouds and snow or ice are among the brightest surfaces, reflecting 70% to 90% of the incident light (Figure 19.1.9).
Exercise 19.2 Albedo implications of forest harvesting
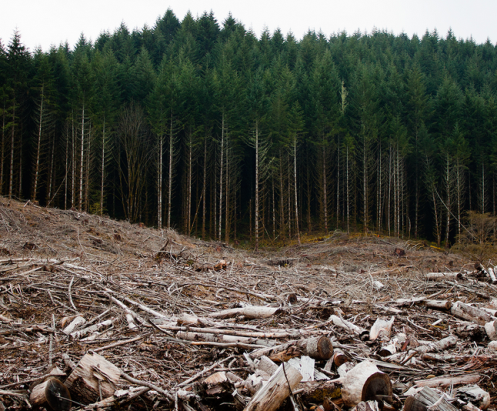
When a forest is harvested, there are significant changes to the rate of biological uptake of CO2, but there is also a change in albedo. Using Figure 19.1.9, and assuming that a clear-cut has an albedo similar to sand, what is the albedo-only implication of clear-cutting for climate change? Be aware that this implication applies only to the albedo change caused by clear-cutting. Clear-cutting reduces the capacity of the area to absorb CO2, and also has numerous negative ecological and geological implications.
See Appendix 3 for Exercise 19.2 answers.
When sea ice melts, as it has done in the Arctic Ocean at a disturbing rate over the past decade, the albedo of the area affected changes dramatically, from around 80% down to less than 10%. This is a positive feedback because much more solar energy is absorbed by the water than by the pre-existing ice, and the temperature increase is amplified. The same applies to ice and snow on land, but the difference in albedo is not as great.
When ice and snow on land melt, sea level rises. (Sea level is also rising because the oceans are warming and that increases their volume.) A higher sea level means a larger proportion of the planet is covered with water, and since water has a lower albedo than land, more heat is absorbed and the temperature goes up a little more. Since the last glaciation, sea-level rise has been about 125 m; a huge area that used to be land is now flooded by heat-absorbent seawater. During the current period of anthropogenic climate change, sea level has risen only about 20 cm, and although that doesn’t make a big change to albedo, sea-level rise is accelerating.
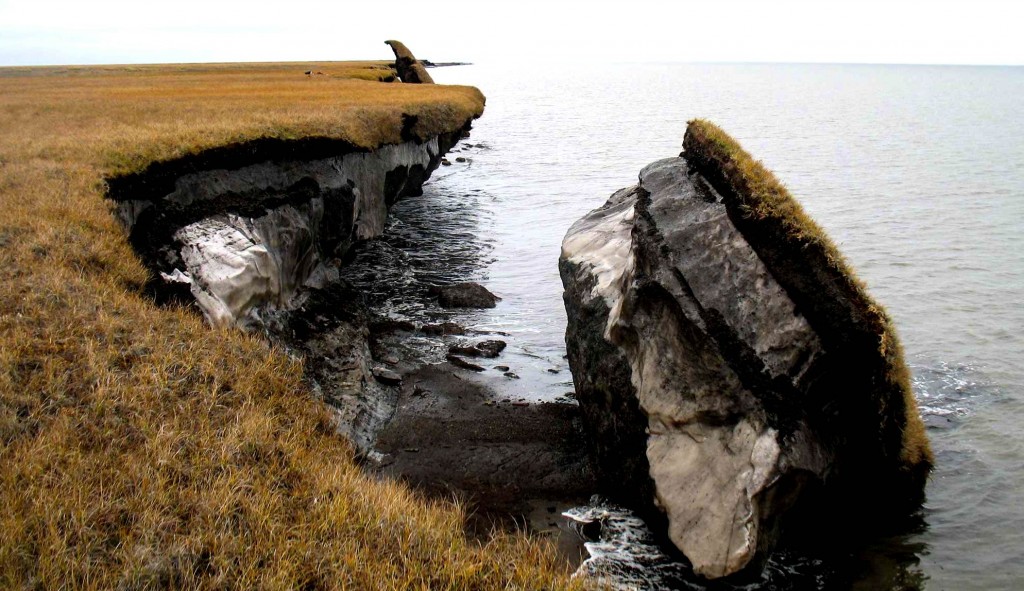
Most of northern Canada has a layer of permafrost that ranges from a few centimetres to hundreds of metres in thickness; the same applies in Alaska, Russia, and Scandinavia. Permafrost is a mixture of soil and ice (Figure 19.1.11), and it also contains a significant amount of trapped organic carbon that is released as CO2 and CH4 when the permafrost breaks down. Because the amount of carbon stored in permafrost is in the same order of magnitude as the amount released by burning fossil fuels, this is a feedback mechanism that has the potential to equal or surpass the forcing that has unleashed it.
In some polar regions, including northern Canada, permafrost includes methane hydrate (see section 18.3), a highly concentrated form of CH4 trapped in solid form. Breakdown of permafrost releases this CH4. Even larger reserves of methane hydrate exist on the sea floor, and while it would take significant warming of ocean water down to a depth of hundreds of metres, this too is likely to happen in the future if we don’t limit our impact on the climate. There is strong isotopic evidence that the Paleocene-Eocene thermal maximum (see Figure 19.0.1) was caused, at least in part, by a massive release of sea-floor methane hydrate.
There is about 45 times as much carbon in the ocean (as dissolved bicarbonate ions, HCO3−) as there is in the atmosphere (as CO2), and there is a steady exchange of carbon between the two reservoirs. But the solubility of CO2 in water decreases as the temperature goes up. In other words, the warmer it gets, the more of that oceanic bicarbonate gets transferred to the atmosphere as CO2. That makes CO2 solubility another positive feedback mechanism.
Vegetation growth responds positively to both increased temperatures and elevated CO2 levels, and so in general, it represents a negative feedback to climate change because the more the vegetation grows, the more CO2 is taken from the atmosphere. But it’s not quite that simple because when trees grow bigger and more vigorously, forests become darker (they have lower albedo) so they absorb more heat. Furthermore, climate warming isn’t necessarily good for vegetation growth; some areas have become too hot, too dry, or even too wet to support the plant community that was growing there, and it might take centuries for something to replace it successfully.
All of these positive (and negative) feedbacks work both ways. For example, during climate cooling, growth of glaciers leads to higher albedos, and formation of permafrost results in storage of carbon that would otherwise have returned quickly to the atmosphere.
Image Descriptions
Figure 19.1.2 image description: Our sun is roughly 4.5 billion years old. Over the next 5 billion years, it will continue getting warmer until it becomes a red giant. Six billion years from now, it will become a planetary nebula and then a white dwarf. [Return to Figure 19.1.2]
Figure 19.1.5 image description:
- The eccentricity of the Sun within the Earth’s orbit goes through a 100,000 year cycle. The Earth’s orbit around the sun can be very circular, but when it becomes more oval-shaped, the Sun is offset from the centre of the ellipse. This means that sometimes the Earth will be farther from the sun than normal and sometimes it will be closer to the sun than normal.
- The angle of tilt (or obliquity) or the Earth’s axis goes through a 41,000 year cycle. When comparing the North Pole to a line perpendicular to the plane of the earth’s orbit, the obliquity can range from 22.1° to 24.5°.
- The Earth’s axial precession operates on a 20,000 year cycle.
Figure 19.1.9 image description: The albedo of Earth’s surfaces: Water=around 5%; Forest=10% to 15%; Sand=30%; Old snow and ice=70%; Cloud=75% to 85%. Fresh snow=90%. Earth’s average albedo is 30%. [Return to Figure 19.1.9]
Media Attributions
- Figure 19.1.1: © Steven Earle. CC BY.
- Figure 19.1.2: “Solar Life Cycle” by Oliverbeatson. Public domain.
- Figure 19.1.3: © Steven Earle. CC BY.
- Figure 19.1.4: “Coast Impact” by Don Davis, NASA. Public domain.
- Figure 19.1.5A: “Eccentricity zero” by NASA. Adapted by Steven Earle. Public domain.
- Figure 19.1.5B: “Earth obliquity range” by NASA. Public domain.
- Figure 19.1.5C: “Earth Precession” by NASA. Public domain.
- Figure 19.1.6: © Steven Earle. CC BY.
- Figure 19.1.7: © Steven Earle. CC BY. Based on data from Valerie Masson-Delmotte, “EPICA Dome C Ice Core 800KYr Deuterium Data and Temperature Estimates,” WDCA Contribution Series Number : 2007 -091, NOAA/NCDC Paleoclimatology Program, Boulder CO, USA. Retrieved from: ftp://ftp.ncdc.noaa.gov/pub/data/paleo/icecore/antarctica/epica_domec/edc3deuttemp2007.txt and from Berger, A. and Loutre, M.F. (1991). Insolation values for the climate of the last 10 million years. Quaternary Science Reviews, 10, 297-317.
- Figure 19.1.8: “Multivariate ENSO Index (MEI)” by NOAA. Adapted by Steven Earle. Public domain.
- Figure 19.1.9: © Steven Earle. CC BY.
- Figure 19.1.10: “Clearcutting-Oregon” © Calibas. CC BY-SA.
- Figure 19.1.11: “Collapsed permafrost block of coastal tundra on Alaska’s Arctic Coast” by the USGS. Public domain.
a mechanism, such as a change in greenhouse gas levels, that forces the climate to change
a process by which the physical effects of a climate forcing can have other effects (either negative or positive) on the climate
a process that results in an increase in that process (in the context of climate change it is a process that enhances the change in climate, such as the reduced reflectivity of the Earth’s surface when ice melts)
a process that results in a decrease in that process (in the context of climate change it is a process that reduces the change in climate, such as the enhanced growth of vegetation in response to an increase in atmospheric carbon dioxide)
ground that remains frozen for two or more years
a gaseous molecule with 3 or more atoms that is able to absorb infrared radiation
in the context of climate, the ability of an atmosphere to absorb infrared radiation due to the presence of greenhouse gases
the hypothesis advanced by James Lovelock that the organisms have affected the atmosphere and oceans such that conditions on Earth have been kept habitable, in spite of significantly changing energy received from the Sun
in the context of Milankovitch Cycles, the degree to which the Sun is offset from the geometric centre of the Earth’s orbit
in the context of Milankovitch Cycles, the angle of the tilt of the Earth’s rotational axis with respect to the plane of its orbit around the Sun
in the context of Milankovitch Cycles, the variation in the direction at which the Earth’s rotational axis is pointing
millennial-scale variations in the orbital and rotational parameters of the Earth that have subtle effects on the Earth’s climate
a measure of the intensity of solar energy at a specific location or time (expressed in W/m2)
a periodic climatic situation in which warm water extends all or most of the way to the eastern edge of the equatorial Pacific
a process by which the physical effects of a climate forcing can have other effects (either negative or positive) on the climate
the reflectivity of a surface of a planet (expressed as the percentage of light that reflects)
