Chapter 9 Earth’s Interior
9.4 Isostasy
Theory holds that the mantle is able to convect because of its plasticity, and this plasticity also allows for another very important Earth process known as isostasy. The literal meaning of the word isostasy is “equal standstill,” but the importance behind it is the principle that Earth’s crust is floating on the mantle, like a raft floating in the water, rather than resting on the mantle like a raft sitting on the ground.
The relationship between the crust and the mantle is illustrated in Figure 9.4.1 On the right is an example of a non-isostatic relationship between a raft and solid concrete. It’s possible to load the raft up with lots of people, and it still won’t sink into the concrete. On the left, the relationship is an isostatic one between two different rafts and a swimming pool full of peanut butter. With only one person on board, the raft floats high in the peanut butter, but with three people, it sinks dangerously low. We’re using peanut butter here, rather than water, because its viscosity more closely represents the relationship between the crust and the mantle. Although it has about the same density as water, peanut butter is much more viscous (stiff), and so although the three-person raft will sink into the peanut butter, it will do so quite slowly.
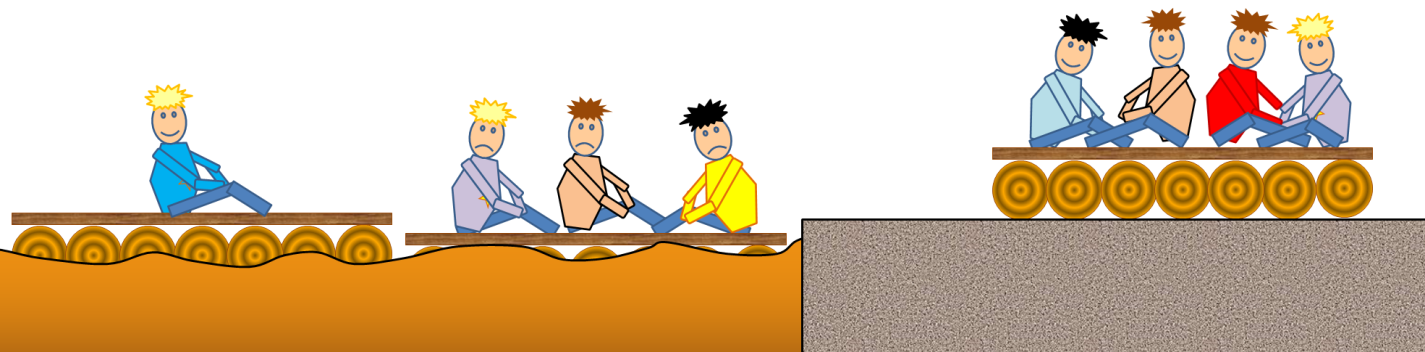
The relationship of Earth’s crust to the mantle is similar to the relationship of the rafts to the peanut butter. The raft with one person on it floats comfortably high. Even with three people on it the raft is less dense than the peanut butter, so it floats, but it floats uncomfortably low for those three people. The crust, with an average density of around 2.6 grams per cubic centimetre (g/cm3), is less dense than the mantle (average density of approximately 3.4 g/cm3 near the surface, but more than that at depth), and so it is floating on the “plastic” mantle. When more weight is added to the crust, through the process of mountain building, it slowly sinks deeper into the mantle and the mantle material that was there is pushed aside (Figure 9.4.2, left). When that weight is removed by erosion over tens of millions of years, the crust rebounds and the mantle rock flows back (Figure 9.4.2, right).

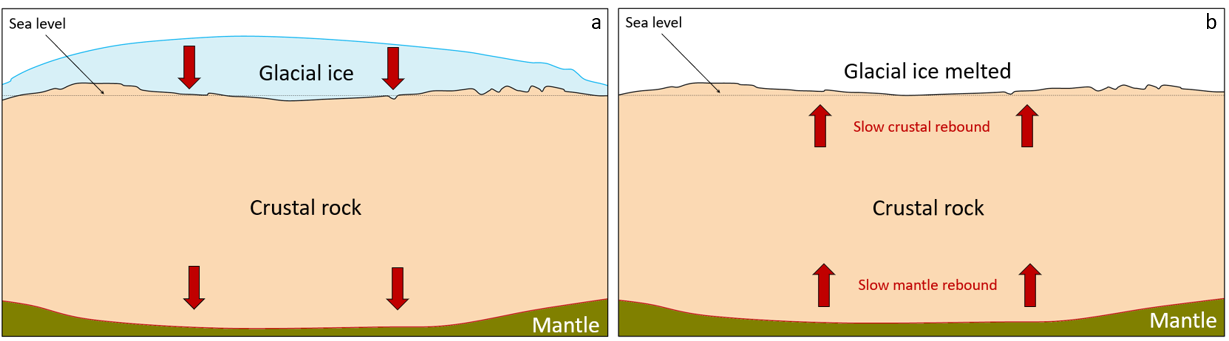
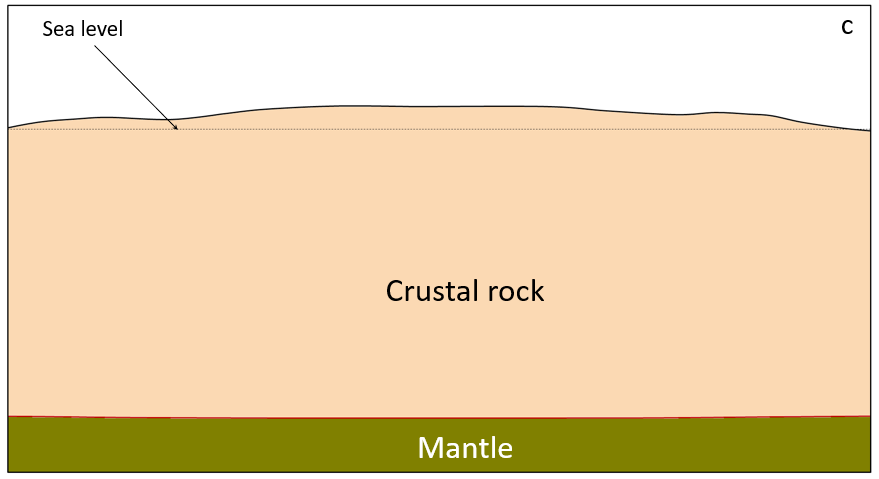
The crust and mantle respond in a similar way to glaciation and deglaciation as they do to the growth and erosion of mountain ranges. Thick accumulations of glacial ice add weight to the crust, and as the mantle beneath is squeezed to the sides, the crust subsides. This process is illustrated for the current ice sheet on Greenland in Figure 9.4.3 (a and b). The Greenland Ice Sheet at this location is over 2,500 metres thick, and the crust beneath the thickest part has been depressed to the point where it is below sea level over a wide area. When the ice eventually melts, the crust and mantle will slowly rebound, but full rebound will likely take more than 10,000 years (Figure 9.4.3c).
How can the mantle be both solid and plastic?
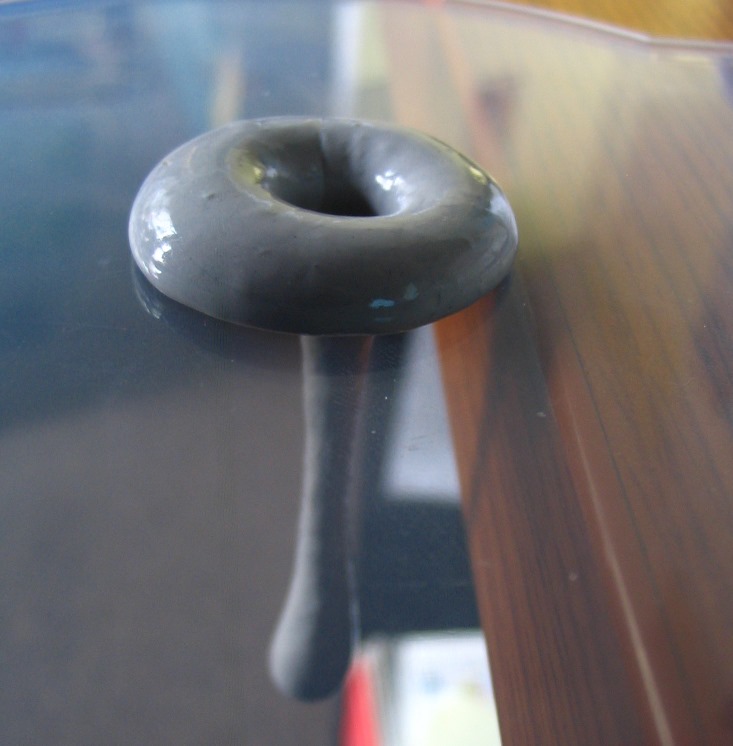
You might be wondering how it is possible that Earth’s mantle is rigid enough to break during an earthquake, and yet it convects and flows like a very viscous liquid. The explanation is that the mantle behaves as a non-Newtonian fluid, meaning that it responds differently to stresses depending on how quickly the stress is applied. A good example of this is the behaviour of the material known as Silly Putty, which can bounce and will break if you pull on it sharply, but will deform like a liquid if stress is applied slowly. In this photo, Silly Putty was placed over a hole in a glass tabletop, and in response to gravity, it slowly flowed into the hole. The mantle will flow when placed under the slow but steady stress of a growing (or melting) ice sheet.
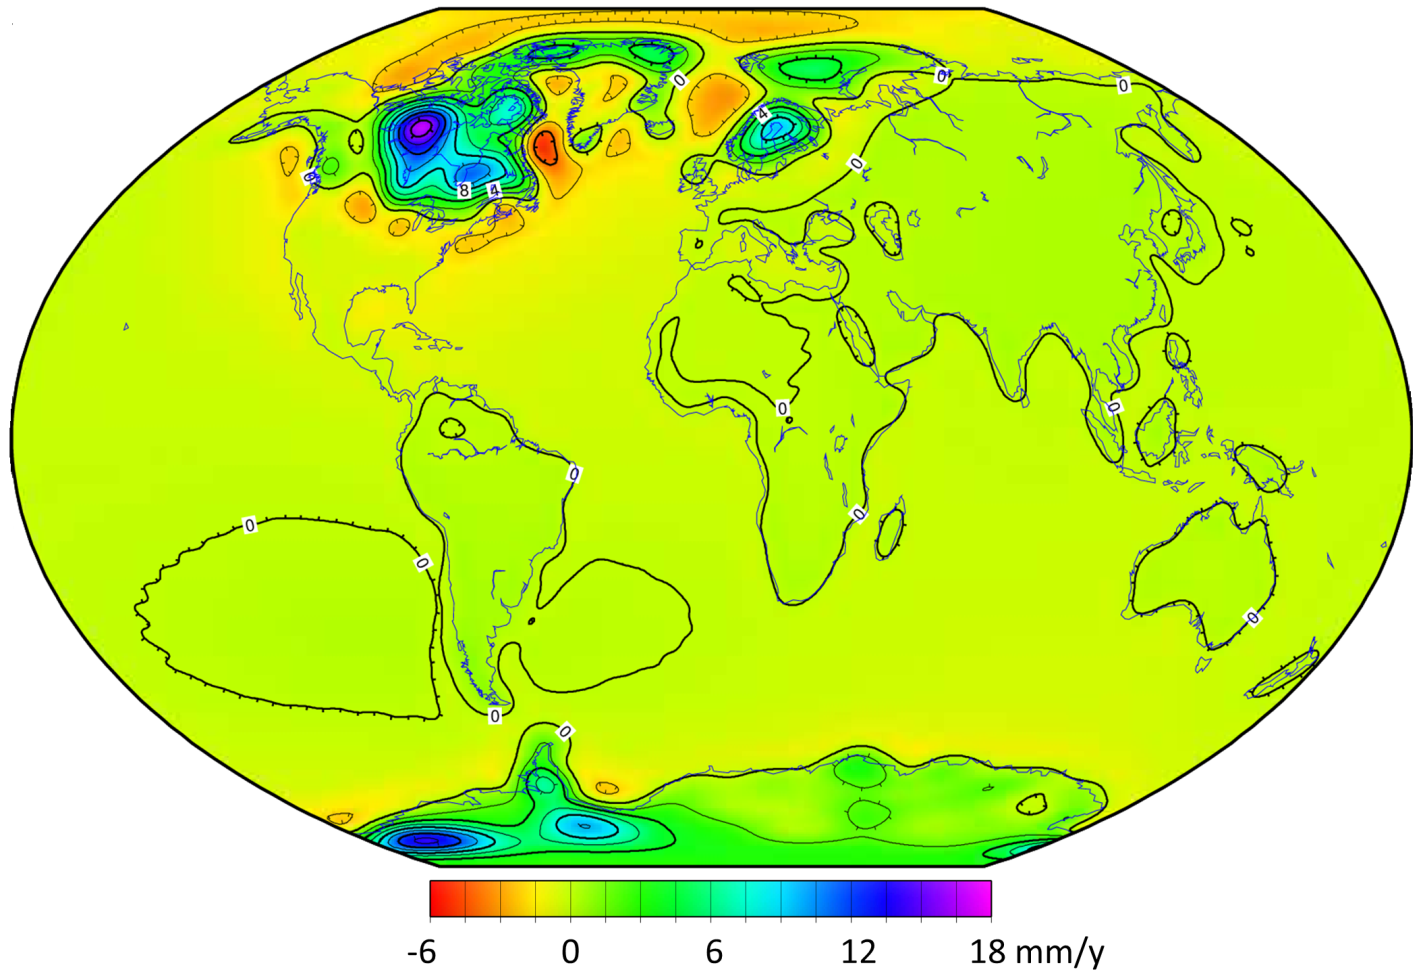
Large parts of Canada are still rebounding as a result of the loss of glacial ice over the past 12 ka, and as shown in Figure 9.4.5, other parts of the world are also experiencing isostatic rebound. The highest rate of uplift is in within a large area to the west of Hudson Bay, which is where the Laurentide Ice Sheet was the thickest (over 3,000 m). Ice finally left this region around 8,000 years ago, and the crust is currently rebounding at a rate of nearly 2 centimetres per year. Strong isostatic rebound is also occurring in northern Europe where the Fenno-Scandian Ice Sheet was thickest, and in the eastern part of Antarctica, which also experienced significant ice loss during the Holocene.
There are also extensive areas of subsidence surrounding the former Laurentide and Fenno-Scandian Ice Sheets. During glaciation, mantle rock flowed away from the areas beneath the main ice sheets, and this material is now slowly flowing back, as illustrated in Figure 9.4.3b.
Exercise 9.4 Rock density and isostasy
The densities (also known as “specific gravity”) of a number of common minerals are given in Table 9.1.
| Mineral | Density (grams per cubic centimetre, g/cm3) |
|---|---|
| Quartz | 2.65 |
| Feldspar | 2.63 |
| Amphibole | 3.25 |
| Pyroxene | 3.4 |
| Olivine | 3.3 |
The following table provides the approximate proportions of these minerals in the continental crust (typified by granite), oceanic crust (mostly basalt), and mantle (mainly the rock known as peridotite). Assuming that you have 1,000 cm3 of each rock type, estimate the respective rock-type densities. For each rock type, you will need to multiply the volume of the different minerals in the rock by their density, and then add those numbers to get the total weight for 1,000 cm3 of that rock. The density is that number divided by 1,000. The continental crust is done for you.
| Rock Type | Volumes of individual minerals in 1000 cm3. | Grams of individual minerals in 1000 cm3 | Total Weight (grams) | Density (grams per cubic centimetre, g/cm3) |
|---|---|---|---|---|
| Continental Crust (Granite) | Quartz – 180 cm3
Feldspar – 760 cm3 Amphibole – 70 cm3 |
Quartz – 477 g
Feldspar – 1999 g Amphibole – 277 g |
2703 g | 2.70 |
| Oceanic Crust (Basalt) | Feldspar – 450 cm3
Amphibole – 50 cm3 Pyroxene – 500 cm3 |
Feldspar –
Amphibole – Pyroxene – |
||
| Mantle (Peridotite) | Pyroxene – 450 cm3
Olivine – 550 cm3 |
Pyroxene –
Olivine – |
If continental crust (represented by granite) and oceanic crust (represented by basalt) are like rafts floating on the mantle, what does this tell you about how high or low they should float?
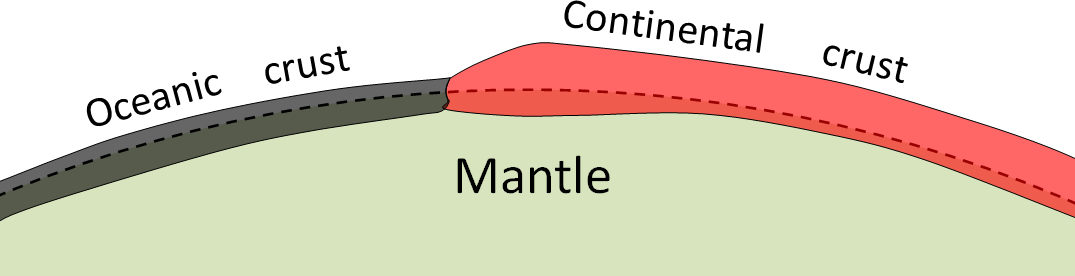
This concept is illustrated in Figure 9.4.6. The dashed line is for reference, showing points at equal distance from Earth’s centre.
See Appendix 3 for Exercise 9.4 answers.
Media Attributions
- Figures 9.4.1, 9.4.2, 9.4.3abc, 9.4.6: © Steven Earle. CC BY.
- Figure 9.4.4: “Silly putty dripping” © Eric Skiff. CC BY-SA.
- Figure 9.4.5: “PGR Paulson2007 Rate of Lithospheric Uplift due to PGR” by NASA. Public domain.
the equilibrium between a block of crust floating on the underlying plastic mantle
