Chapter 4 Volcanism
4.3 Types of Volcanoes
There are numerous types of volcanoes or volcanic sources; some of the more common ones are summarized in Table 4.1.
| [Skip Table] | ||||
| Type | Tectonic Setting | Size and Shape | Magma and Eruption Characteristics | Example |
|---|---|---|---|---|
| Cinder cone | Various; some form on the flanks of larger volcanoes | Small (10s to 100s of metres) and steep (Greater than 20°) | Most are mafic and form from the gas-rich early stages of a shield- or rift-associated eruption | Eve Cone, northern B.C. |
| Composite volcano | Almost all are at subduction zones | Medium size (1000s of metres high and up to 20 km across) and moderate steepness (10° to 30°) | Magma composition varies from felsic to mafic, and from explosive to effusive | Mount St. Helens |
| Shield volcano | Most are at mantle plumes; some are on spreading ridges | Large (up to several 1,000 metres high and up to 200 kilometres across), not steep (typically 2° to 10°) | Magma is almost always mafic, and eruptions are typically effusive, although cinder cones are common on the flanks of shield volcanoes | Kilauea, Hawaii |
| Large igneous provinces | Associated with “super” mantle plumes | Enormous (up to millions of square kiometres) and 100s of metres thick | Magma is always mafic and individual flows can be 10s of metres thick | Columbia River basalts |
| Sea-floor volcanism | Generally associated with spreading ridges but also with mantle plumes | Large areas of the sea floor associated with spreading ridges | Pillows form at typical eruption rates; lava flows develop if the rare of flow is faster | Juan de Fuca ridge |
| Kimberlite | Upper-mantle sourced | The remnants are typically 10s to 100s of metres across | Most appear to have had explosive eruptions forming cinder cones; the youngest one is dated at about 10 ka, and all others are at least 30 Ma | Lac de Gras Kimberlite Field, N.W.T. |
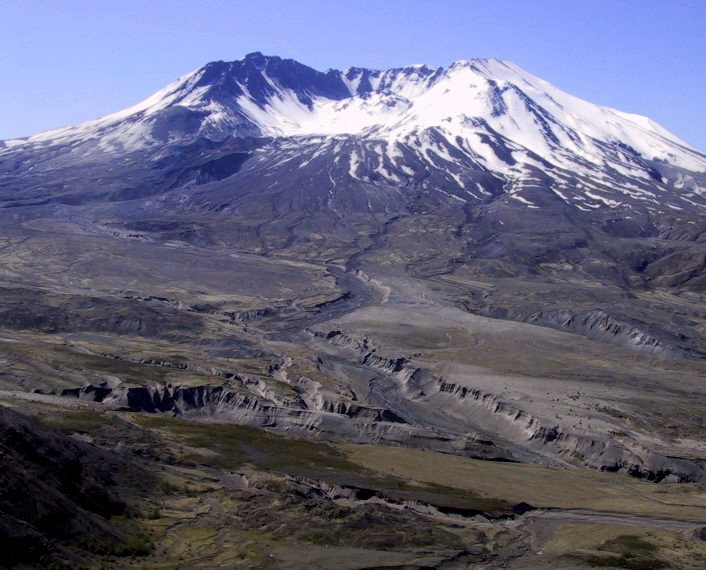
The sizes and shapes of typical shield, composite, and cinder-cone volcanoes are compared in Figure 4.3.1, although, to be fair, Mauna Loa is the largest shield volcano on Earth; all others are smaller. Mauna Loa rises from the surrounding flat sea floor, and its diameter is in the order of 200 km. Its elevation is 4,169 m above sea level. Mount St. Helens, a composite volcano of average size, rises above the surrounding hills of the Cascade Range. Its diameter is about 6 km, and its height is 2,550 m above sea level. Cinder cones are much smaller. On this drawing, even a large cinder cone is just a dot.
Cinder Cones
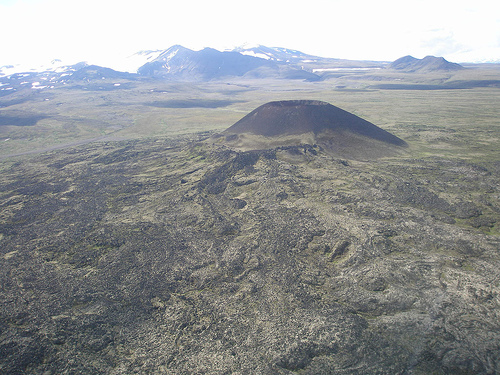
Cinder cones, like Eve Cone in northern B.C. (Figure 4.3.2), are typically only a few hundred metres in diameter, and few are more than 200 m high. Most are made up of fragments of vesicular mafic rock (scoria) that were expelled as the magma boiled when it approached the surface, creating fire fountains. In many cases, these later became the sites of effusive lava flows when the gases were depleted. Most cinder cones are monogenetic, meaning that they formed during a single eruptive phase that might have lasted weeks or months. Because cinder cones are made up almost exclusively of loose fragments, they have very little strength. They can be easily, and relatively quickly, eroded away.
Composite Volcanoes
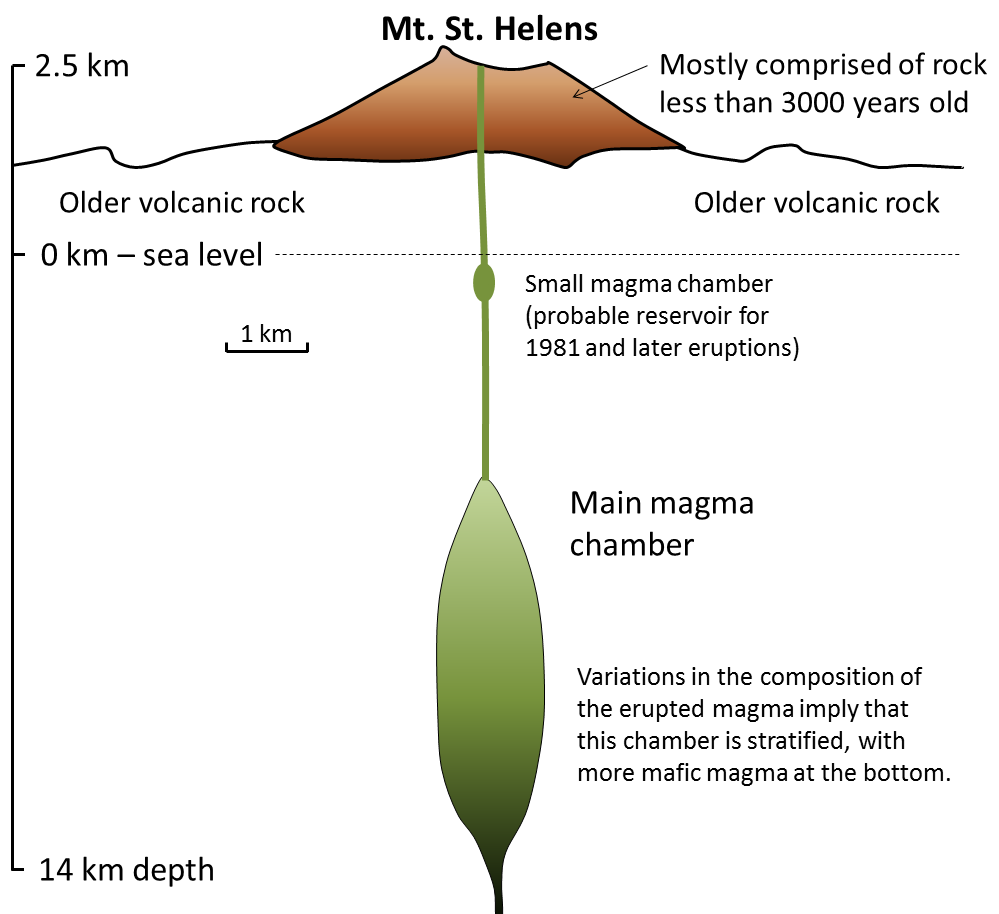
Composite volcanoes, like Mount St. Helens in Washington State (Figure 4.3.3), are almost all associated with subduction at convergent plate boundaries—either ocean-continent or ocean-ocean boundaries (Figure 4.1.2b). They can extend up to several thousand metres from the surrounding terrain, and, with slopes ranging up to 30˚ They can be up to about 20 km across. At many such volcanoes, magma is stored in a magma chamber in the upper part of the crust. For example, at Mount St. Helens, there is evidence of a magma chamber that is approximately 1 kilometre wide and extends from about 6 km to 14 km below the surface (Figure 4.3.4). Systematic variations in the composition of volcanism over the past several thousand years at Mount St. Helens imply that the magma chamber is zoned, from more felsic at the top to more mafic at the bottom.
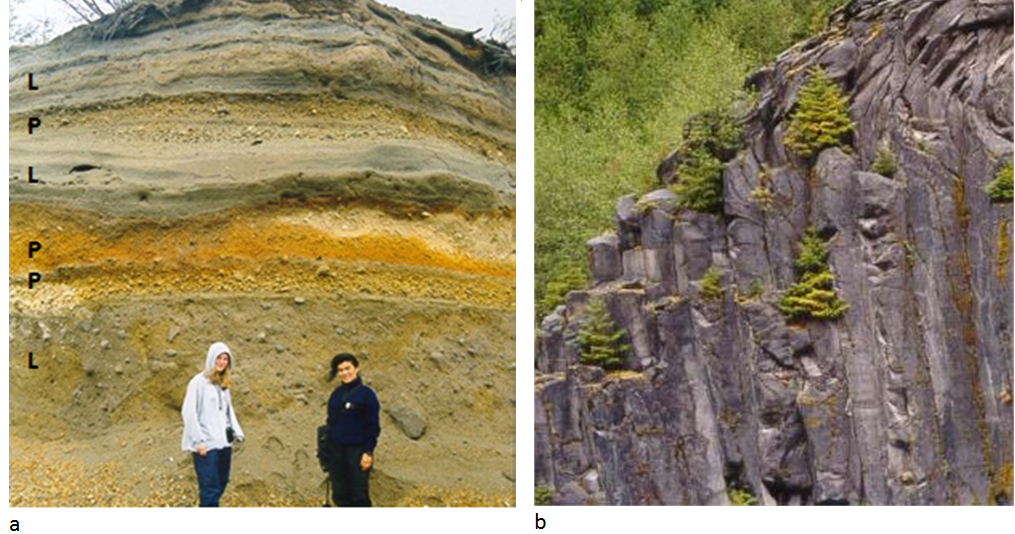
Mafic eruptions (and some intermediate eruptions), on the other hand, produce lava flows; the one shown in Figure 4.3.5b is thick enough (about 10 m in total) to have cooled in a columnar jointing pattern (Figure 4.3.7). Lava flows both flatten the profile of the volcano (because the lava typically flows farther than pyroclastic debris falls) and protect the fragmental deposits from erosion. Even so, composite volcanoes tend to erode quickly. Patrick Pringle, a volcanologist with the Washington State Department of Natural Resources, describes Mount St. Helens as a “pile of junk.” The rock that makes up Mount St. Helens ranges in composition from rhyolite (Figure 4.3.5a) to basalt (Figure 4.3.5b); this implies that the types of past eruptions have varied widely in character. As already noted, felsic magma doesn’t flow easily and doesn’t allow gases to escape easily. Under these circumstances, pressure builds up until a conduit opens, and then an explosive eruption results from the gas-rich upper part of the magma chamber, producing pyroclastic debris, as shown on Figure 4.3.5a. This type of eruption can also lead to rapid melting of ice and snow on a volcano, which typically triggers large mudflows known as lahars (Figure 4.3.5a). Hot, fast-moving pyroclastic flows and lahars are the two main causes of casualties in volcanic eruptions. Pyroclastic flows killed approximately 30,000 people during the 1902 eruption of Mount. Pelée on the Caribbean island of Martinique. Most were incinerated in their homes. In 1985 a massive lahar, triggered by the eruption of Nevado del Ruiz, killed 23,000 people in the Colombian town of Armero, about 50 km from the volcano.
In a geological context, composite volcanoes tend to form relatively quickly and do not last very long. Mount St. Helens, for example, is made up of rock that is all younger than 40,000 years; most of it is younger than 3,000 years. If its volcanic activity ceases, it might erode away within a few tens of thousands of years. This is largely because of the presence of pyroclastic eruptive material, which is not strong.
Exercise 4.3 Volcanoes and Subduction
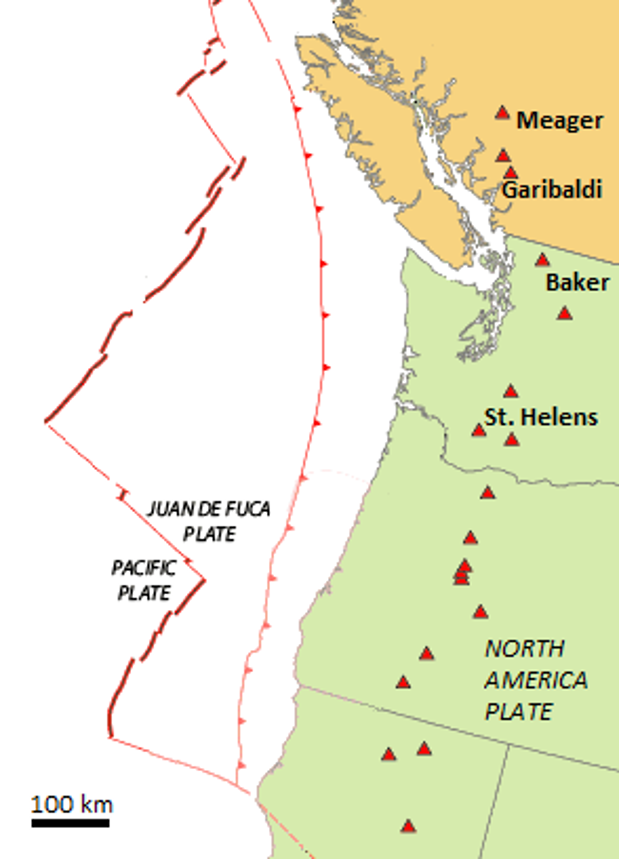
The map shown here illustrates the interactions between the North America, Juan de Fuca, and Pacific Plates off the west coast of Canada and the United States. The Juan de Fuca Plate is forming along the Juan de Fuca ridge, and is then subducted beneath the North America Plate along the red line with teeth on it (“Subduction boundary”).
- Using the scale bar in the lower left of the map, estimate the average distance between the subduction boundary and the Cascadia composite volcanoes.
- If the subducting Juan de Fuca Plate descends 40 km for every 100 km that it moves inland, what is its likely depth in the area where volcanoes are forming?
See Appendix 3 for Exercise 4.3 answers.
Shield Volcanoes
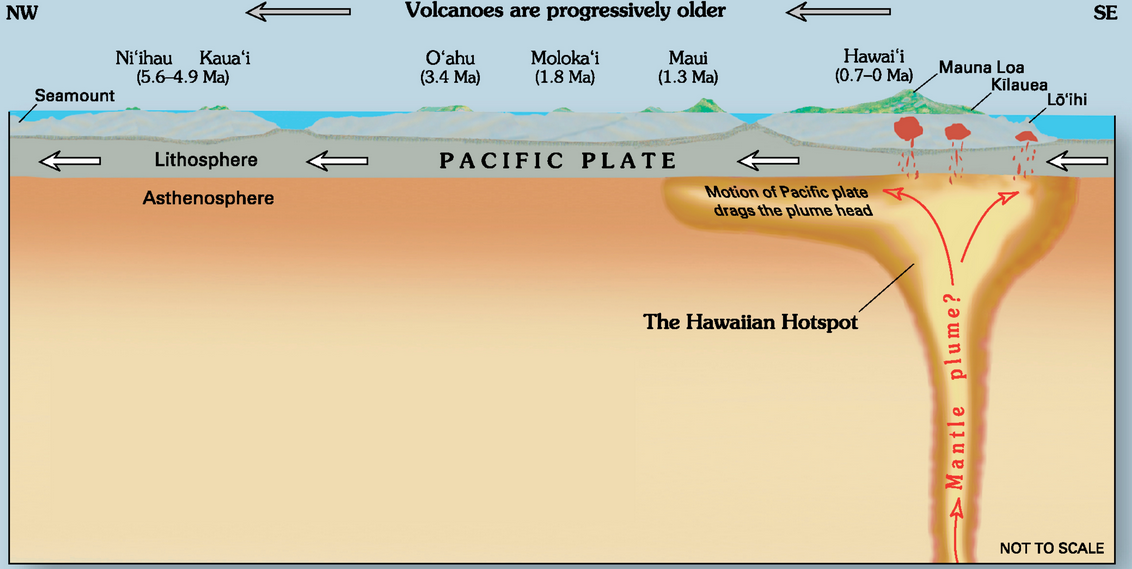
Most shield volcanoes are associated with mantle plumes, although some form at divergent boundaries, either on land or on the sea floor. Because of their non-viscous mafic magma they tend to have relatively gentle slopes (2 to 10˚) and the larger ones can be over 100 km in diameter. The best-known shield volcanoes are those that make up the Hawaiian Islands, and of these, the only active ones are on the big island of Hawaii. Mauna Loa, the world’s largest volcano and the world’s largest mountain (by volume) last erupted in 1984. Kilauea, arguably the world’s most active volcano, has been erupting, virtually without interruption, since 1983. Loihi is an underwater volcano on the southeastern side of Hawaii. It is last known to have erupted in 1996, but may have erupted since then without being detected.
All of the Hawaiian volcanoes are related to the mantle plume that currently lies beneath Mauna Loa, Kilauea, and Loihi (Figure 4.3.8). In this area, the Pacific Plate is moving northwest at a rate of about 7 centimetres (cm) per year. This means that the earlier formed — and now extinct — volcanoes have now moved well away from the mantle plume. As shown on Figure 4.3.8, there is evidence of crustal magma chambers beneath all three active Hawaiian volcanoes. At Kilauea, the magma chamber appears to be several kilometres in diameter, and is situated between 8 km and 11 km below surface.[1]
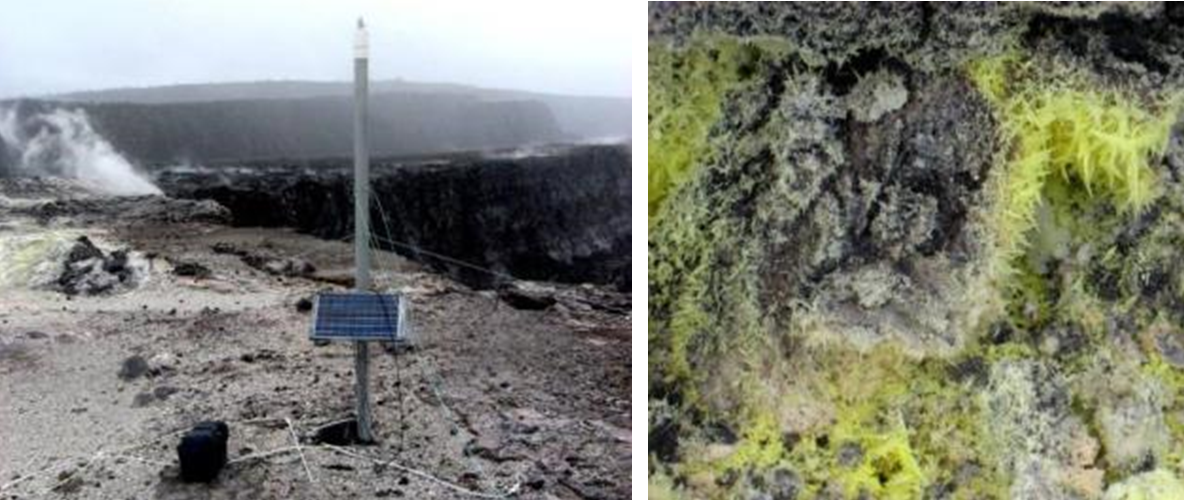
Although it is not a prominent mountain (Figure 4.3.2), Kilauea volcano has a large caldera in its summit area (Figure 4.3.9). A caldera is a volcanic crater that is more than 2 km in diameter; this one is 4 km long and 3 km wide. It contains a smaller feature called Halema’uma’u crater, which has a total depth of over 200 m below the surrounding area. Most volcanic craters and calderas are formed above magma chambers, and the level of the crater floor is influenced by the amount of pressure exerted by the magma body. During historical times, the floors of both Kilauea caldera and Halema’uma’u crater have moved up during expansion of the magma chamber and down during deflation of the chamber.
One of the conspicuous features of Kilauea caldera is rising water vapour (the white cloud in Figure 4.3.9) and a strong smell of sulphur (Figure 4.3.10). As is typical in magmatic regions, water is the main volatile component, followed by carbon dioxide and sulphur dioxide. These, and some minor gases, originate from the magma chamber at depth and rise up through cracks in the overlying rock. This degassing of the magma is critical to the style of eruption at Kilauea, which, for most of the past 35 years, has been effusive, not explosive.
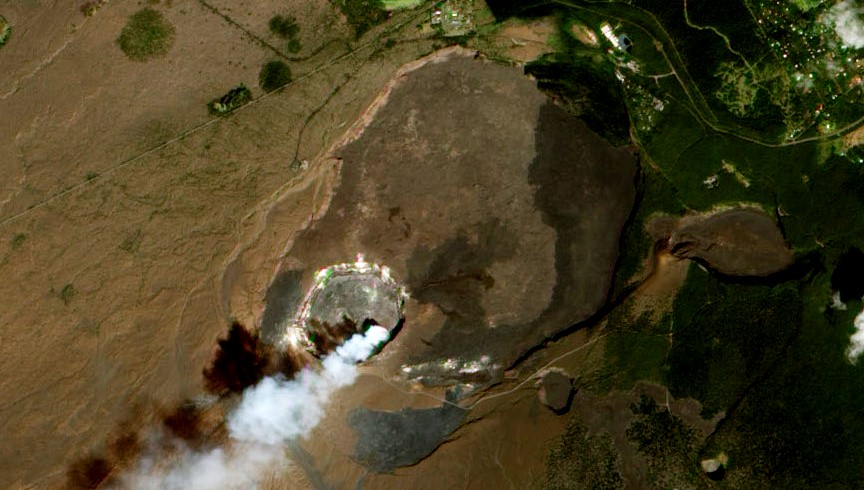
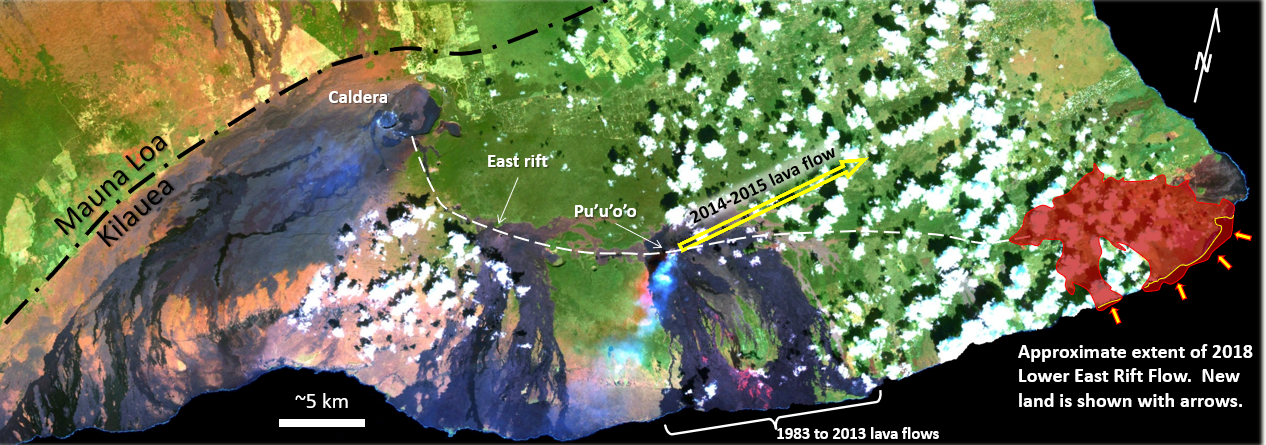
The Kilauea eruption that began in 1983 started with the formation of a cinder cone at Pu’u ’O’o, approximately 15 km east of the caldera (Figure 4.3.11). The magma feeding this eruption flowed along a major conduit system known as the East Rift, which extends for about 20 km from the caldera, first southeast and then east. Lava fountaining and construction of the Pu’u ’O’o cinder cone (Figure 4.3.12a) continued until 1986 at which time the flow became effusive. From 1986 to 2014, lava flowed from a gap in the southern flank of Pu’u ’O’o down the slope of Kilauea through a lava tube (Figure 4.3.12d), emerging at or near the ocean. During 2014 and 2015, the lava flowed northeast toward the community of Pahoa (see Exercise 4.4). In May of 2018 a new eruption started another 15 km east of the 2014/15 flow in the area known as Leilani Estates. The Lower East Rift Flow was active for 6 months. During that time, 35 km2 of existing land was covered in lava and 3.5 km2 of new land was created (Figure 4.3.11), about 48 km of road were covered in lava and 716 dwellings were destroyed (see USGS Overview of Kilauea Volcanoe’s 2018 eruption [PDF]). Volcanic activity on the East Rift ceased in August 2018, and there has been no activity on Kilauea since then. This appears to mark the end of the eruption cycle that lasted—with only a few short interruptions—for 35 years. Kilauea will almost certainly erupt again within years or decades.
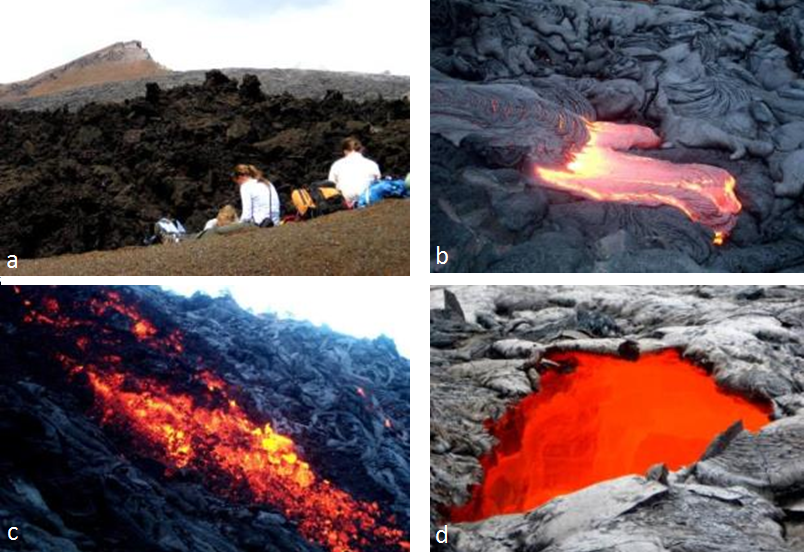
The two main types of textures created during effusive subaerial eruptions are pahoehoe and aa. Pahoehoe, ropy lava that forms as non-viscous lava, flows gently, forming a skin that gels and then wrinkles because of ongoing flow of the lava below the surface (Figure 4.3.12b, and “lava flow video”). Aa, or blocky lava, forms when magma is forced to flow faster than it is able to (down a slope for example) (Figure 4.3.12c). Tephra (lava fragments) is produced during explosive eruptions, and accumulates in the vicinity of cinder cones.
Figure 4.3.12d is a view into an active lava tube on the southern edge of Kilauea. The red glow is from a stream of very hot lava (~1200°C) that has flowed underground for most of the 8 km from the Pu’u ’O’o vent. Lava tubes form naturally and readily on both shield and composite volcanoes because flowing mafic lava preferentially cools near its margins, forming solid lava levées that eventually close over the top of the flow. The magma within a lava tube is not exposed to the air, so it remains hot and fluid and can flow for tens of km, thus contributing to the large size and low slopes of shield volcanoes. The Hawaiian volcanoes are riddled with thousands of old lava tubes, some as long as 50 km.
Kilauea started forming at approximately 300 ka, while neighbouring Mauna Loa dates back to 700 ka and nearby Mauna Kea ito around 1 Ma. If volcanism continues above the Hawaii mantle plume in the same manner that it has since 85 Ma, it is likely that Kilauea will continue to erupt for at least another 500,000 years. By that time, its neighbour, Loihi, will have emerged from the sea floor, and its other neighbours, Mauna Loa and Mauna Kea, will have become significantly eroded, like their cousins, the islands to the northwest (Figure 4.3.8).
Exercise 4.4 Kilauea’s 2014 lava flow
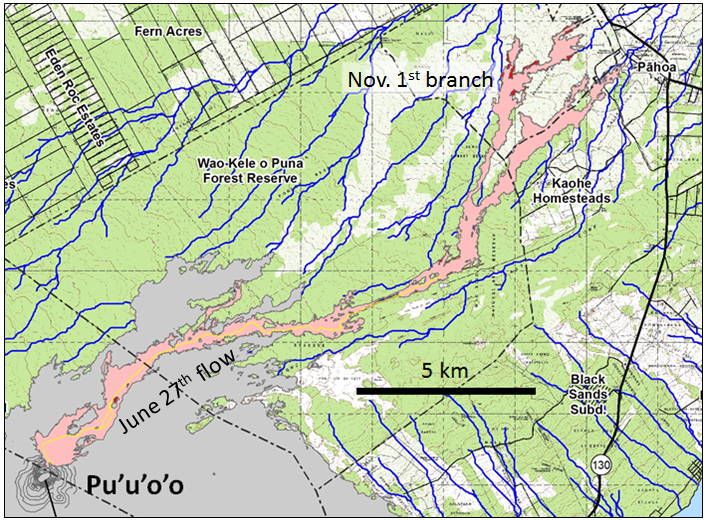
The U.S. Geological Survey Hawaii Volcano Observatory (HVO) map shown here, dated January 29, 2015, shows the outline of lava that started flowing northeast from Pu’u ’O’o on June 27, 2014 (the “June 27th Lava flow,” a.k.a. the “East Rift Lava Flow”). The flow reached the nearest settlement, Pahoa, on October 29, 124 days later. After damaging some infrastructure west of Pahoa, the flow stopped advancing. A new outbreak occurred November 1, branching out to the north from the main flow.
What is the average rate of advance of the flow front from June 27 to October 29, 2014, in metres per day and metres per hour?
See Appendix 3 for Exercise 4.4 Answers.
Large Igneous Provinces
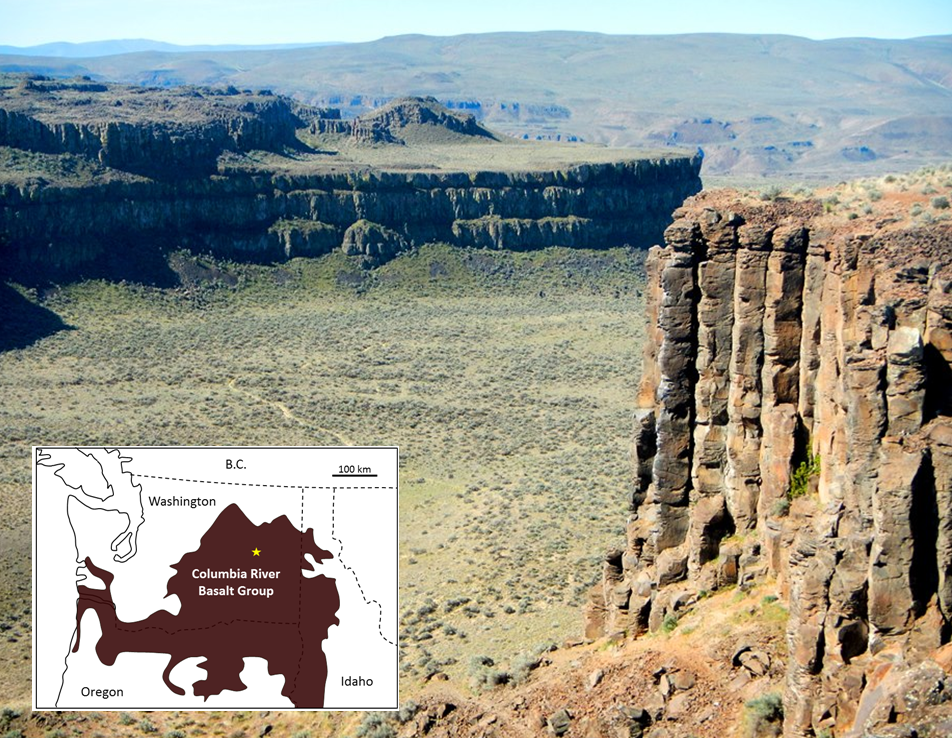
While the Hawaii mantle plume has produced a relatively low volume of magma for a very long time (~85 Ma), other mantle plumes are less consistent, and some generate massive volumes of magma over relatively short time periods. Although their origin is still controversial, it is thought that the volcanism leading to large igneous provinces (LIP) is related to very high volume but relatively short duration bursts of magma from mantle plumes. An example of an LIP is the Columbia River Basalt Group (CRGB), which extends across Washington, Oregon, and Idaho (Figure 4.3.14). This volcanism, which covered an area of about 160,000 square kilometres (km2) with basaltic rock up to several hundred metres thick, took place between 17 and 14 Ma.
Most other LIP eruptions are much bigger. The Siberian Traps (also basalt), which erupted at the end of the Permian period at 250 Ma, are estimated to have produced approximately 40 times as much lava as the CRBG.
The mantle plume that is assumed to be responsible for the CRBG is now situated beneath the Yellowstone area, where it leads to felsic volcanism. Over the past 2 Ma three very large explosive eruptions at Yellowstone have yielded approximately 900 cubic kilometres (km3) of felsic magma, about 900 times the volume of the 1980 eruption of Mount St. Helens, but only 5% of the volume of mafic magma in the CRBG.
Sea-Floor Volcanism
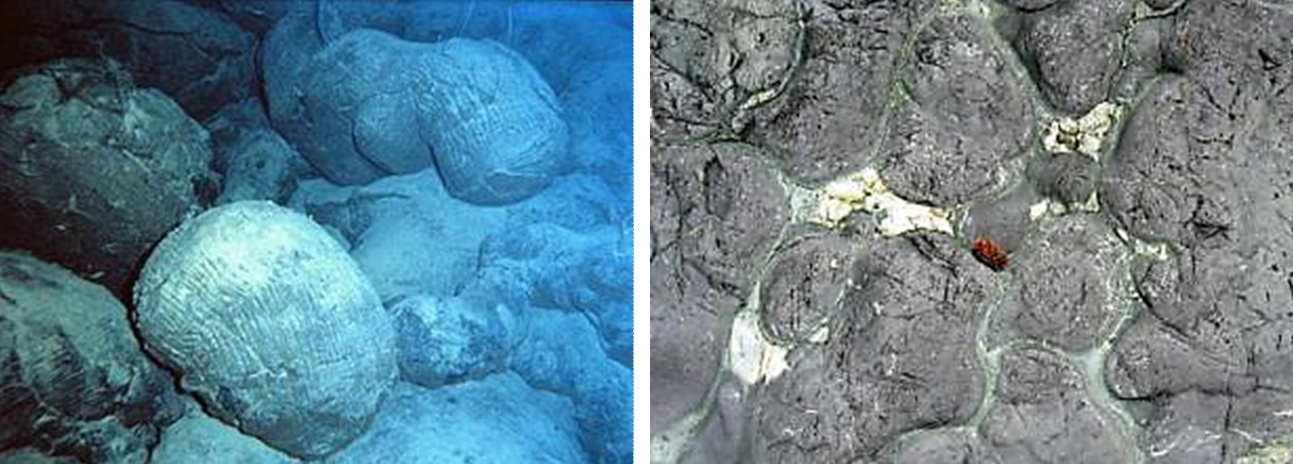
Some LIP eruptions occur on the sea floor, the largest known being the one that created the Ontong Java plateau in the western Pacific Ocean at around 122 Ma. But most sea-floor volcanism originates at divergent boundaries and involves relatively low-volume eruptions. Under these conditions, hot lava that oozes out into the cold seawater quickly cools on the outside and then behaves a little like toothpaste. The resulting blobs of lava are known as pillows, and they tend to form piles around a sea-floor lava vent (Figure 4.3.15). In terms of area, there is very likely more pillow basalt on the sea floor than any other type of rock on Earth.
Kimberlites
While all of the volcanism discussed so far is thought to originate from partial melting in the upper mantle or within the crust, there is a special class of volcanoes called kimberlites that have their origins much deeper in the mantle, at depths of 150 km to 450 km. During a kimberlite eruption, material from this depth may make its way to surface quickly (hours to days) with little interaction with the surrounding rocks. As a result, kimberlite eruptive material is representative of mantle compositions: it is ultramafic.
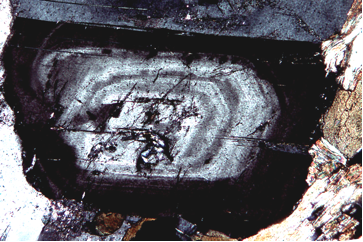
Kimberlite eruptions that originate at depths greater than 200 km, within areas beneath old thick crust (shields), traverse the region of stability of diamond in the mantle, and in some cases, bring diamond-bearing material to the surface. All of the diamond deposits on Earth are assumed to have formed in this way; an example is the rich Ekati Mine in the Northwest Territories (Figure 4.3.16).
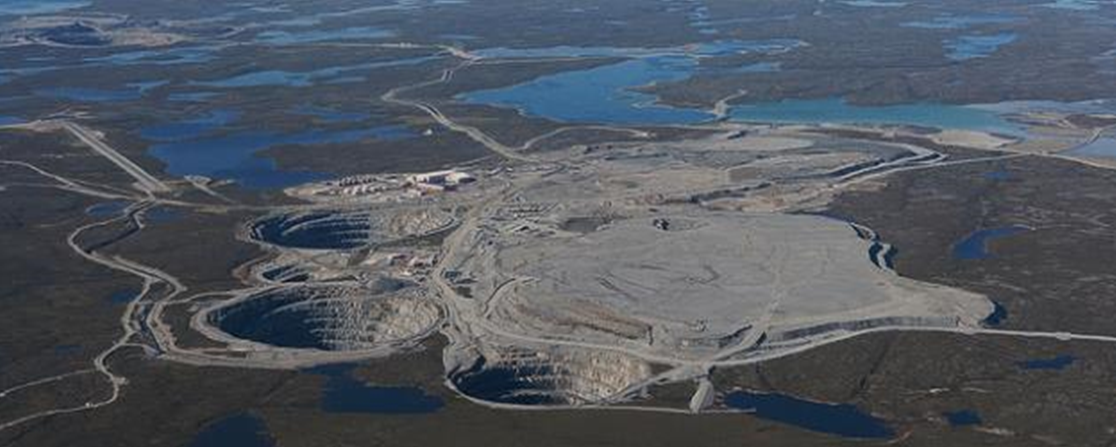
The kimberlites at Ekati erupted between 45 and 60 Ma. Many kimberlites are older, some much older. There have been no kimberlite eruptions in historic times. The youngest known kimberlites are in the Igwisi Hills in Tanzania and are only about 10,000 years old. The next youngest known are dated to about 30 Ma.
How frequently do volcanoes erupt?
The Smithsonian Institution maintains a comprehensive catalogue of the world’s volcanoes, with information and eruptive history for nearly 2700 volcanic sites. If you spend some time looking around that site you’ll discover the frequency of eruptions at different volcanoes is enormously variable, although we can make some generalizations. Focusing just on shield volcanoes and composite volcanoes some of the data are as follows:
| Composite volcanoes | Shield volcanoes |
|---|---|
| Avachinsky (Russia): 5 eruptions over the past 7000 years | Fernandina (Galapagos): 31 eruptions over the past 1000 years |
| Pinatubo (Philippines): 4 eruptions over the past 9000 years | Kilauea (Hawaii): 62 eruptions over the past 250 years |
| Adams (Oregon, USA): 6 eruptions over the past 7000 years | Nyamuragira (Congo): 48 eruptions over the past 154 years |
Based only on these numbers it is evident that, in general, shield volcanoes are much more active than composite volcanoes, but there are many exceptions to this trend. Some composite volcanoes are nearly as active as the shield volcanoes listed here, and some shield volcanoes that are still considered to be “active” are almost as inactive as the composite volcanoes listed here.
Image Descriptions
Figure 4.3.4 image description: Mount St. Helens rises over 2.5 kilometres above sea lever and consists mostly of rock less than 3,000 years old. Underneath the mountain is older volcanic rock. Just below sea level is a small magma chamber, which is a probable reservoir for 1981 and later eruptions. Down 5 to 14 kilometres below sea level is the main magma chamber. Variations in the composition of the erupted magma imply this chamber is stratified, with more magma at the bottom. [Return to Figure 4.3.4]
Figure 4.3.5 image description: Image (A) shows a cliff wall with grey/brown and orange horizontal layers. The sides look soft like they would be easily worn away. The grey/brown layers are lahar deposits and the orange layers are felsic pyroclastic deposits. Image (B) shows a columnar basalt lava flow which looks like a rocky, stone cliff with vertical layers. [Return to Figure 4.3.5]
Figure 4.3.13 image description: The U.S. Geological Survey Hawaii Volcano Observatory (HVO) map, dated January 29, 2015, shows the outline of lava that started flowing northeast from Pu’u ’O’o on June 27, 2004 (the “June 27th Lava flow,” a.k.a. the “East Rift Lava Flow”). The flow reached the nearest settlement, Pahoa, on October 29, after covering a distance of 20 km in 124 days. After damaging some infrastructure west of Pahoa, the flow stopped advancing. A new outbreak occurred November 1, branching out to the north from the main flow about 6 km southwest of Pahoa. [Return to Figure 4.3.13]
Figure 4.3.14 image description: The Columbia River Basalt Group covers most of south eastern Washington state and stretches along the borders between Washington, Idaho, and Oregon. The columnar basalts shown in the photo are in in eastern Washington. They rise up out of a flat valley as tall cliffs. [Return to Figure 4.3.14]
Media Attributions
- Figure 4.3.1: © Steven Earle. CC BY.
- Figure 4.3.2: Eve Cone © nass5518. CC BY.
- Figure 4.3.3: © Steven Earle. CC BY.
- Figure 4.3.4: Original image © Pringle, 1993. Modified by Steve Earle.
- Figure 4.3.5: © Steven Earle. CC BY.
- Figure 4.3.6: © Steven Earle. CC BY.
- Figure 4.3.7: © Steven Earle. CC BY.
- Figure 4.3.8: “Hawaii hotspot cross-sectional diagram” by USGS. Public domain.
- Figure 4.3.9: “Kilauea ali 2012 01 28” by NASA. Public domain.
- Figure 4.3.10: © Steven Earle. CC BY.
- Figure 4.3.11: Island of Hawai’i – Landsat mosaic by NOAA. Public domain. Modified by Steven Earle.
- Figure 4.3.12: © Steven Earle. CC BY.
- Figure 4.3.13: Image from USGS. Public domain.
- Figure 4.3.14: © Steven Earle. CC BY.
- Figure 4.3.15 (Left): Pillow Basalt Crop by NOAA. Public domain.
- Figure 4.3.15 (Right): © Steven Earle. CC BY.
- Figure 4.3.16: “Ekati mine” © Jason Pineau. CC BY-SA.
- Lin, G, Amelung, F, Lavallee, Y, and Okubo, P, 2014, Seismic evidence for a crustal magma reservoir beneath the upper east rift zone of Kilauea volcano, Hawaii. Geology. V. ↵
a steep-sided volcano comprised almost entirely of loose rock fragments and typically formed during a single eruptive event
an igneous texture characterized by holes left by gas bubbles
a volcano that forms in a single eruptive event
a volcano that is constructed of alternating layers of pyroclastic debris and lava flows
the fracturing of rock or sediment (but typically volcanic rock) into columns that are typically six-sided
volcanic material formed during an explosive eruption
a mudflow or debris flow that is either caused by a volcanic eruption, or forms on the flank of a volcano as a result of flooding not related to an eruption
a low-profile volcano formed primarily from eruptions of low-viscosity mafic magma
a volcanic depression that is many times larger than the volcanic vents within it
a volcanic depression that is related to a specific volcanic vent
a tube that forms as mafic lava flows along a channel and lava leveés build up on either side, eventually forming a roof (once a lava tube forms it insulates the flowing magma, allowing it to stay hot a liquid for longer and therefore flow much further)
a lava flow with a ropy surface texture formed when the surface cools and hardens while the lava beneath is still flowing
a lava flow that solidifies with a blocky high-relief surface
fragments of volcanic rock (including volcanic ash) ejected during an explosive eruption
a ridge that forms along the edge of a lava flow because the magma at the edge cools faster than that in the middle
a very large area of mafic volcanic rock produced by a massive eruption typically related to a mantle plume
a pillow-shaped mass of volcanic rock (typically basalt) formed when magma erupts beneath the surface
an ultramafic volcanic rock that originates at significant depth (> 200 metres) in the mantle (some kimberlites include diamonds)
a region of ancient (typically Precambrian) crystalline rock (equivalent to a craton)
