Chapter 3 Intrusive Igneous Rocks
3.2 Magma and Magma Formation
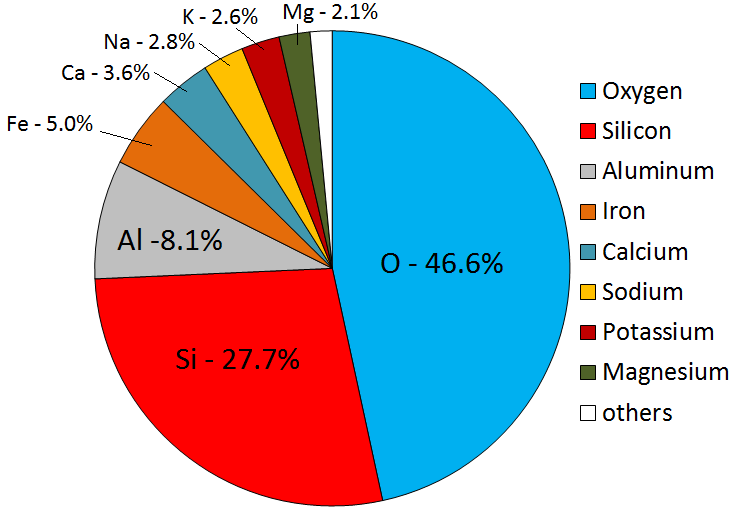
Magmas can vary widely in composition, but in general they are made up of only eight elements; in order of importance: oxygen, silicon, aluminum, iron, calcium, sodium, magnesium, and potassium (Figure 3.2.1). Oxygen, the most abundant element in magma, comprises a little less than half the total, followed by silicon at just over one-quarter. The remaining elements make up the other one-quarter. Magmas derived from crustal material are dominated by oxygen, silicon, aluminum, sodium, and potassium.
The composition of magma depends on the rock it was formed from (by melting), and the conditions of that melting. Magmas derived from the mantle have higher levels of iron, magnesium, and calcium, but they are still likely to be dominated by oxygen and silicon. All magmas have varying proportions of elements such as hydrogen, carbon, and sulphur, which are converted into gases like water vapour, carbon dioxide, and hydrogen sulphide as the magma cools.
Virtually all of the igneous rocks that we see on Earth are derived from magmas that formed from partial melting of existing rock, either in the upper mantle or the crust. Partial melting is what happens when only some parts of a rock melt; it takes place because rocks are not pure materials. Most rocks are made up of several minerals, each of which has a different melting temperature. The wax in a candle is a pure material. If you put some wax into a warm oven (50°C will do as the melting temperature of most wax is about 40°C) and leave it there for a while, it will soon start to melt. That’s complete melting, not partial melting. If instead you took a mixture of wax, plastic, aluminum, and glass and put it into the same warm oven, the wax would soon start to melt, but the plastic, aluminum, and glass would not melt (Figure 3.2.2a). That’s partial melting and the result would be solid plastic, aluminum, and glass surrounded by liquid wax (Figure 3.2.2b). If we heat the oven up to around 120°C, the plastic would melt too and mix with the liquid wax, but the aluminum and glass would remain solid (Figure 3.2.2c). Again this is partial melting. If we separated the wax/plastic “magma” from the other components and let it cool, it would eventually harden. As you can see from Figure 3.2.2d, the liquid wax and plastic have mixed, and on cooling, have formed what looks like a single solid substance. It is most likely that this is a very fine-grained mixture of solid wax and solid plastic, but it could also be some other substance that has formed from the combination of the two.
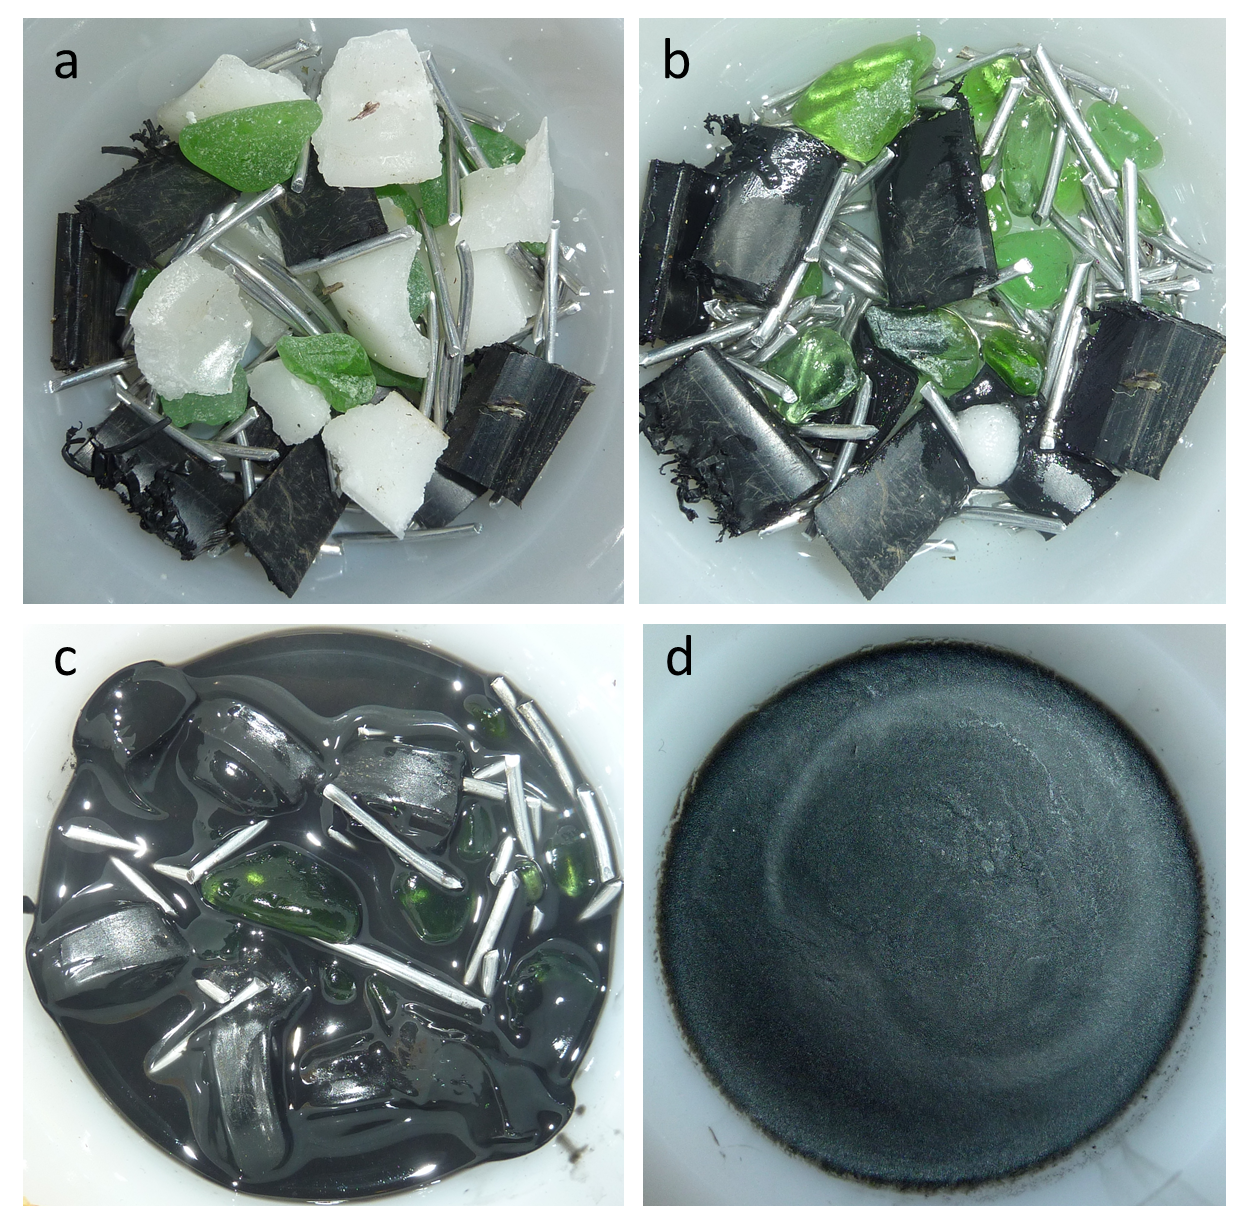
In this example, we partially melted some pretend rock to create some pretend magma. We then separated the magma from the source and allowed it to cool to make a new pretend rock with a composition quite different from the original material (it lacks glass and aluminum).
Of course partial melting in the real world isn’t exactly the same as in our pretend-rock example. The main differences are that rocks are much more complex than the four-component system we used, and the mineral components of most rocks have more similar melting temperatures, so two or more minerals are likely to melt at the same time to varying degrees. Another important difference is that when rocks melt, the process takes thousands to millions of years, not the 90 minutes it took in the pretend-rock example.
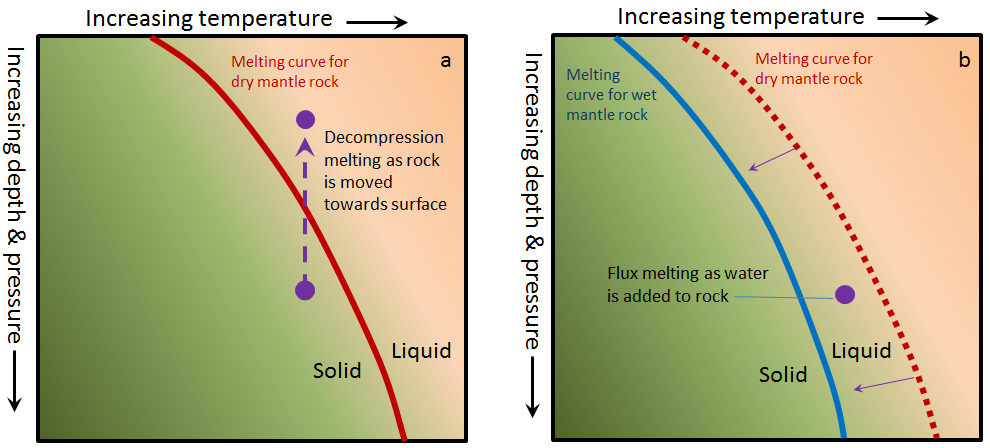
Contrary to what one might expect, and contrary to what we did to make our pretend rock, most partial melting of real rock does not involve heating the rock up. The two main mechanisms through which rocks melt are decompression melting and flux melting. Decompression melting takes place within Earth when a body of rock is held at approximately the same temperature but the pressure is reduced. This happens because the rock is being moved toward the surface, either at a mantle plume (a.k.a., hot spot), or in the upwelling part of a mantle convection cell.[1] The mechanism of decompression melting is shown in Figure 3.2.3a. If a rock that is hot enough to be close to its melting point is moved toward the surface, the pressure is reduced, and the rock can pass to the liquid side of its melting curve. At this point, partial melting starts to take place. The process of flux melting is shown in Figure 3.2.3b. If a rock is close to its melting point and some water (a flux that promotes melting) is added to the rock, the melting temperature is reduced (solid line versus dotted line), and partial melting starts.
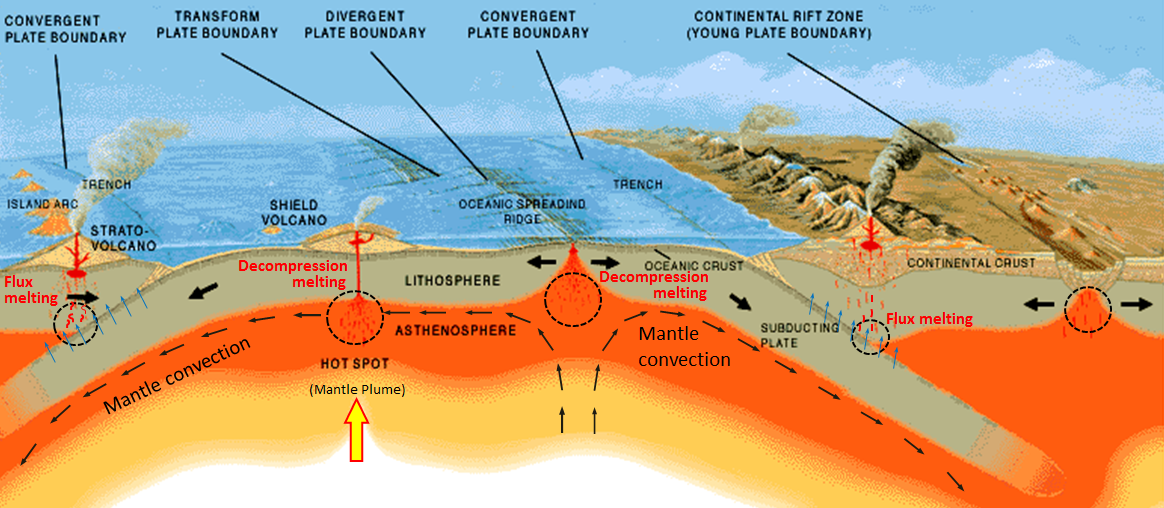
The partial melting of rock happens in a wide range of situations, most of which are related to plate tectonics. The more important of these are shown in Figure 3.2.3. At both mantle plumes and in the upward parts of convection systems, rock is being moved toward the surface, the pressure is dropping, and at some point, the rock crosses to the liquid side of its melting curve. At subduction zones, water from the wet, subducting oceanic crust is transferred into the overlying hot mantle. This provides the flux needed to lower the melting temperature. In both of these cases, only partial melting takes place—typically only about 10% of the rock melts—and it is always the most silica-rich components of the rock that melt, creating a magma that is more silica-rich than the rock from which it is derived. (By analogy, the melt from our pretend rock is richer in wax and plastic than the “rock” from which it was derived.) The magma produced, being less dense than the surrounding rock, moves up through the mantle, and eventually into the crust.
As it moves toward the surface, and especially when it moves from the mantle into the lower crust, the hot magma interacts with the surrounding rock. This typically leads to partial melting of the surrounding rock because most such magmas are hotter than the melting temperature of crustal rock. (In this case, melting is caused by an increase in temperature.) Again, the more silica-rich parts of the surrounding rock are preferentially melted, and this contributes to an increase in the silica content of the magma.
At very high temperatures (over 1300°C), most magma is entirely liquid because there is too much energy for the atoms to bond together. As the temperature drops, usually because the magma is slowly moving upward, things start to change. Silicon and oxygen combine to form silica tetrahedra, and then, as cooling continues, the tetrahedra start to link together to make chains (polymerize). These silica chains have the important effect of making the magma more viscous (less runny), and as we’ll see in Chapter 4, magma viscosity has significant implications for volcanic eruptions. As the magma continues to cool, crystals start to form.
Exercise 3.2 Making magma viscous
This is an experiment that you can do at home to help you understand the properties of magma. It will only take about 15 minutes, and all you need is half a cup of water and a few tablespoons of flour.
If you’ve ever made gravy, white sauce, or roux, you’ll know how this works.
Place about 1/2 cup (125 mL) of water in a saucepan over medium heat. Add 2 teaspoons (10 mL) of white flour (this represents silica) and stir while the mixture comes close to boiling. It should thicken like gravy because the gluten in the flour becomes polymerized into chains during this process.
Now you’re going to add more “silica” to see how this changes the viscosity of your magma. Take another 4 teaspoons (20 mL) of flour and mix it thoroughly with about 4 teaspoons (20 mL) of water in a cup and then add all of that mixture to the rest of the water and flour in the saucepan. Stir while bringing it back up to nearly boiling temperature, and then allow it to cool. This mixture should slowly become much thicker — something like porridge — because there is more gluten and more chains have been formed (see the photo).
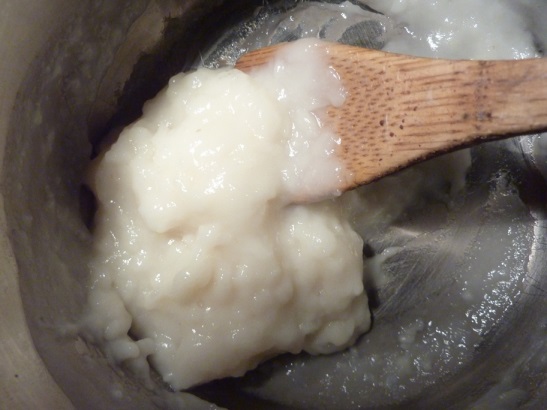
This is analogous to magma, of course. As we’ll see below, magmas have quite variable contents of silica and therefore have widely varying viscosities (“thicknesses”) during cooling.
See Appendix 3 for Exercise 3.2 answers.
Image Descriptions
Figure 3.2.1 image description: The average elemental proportions in the Earth’s crust from the largest amount to the smallest amount. Oxygen (46.6%), Silicon (27.7%), Aluminum (8.1%), Iron (5.0%), Calcium (3.6%), Sodium (2.8%), Potassium (2.6%), Magnesium (2.1%), Others (1.5%). [Return to Figure 3.2.1]
Figure 3.2.3a image description: Dry mantle rock is predominately solid. However, its melting point is dependent on the temperature and pressure the rock is under. The higher the pressure (meaning the farther the rock is from the Earth’s surface), the more likely dry mantle rock is going to be solid. Dry mantle rock under extreme pressure requires a much higher temperature to melt than dry mantle rock under less pressure. As pressure drops (meaning as the rock rises towards the Earth’s surface), the required temperature to melt the mantle rock drops as well.
Figure 3.2.3b image description: In comparison to dry mantle rock, wet mantle rock under the same amount of pressure (at the same distance from the earth’s surface) requires a lower temperature to melt. When liquid is added to dry mantel rock at a pressure and temperature point in which wet mantle rock would be melted, flux melting occurs. [Return to Figure 3.2.3]
Media Attributions
- Figure 3.2.1, 3.2.2, 3.2.3, 3.2.5: © Steven Earle. CC BY.
- Figure 3.2.4: “Cross section” by José F. Vigil from This Dynamic Planet — a wall map produced jointly by the U.S. Geological Survey, the Smithsonian Institution, and the U.S. Naval Research Laboratory. Adapted by Steven Earle. Public domain.
- Mantle plumes are described in Chapter 4 and mantle convection in Chapter 9. ↵
the process during which a only specific mineral components of a rock melt in response to changing conditions
melting (or partial melting) of rock resulting from a reduction in pressure without a significant reduction in temperature
melting of rock that is facilitated by the addition of a flux (typically water) which lowers the rocks melting point
a plume of hot rock (not magma) that rises through the mantle (either from the base or from part way up) and reaches the surface where it spreads out and also leads to hot-spot volcanism
the formation of molecular chains within a fluid (e.g., a magma) that lead to an increase in the fluid’s viscosity
