Chapter 8 Measuring Geological Time
8.1 The Geological Time Scale
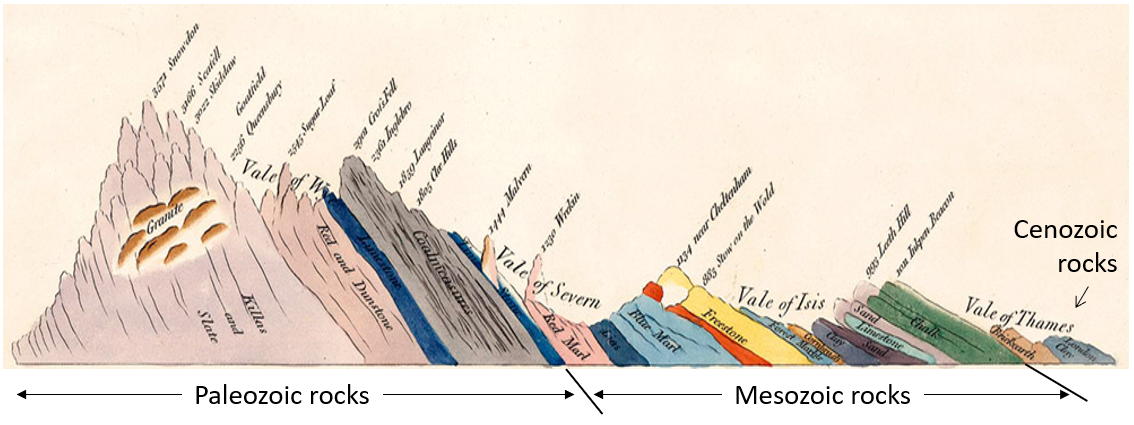
William Smith worked as a surveyor in the coal-mining and canal-building industries in southwestern England in the late 1700s and early 1800s. While doing his work, he had many opportunities to look at the Paleozoic and Mesozoic sedimentary rocks of the region, and he did so in a way that few had done before. Smith noticed the textural similarities and differences between rocks in different locations, and more importantly, he discovered that fossils could be used to correlate rocks of the same age. Smith is credited with formulating the principle of faunal succession (the concept that specific types of organisms lived during different time intervals), and he used it to great effect in his monumental project to create a geological map of England and Wales, published in 1815. For more on William Smith, including a large-scale digital copy of the famous map, see the William Smith Wikipedia page.
Inset into Smith’s great geological map is a small diagram showing a schematic geological cross-section extending from the Thames estuary of eastern England all the way to the west coast of Wales. Smith shows the sequence of rocks, from the Paleozoic rocks of Wales and western England, through the Mesozoic rocks of central England, to the Cenozoic rocks of the area around London (Figure 8.1.1). Although Smith did not put any dates on these—because he didn’t know them—he was aware of the principle of superposition (the idea, developed much earlier by the Danish theologian and scientist Nicholas Steno, that young sedimentary rocks form on top of older ones), and so he knew that this diagram represented a stratigraphic column. And because almost every period of the Phanerozoic is represented along that section through Wales and England, it is a primitive geological time scale.
Smith’s work set the stage for the naming and ordering of the geological periods, which was initiated around 1820, first by British geologists, and later by other European geologists. Many of the periods are named for places where rocks of that age are found in Europe, such as Cambrian for Cambria (Wales), Devonian for Devon in England, Jurassic for the Jura Mountains in France and Switzerland, and Permian for the Perm region of Russia. Some are named for the type of rock that is common during that age, such as Carboniferous for the coal- and carbonate-bearing rocks of England, and Cretaceous for the chalks of England and France.
The early time scales were only relative because 19th century geologists did not know the ages of the rocks. That information was not available until the development of isotopic dating techniques early in the 20th century.
The geological time scale is currently maintained by the International Commission on Stratigraphy (ICS), which is part of the International Union of Geological Sciences. The time scale is continuously being updated as we learn more about the timing and nature of past geological events. You can view the ICS time scale online. It would be a good idea to print a copy (in colour) to put on your wall while you are studying geology.
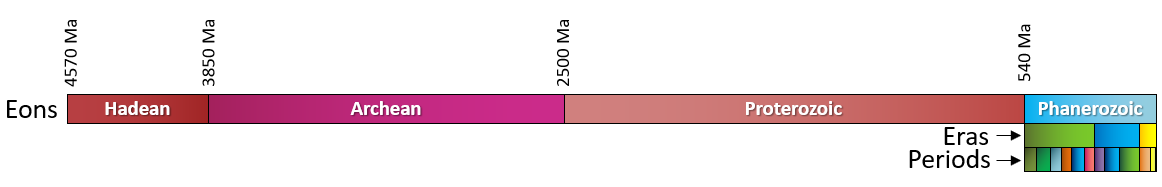
Geological time has been divided into four eons: Hadean (4570 to 4850 Ma), Archean (3850 to 2500 Ma), Proterozoic (2500 to 540 Ma), and Phanerozoic (540 Ma to present). As shown in Figure 8.1.2, the first three of these represent almost 90% of Earth’s history. The last one, the Phanerozoic (meaning “visible life”), is the time that we are most familiar with because Phanerozoic rocks are the most common on Earth, and they contain evidence of the life forms that we are familiar with to varying degrees.
The Phanerozoic eon—the past 540 Ma of Earth’s history—is divided into three eras: the Paleozoic (“early life”), the Mesozoic (“middle life”), and the Cenozoic (“new life”), and each of these is divided into a number of periods (Figure 8.1.3). Most of the organisms that we share Earth with evolved at various times during the Phanerozoic.

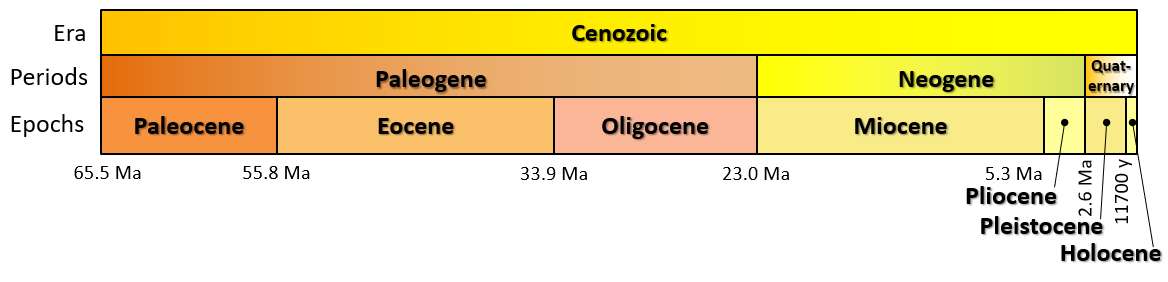
The Cenozoic era, which represents the past 65.5 Ma, is divided into three periods: Paleogene, Neogene, and Quaternary, and seven epochs (Figure 8.1.4). Dinosaurs became extinct at the start of the Cenozoic, after which birds and mammals radiated to fill the available habitats. Earth was very warm during the early Eocene and has steadily cooled ever since. Glaciers first appeared on Antarctica in the Oligocene and then on Greenland in the Miocene, and covered much of North America and Europe by the Pleistocene. The most recent of the Pleistocene glaciations ended around 11,700 years ago. The current epoch is known as the Holocene. Epochs are further divided into ages (a.k.a. stages), but we won’t be going into that level of detail here.
Most of the boundaries between the periods and epochs of the geological time scale have been fixed on the basis of significant changes in the fossil record. For example, as already noted, the boundary between the Cretaceous and the Paleogene coincides exactly with a devastating mass extinction. That’s not a coincidence. The dinosaurs and many other types of organisms went extinct at this time, and the boundary between the two periods marks the division between sedimentary rocks with Cretaceous organisms (including dinosaurs) below, and Paleogene organisms above.
Image Descriptions
Media Attributions
- Figure 8.1.1: “Sketch of the succession of strata and their relative altitudes” by William Smith. Adapted by Steven Earle. Public domain.
- Figures 8.1.2, 8.1.3, 8.1.4: © Steven Earle. CC BY.
the principle that life on Earth has evolved in an orderly way, and that we can expect to always find fossils of a specific type in rocks of a specific age
the principle that in a sequence of layered rocks that is not overturned or interrupted by faulting, the oldest will be at the bottom and the youngest at the top
