Chapter 19 Climate Change
19.3 Implications of Climate Change
Although we’ve all experienced the effects of climate change over the past decade it’s not straightforward for climatologists to make the connection between a warming climate and specific weather events, and most are justifiably reluctant to ascribe any specific event to climate change. In this respect, the best measures of climate change are those that we can detect over several decades, such as the temperature changes shown in Figure 19.2.2, or the sea-level rise shown in Figure 19.3.1. As already stated, sea level has risen approximately 20 cm since 1750, and that rise is attributed to both warming (and therefore expanding) seawater and melting glaciers and other land-based snow and ice (melting of sea ice does not contribute directly to sea-level rise as it is already floating in the ocean).
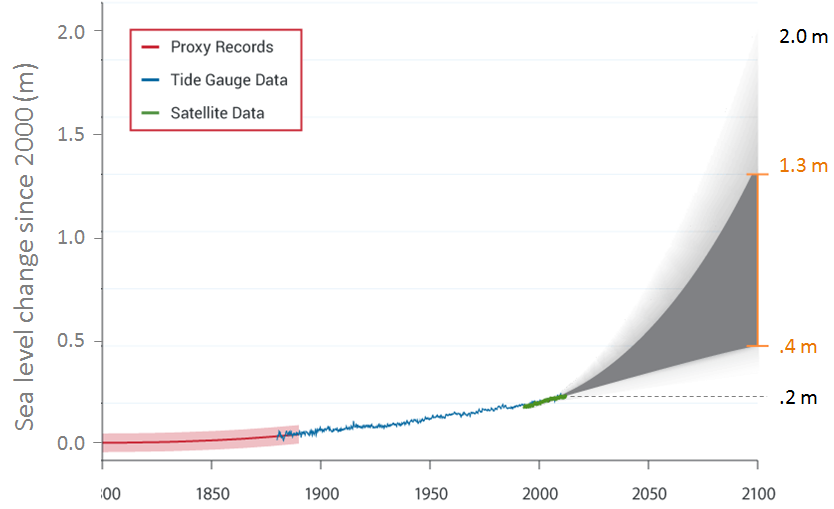
Projections for sea-level rise to the end of this century vary widely. This is in large part because we do not know which of the possible climate change scenarios we will most closely follow, but many are in the range from 0.5 m to 2.0 m. One of the problems in predicting sea-level rise is that we do not have a strong understanding of how large ice sheets—such as Greenland and Antarctica—will respond to future warming. Another issue is that the oceans don’t respond immediately to warming. For example, with the current amount of warming, we are already committed to a future sea-level rise of between 1.3 m and 1.9 m, even if we could stop climate change today. This is because it takes decades to centuries for the existing warming of the atmosphere to be transmitted to depth within the oceans and to exert its full impact on large glaciers. Most of that committed rise would take place over the next century, but some would be delayed longer. And for every decade that the current rates of climate change continue, that number increases by another 0.3 m. In other words, if we don’t make changes quickly, by the end of this century we’ll be locked into about 3 m of future sea-level rise.
In a 2008 report, the Organisation for Economic Co-operation and Development (OECD) estimated that by 2070 approximately 150 million people living in coastal areas could be at risk of flooding due to the combined effects of sea-level rise, increased storm intensity, and land subsidence. The assets at risk (buildings, roads, bridges, ports, etc.) are in the order of $35 trillion ($35,000,000,000,000). Countries with the greatest exposure of population to flooding are China, India, Bangladesh, Vietnam, U.S.A., Japan, and Thailand. Some of the major cities at risk include Shanghai, Guangzhou, Mumbai, Kolkata, Dhaka, Ho Chi Minh City, Tokyo, Miami, and New York.
One of the other risks for coastal populations, besides sea-level rise, is that climate warming is also associated with an increase in the intensity of tropical storms (e.g., hurricanes or typhoons), which almost always bring serious flooding from intense rain and storm surges. Some recent examples are New Orleans in 2005 with Hurricane Katrina, and New Jersey and New York in 2012 with Hurricane Sandy (Figure 19.3.2).
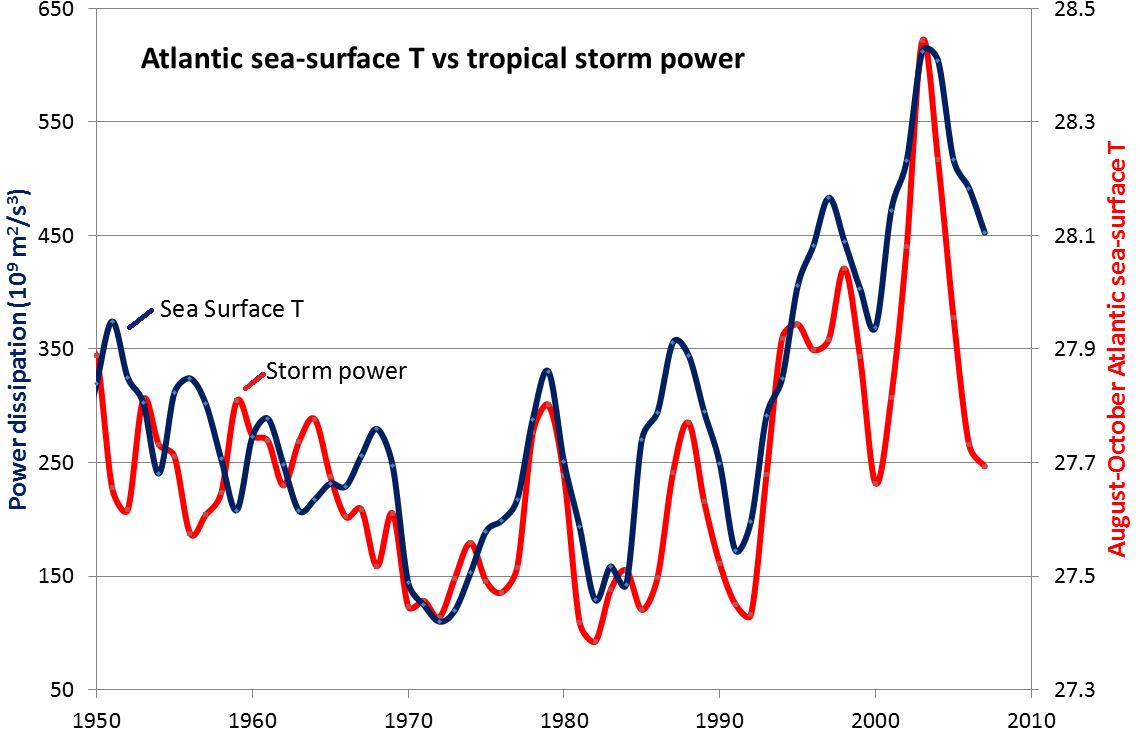
Tropical storms get their energy from the evaporation of warm seawater in tropical regions. In the Atlantic Ocean, this takes place between 8° and 20° N in the summer. Figure 19.3.3 shows the variations in the sea-surface temperature (SST) of the tropical Atlantic Ocean (in blue) versus the amount of power represented by Atlantic hurricanes between 1950 and 2008 (in red). Not only has the overall intensity of Atlantic hurricanes increased with the warming since 1975, but the correlation between hurricanes and sea-surface temperatures is very strong over that time period.
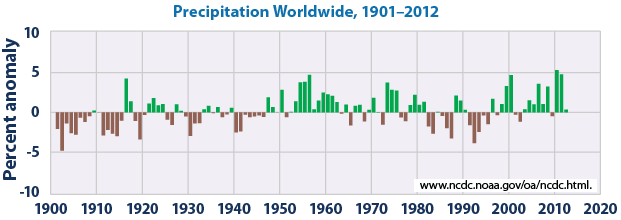
Because warm air is able to hold more water than cold air, the general global trend over the past century has been one of increasing precipitation (Figure 19.3.4).
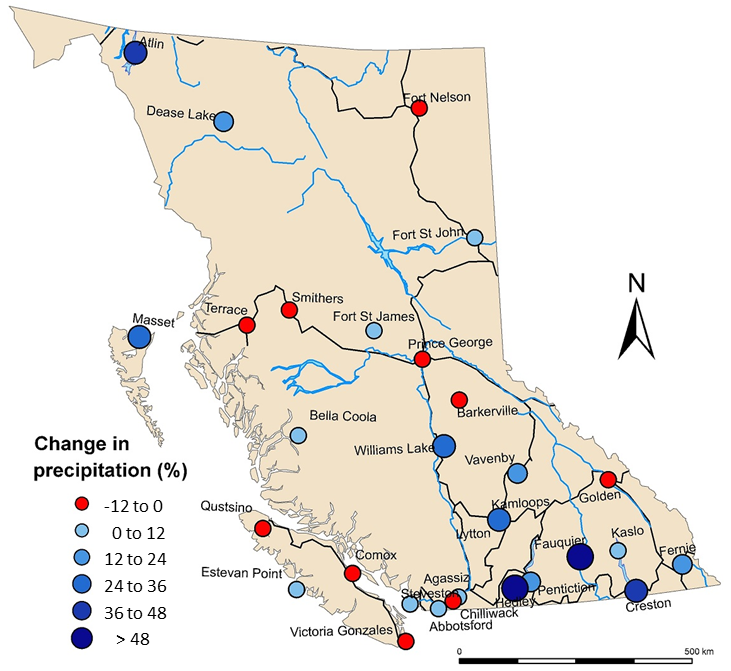
A similar trend is evident for British Columbia based on weather data from 1945 to 2005 for 29 stations distributed around the province (Figure 19.3.5). Of those stations, 19 show an increase in precipitation and 10 show a decrease. While the decreases are all less than 12%, some of the increases are greater than 48%. Based on the data from these stations, it is estimated that approximately 60 mm/year more precipitation fell on British Columbia in 2005 compared with 1945. That is equivalent to about six months of the average flow of the Fraser River.
While the overall amount of precipitation (total volume of rain plus snow) increased at 19 out of 29 stations between 1945 and 2005, the amount of snowfall decreased at every single station. This is a disturbing trend for many of us, including: operators and users of winter resorts and hydroelectric dams, the Wildfire Management Branch, people who drink water from reservoirs that are replenished by snow, and people who eat food that is grown across western Canada and is irrigated with water derived from melting snow.
Exercise 19.4 Rainfall and ENSO
Figure 19.3.6 shows the monthly precipitation data for Penticton, BC from 1950 to 2005 (solid line) along with the ENSO (El Niño Southern Oscillation) index values (dotted line). High ENSO index values correspond to strong El Niño events, such as 1983 and 1998. Describe the relationship between ENSO and precipitation in B.C.’s southern interior.
It’s not necessarily a consistent relationship.
See Appendix 3 for Exercise 19.4 answers.
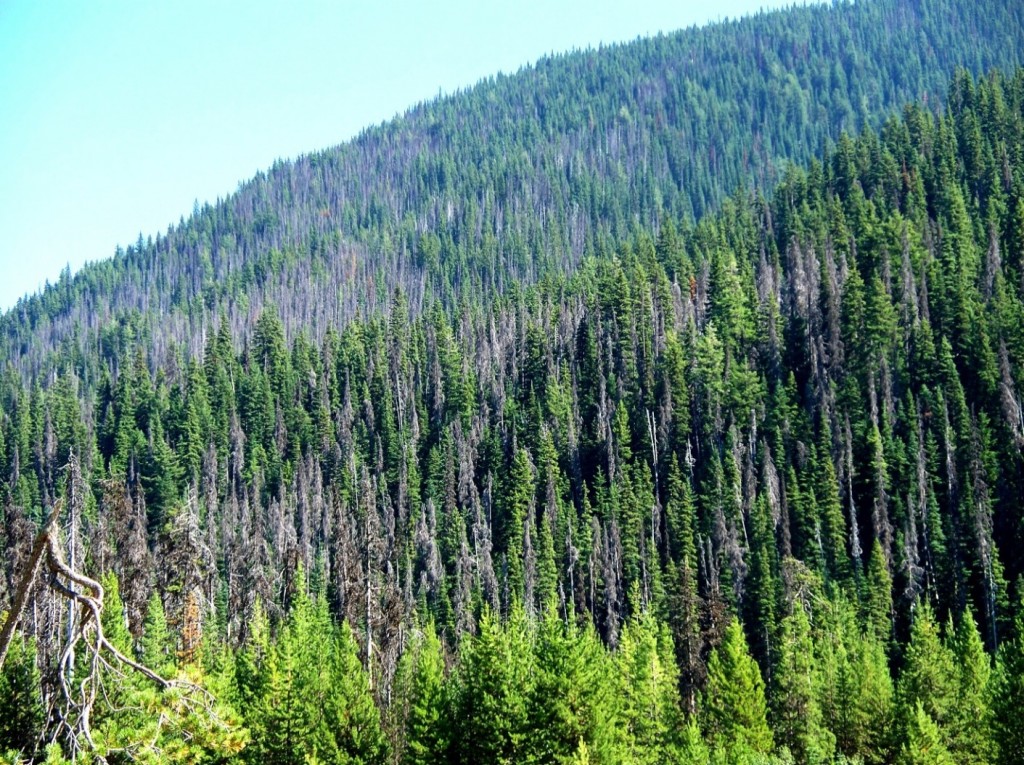
The geographical ranges of diseases and pests, especially those caused or transmitted by insects, have been shown to extend toward temperate regions because of climate change. West Nile virus and Lyme disease are two examples that already directly affect Canadians, while dengue fever could be an issue in the future. Canadians are also indirectly affected by the increase in populations of pests such as the mountain pine beetle (Figure 19.3.7).
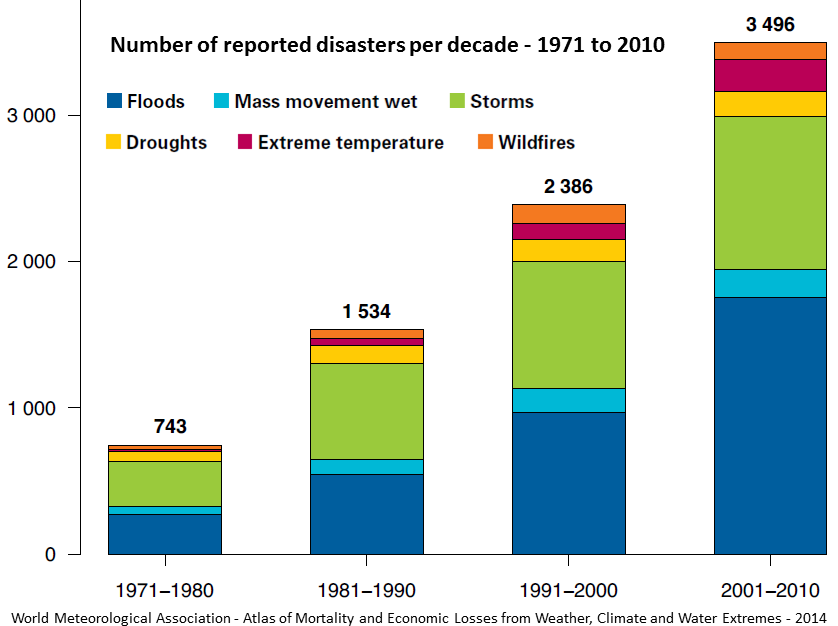
A summary of the impacts of climate change on natural disasters is given in Figure 19.3.8. The major types of disasters related to climate are floods and storms, but the health implications of extreme temperatures are also becoming a great concern. In the decade 1971 to 1980, extreme temperatures were the fifth most common natural disasters; by 2001 to 2010, they were the third most common.
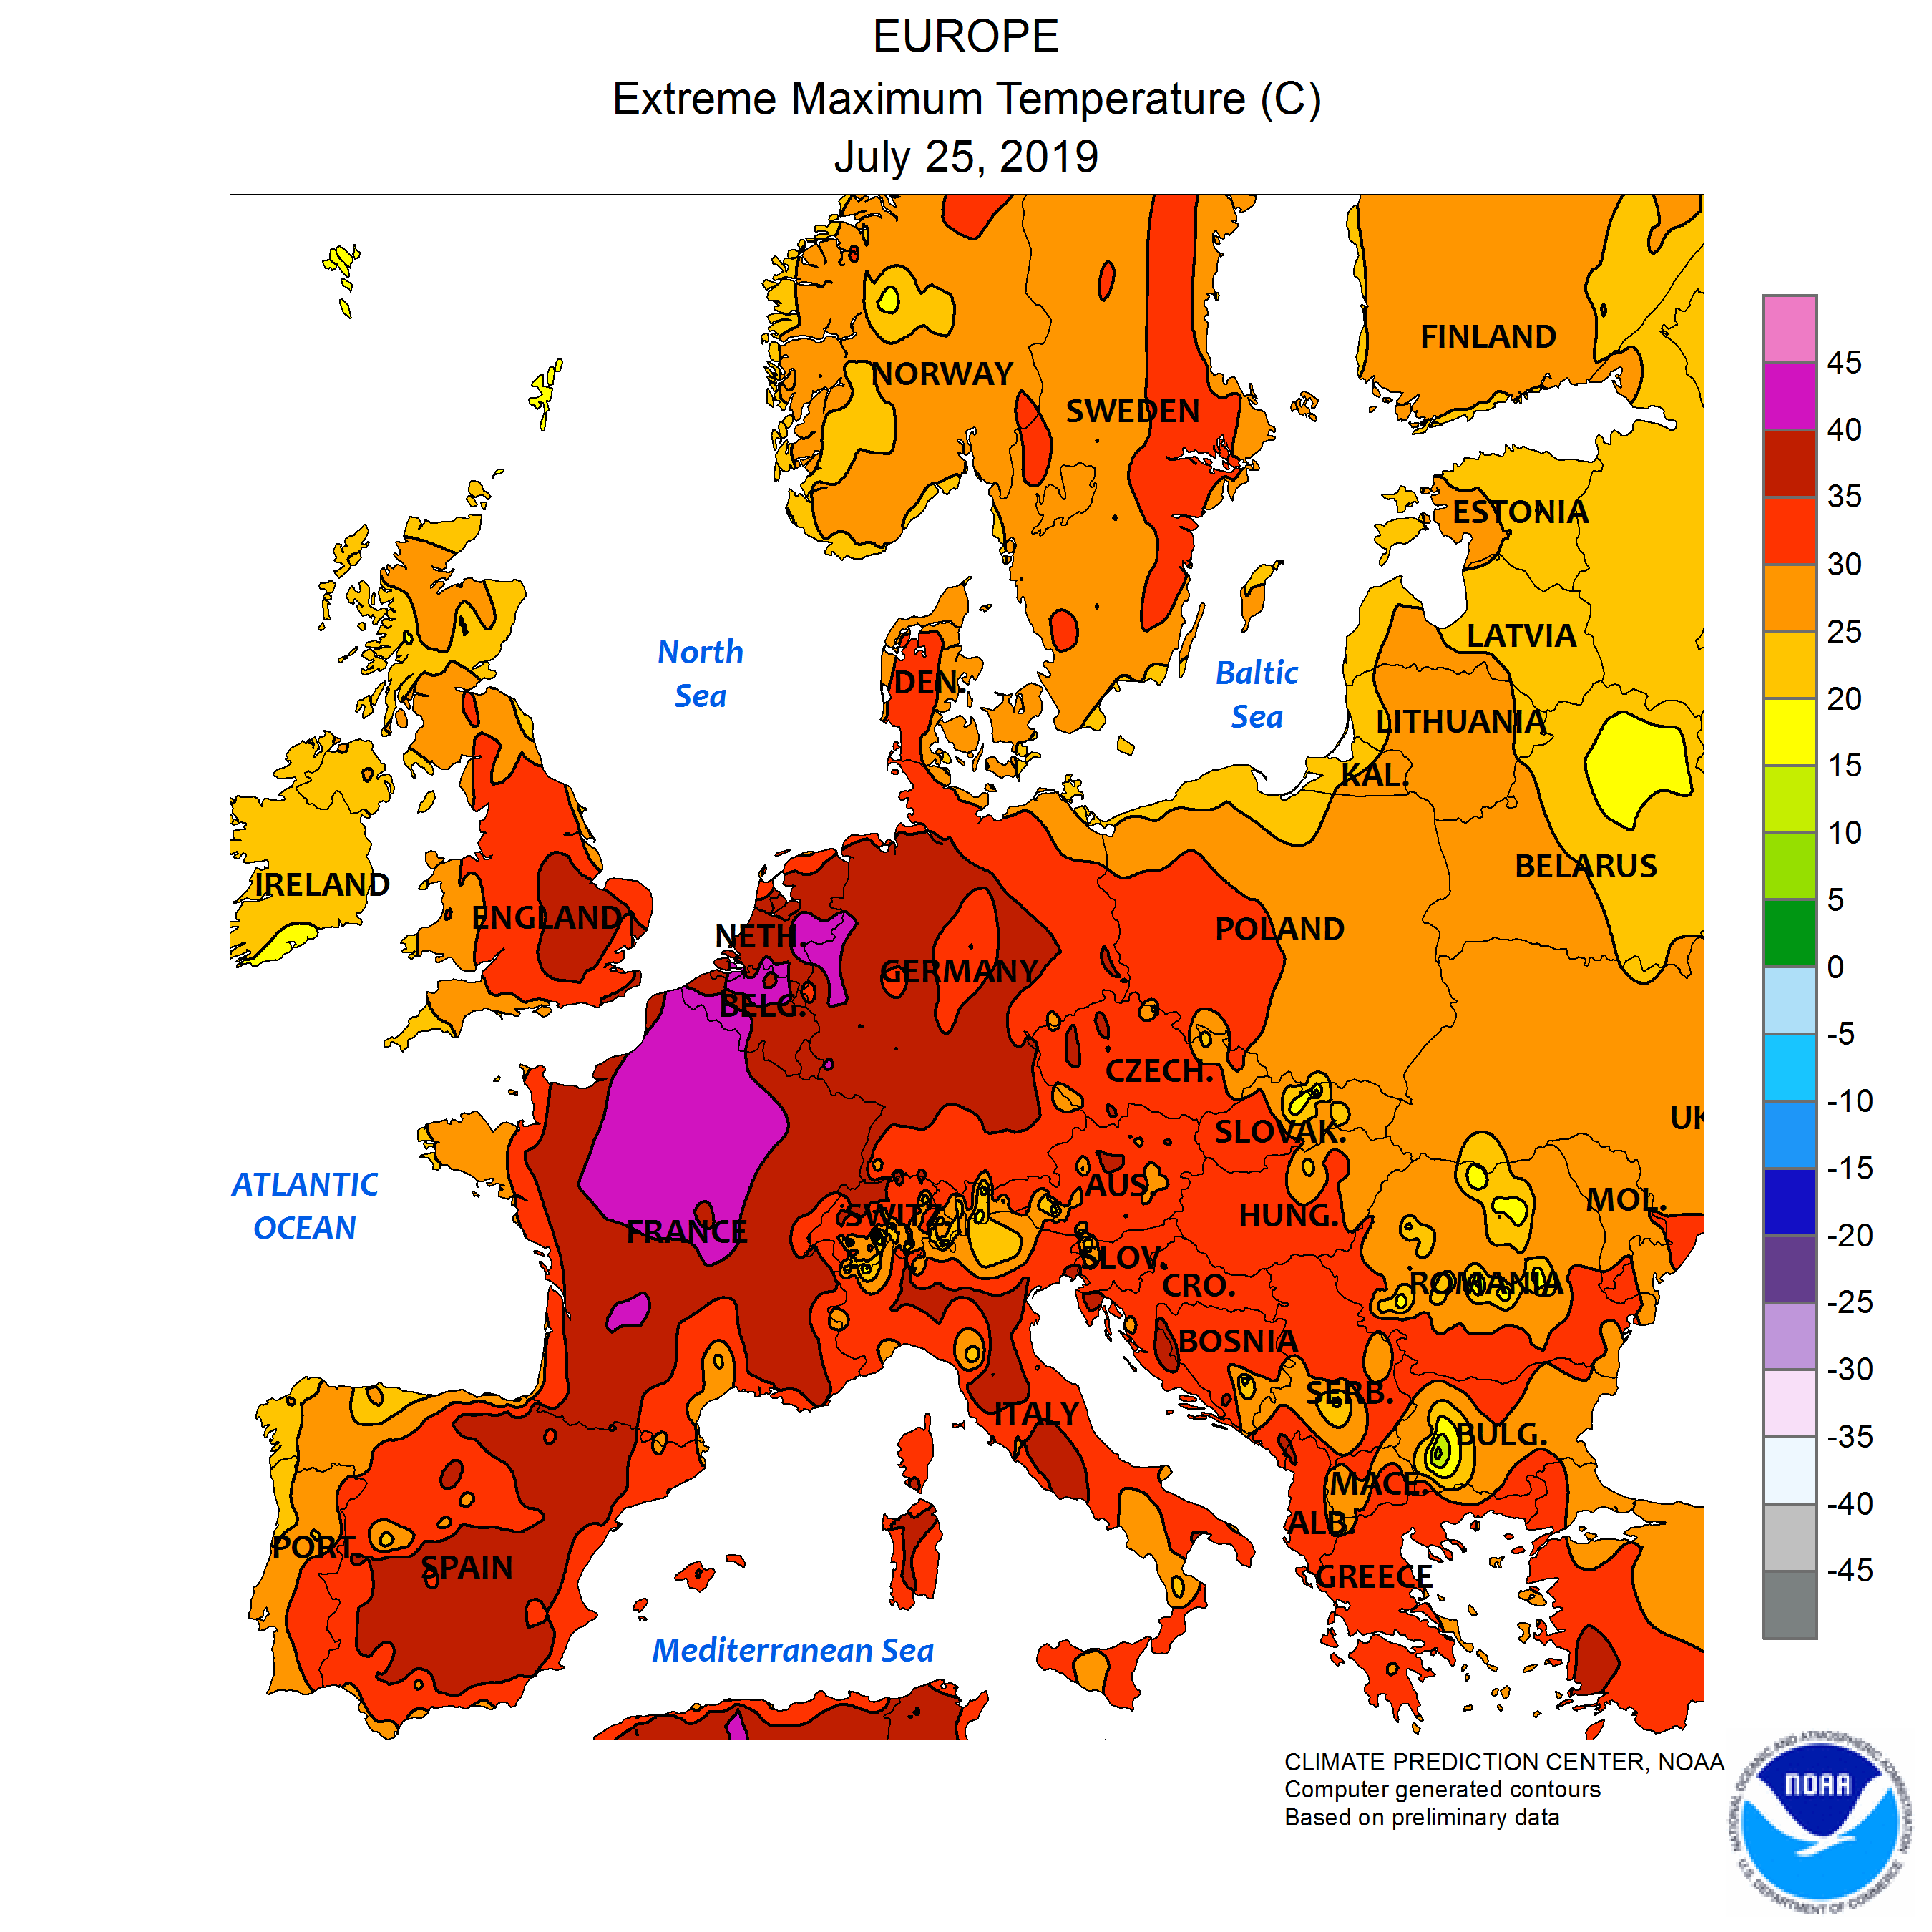
For several days in both June and July of 2019, many parts of Europe experienced massive heat waves with all-time national record temperatures set in several countries (Belgium, Finland, France, Germany, Luxembourg, Netherlands, and United Kingdom) (Figure 19.3.9). At the time of writing (August 2019) the death toll from these events is not known. A similar event in Russia in 2010 is estimated to have resulted in over 55,000 deaths.
Exercise 19.5 How can you reduce your impact on the climate?
If you look back to Figure 19.2.3 and the related text, you can easily see what aspects of our way of life are the most responsible for climate change. Think about how you could make changes to your own lifestyle to reduce your impact on the climate. It may depend on where you live, and the degree to which fossil fuels are used to generate the electricity that you use, but it’s most likely to include how, how far, how fast, and how frequently you move around.
If you hold the opinion that there isn’t much point in making changes to your lifestyle because others won’t or because your contribution is only a tiny fraction of the problem, bear in mind that all of us have the opportunity to set an example that others can follow. And remember the words of the American anthropologist Margaret Mead:
Never doubt that a small group of thoughtful, committed citizens can change the world. Indeed, it is the only thing that ever has.
Image Descriptions
The percent change in precipitation by city in British Columbia from 1945 to 2005:
- Negative 12% to 0%:
- Barkerville
- Chilliwack
- Comox
- Fort Nelson
- Golden
- Prince George
- Qustsino
- Smithers
- Terrace
- Victoria Gonzales
- 0% to 12%
- Abbotsford
- Agassiz
- Estevan Point
- Kaslo
- Steveston
- 12% to 24%
- Fort St. James
- Fort St. John
- Bella Coola
- 24% to 36%
- Fernie
- Penticton
- Vavenby
- 26% to 48%
- Dease Lake
- Kamloops
- Masset
- Williams Lake
- Greater than 48%
- Atlin
- Fauquier
- Hedley
Figure 19.3.8 image description: From the 1970s, the number of reported disasters by decade has grown steadily. In the 1970s, 743 disasters were reported; in the 1980s, 1,534 were reported; in the 1990s, 2,386 were reported, and in the 2000s, 3,496 were reported. Together, floods and storms make up about three quarters of the reported disasters each decade, followed by mass movement wet, droughts, extreme temperature, and wildfires. [Return to Figure 19.3.8]
Media Attributions
- Figure 19.3.1: “Past and Projected Changes in Global Sea Level Rise” based on data from Parris et al. 2012 with input from NASA Jet Propulsion Laboratory. Adapted by Steven Earle. Public domain.
- Figure 19.3.2: “Hurricane Sandy New Jersey Pier” © Master Sgt. Mark C. Olsen/U.S. Air Force/New Jersey National Guard. CC BY.
- Figure 19.3.3: “Atlantic sea-surface T vs. tropical storm power” © Steven Earle. CC BY. Based on data from Papers, Data, and Graphics Pertaining to Tropical Cyclone Trends and Variability.
- Figure 19.3.4: “Precipitation Worldwide, 1901-2013” by NASA. Public domain.
- Figure 19.3.5: © Steven Earle. CC BY. Based on data from Environment Canada.
- Figure 19.3.6: © Steven Earle. CC BY. Based on precipitation data from Environment Canada and ENSO data.
- Figure 19.3.7: “Pine Beetle in Manning Park” © Jonhall. CC BY.
- Figure 19.3.8: WMO Atlas of Mortality and Economic Losses from Weather, Climate and Water Extremes, 2014. CC BY-NC-ND.
- Figure 19.3.9: “Heatwave in Russia” by Jesse Allen/NASA Earth Observatory. Public domain.
