Chapter 20 Geological Resources
20.3 Fossil Fuels
There are numerous types of fossil fuels, but all of them involve the storage of organic matter in sediments or sedimentary rocks. Fossil fuels are rich in carbon and almost all of that carbon ultimately originates from CO2 taken out of the atmosphere during photosynthesis. That process, driven by solar energy, involves reduction (the opposite of oxidation) of the carbon, resulting in it being combined with hydrogen instead of oxygen. The resulting organic matter is made up of complex and varied carbohydrate molecules.
Most organic matter is oxidized back to CO2 relatively quickly (within weeks or years in most cases), but any of it that gets isolated from the oxygen of the atmosphere (for example, deep in the ocean or in a stagnant bog) may last long enough to be buried by sediments and, if so, may be preserved for tens to hundreds of millions of years. Under natural conditions, that means it will be stored until those rocks are eventually exposed at the surface and weathered.
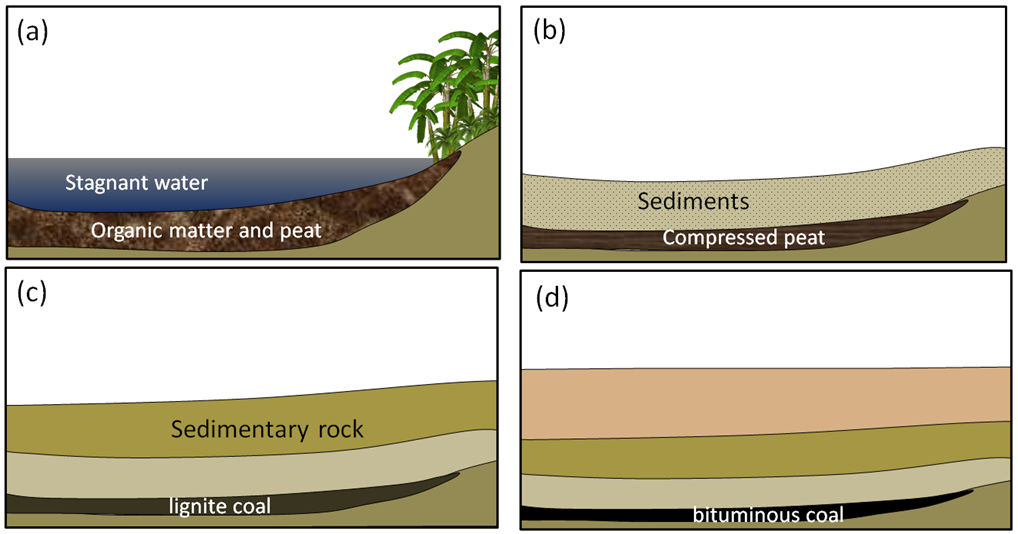
In this section, we’ll discuss the origins and extraction of the important fossils fuels, including coal, oil, and gas. Coal, the first fossil fuel to be widely used, forms mostly on land in swampy areas adjacent to rivers and deltas in areas with humid tropical to temperate climates. The vigorous growth of vegetation leads to an abundance of organic matter that accumulates within stagnant water, and thus does not decay and oxidize. This situation, where the dead organic matter is submerged in oxygen-poor water, must be maintained for centuries to millennia in order for enough material to accumulate to form a thick layer (Figure 20.3.1a). At some point, the swamp deposit is covered with more sediment — typically because a river changes its course or sea level rises (Figure 20.3.1b). As more sediments are added, the organic matter starts to become compressed and heated. Low-grade lignite coal forms at depths between a few 100 m and 1,500 m and temperatures up to about 50°C (Figure 20.3.1c). At between 1,000 m to 5,000 m depth and temperatures up to 150°C m, bituminous coal forms (Figure 20.3.1d). At depths beyond 5,000 m and temperatures over 150°C, anthracite coal forms.
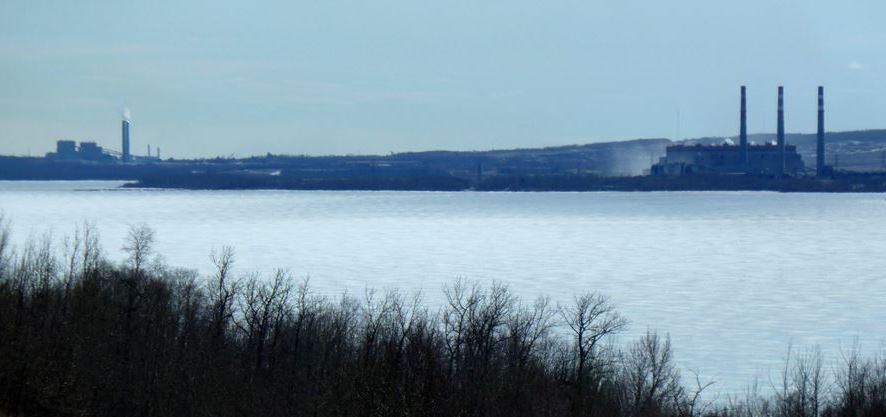
There are significant coal deposits in many parts of Canada, including the Maritimes, Ontario, Saskatchewan, Alberta, and British Columbia. In Alberta and Saskatchewan, much of the coal is used for electricity generation. Coal from the Highvale Mine (Figure 20.3.2), Canada’s largest, is used to feed the Sundance and Keephills power stations west of Edmonton. Almost all of the coal mined in British Columbia is exported for use in manufacturing steel.
While almost all coal forms on land from terrestrial vegetation, most oil and gas is derived primarily from marine micro-organisms that accumulate within sea-floor sediments. In areas where marine productivity is high, dead organic matter is delivered to the sea floor fast enough that some of it escapes oxidation. This material accumulates in the muddy sediments, which become buried to significant depth beneath other sediments.
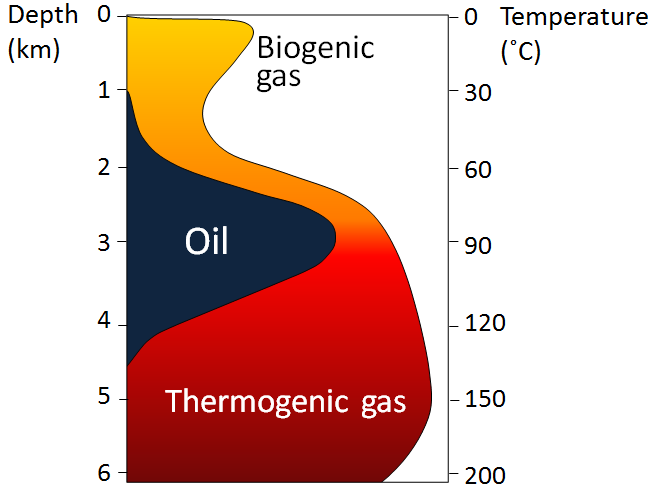
As the depth of burial increases, so does the temperature—due to the geothermal gradient—and gradually the organic matter within the sediments is converted to hydrocarbons (Figure 20.3.3). The first stage is the biological production (involving anaerobic bacteria) of methane. Most of this escapes back to the surface, but some is trapped in methane hydrates near the sea floor. At depths beyond about 2 km, and at temperatures ranging from 60° to 120°C, the organic matter is converted by chemical processes to oil. This depth and temperature range is known as the oil window. Beyond 120°C most of the organic matter is chemically converted to methane.
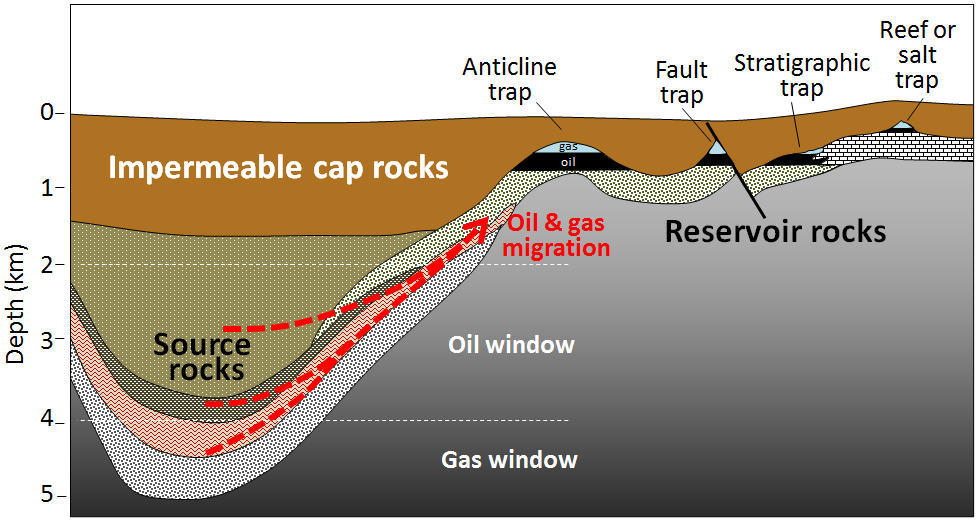
The organic matter-bearing rock within which the formation of gas and oil takes place is known to petroleum geologists as the source rock. Both liquid oil and gaseous methane are lighter than water, so as liquids and gases form, they tend to move slowly toward the surface, out of the source rock and into reservoir rocks. Reservoir rocks are typically relatively permeable because that allows migration of the fluids from the source rocks, and also facilitates recovery of the oil or gas. In some cases, the liquids and gases make it all the way to the surface, where they are oxidized, and the carbon is returned to the atmosphere. But in other cases, they are contained by overlying impermeable rocks (e.g., mudrock) in situations where anticlines, faults, stratigraphy changes, and reefs or salt domes create traps (Figure 20.3.4).
The liquids and gases that are trapped within reservoirs become separated into layers based on their density, with gas rising to the top, oil below it, and water underneath the oil. The proportions of oil and gas depend primarily on the temperature in the source rocks. Some petroleum fields, such as many of those in Alberta, are dominated by oil, while others, notably those in northeastern B.C., are dominated by gas.
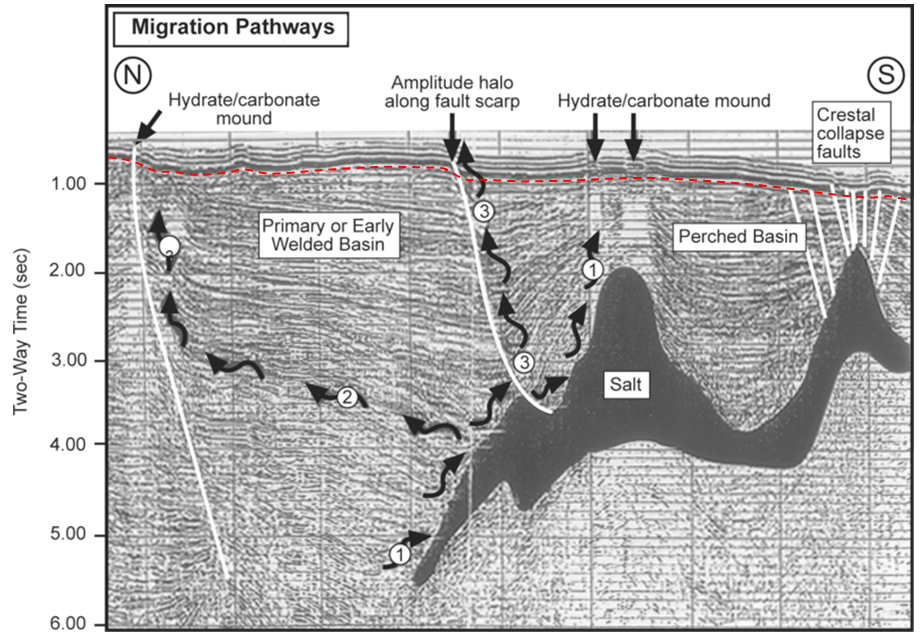
In general, petroleum fields are not visible from the surface, and their discovery involves the search for structures in the subsurface that have the potential to form traps. Seismic surveys are the most commonly used tool for early-stage petroleum exploration, as they can reveal important information about the stratigraphy and structural geology of subsurface sedimentary rocks. An example from the Gulf of Mexico south of Texas is shown in Figure 20.3.5. In this area, a thick evaporite deposit (“salt”) has formed domes because salt is lighter than other sediments and tends to rise slowly toward the surface; this has created traps. The sequence of deformed rocks is capped with a layer of undeformed rock.
Exercise 20.4 Interpreting a Seismic Profile
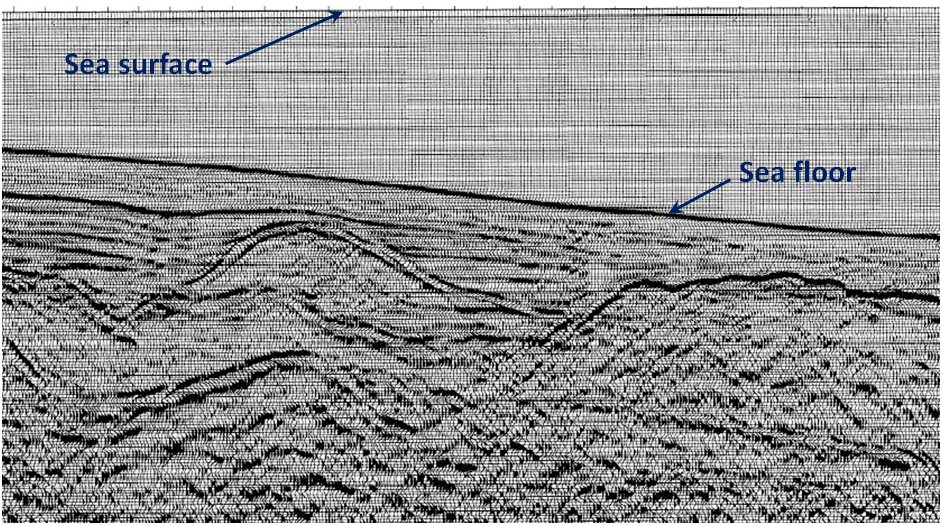
The cross-section shown in Figure 20.3.6 is from a ship-borne seismic survey in the Bering Sea off the west coast of Alaska. As a petroleum geologist, it’s your job to pick two separate locations to drill for oil or gas. Which locations would you choose?
See Appendix 3 for Exercise 20.4 answers.
The type of oil and gas reservoirs illustrated in Figures 20.3.4 and 20.3.5 are described as conventional reserves. Some unconventional types of oil and gas include oil sands, shale gas, and coal-bed methane.
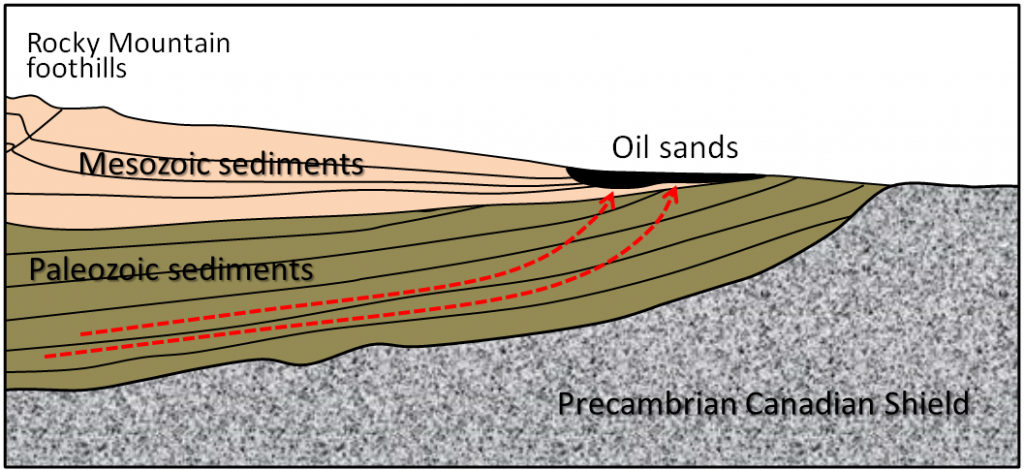
Oil sands are important because the reserves in Alberta are extremely large (the largest single reserve of oil in the world), but they are very controversial from an environmental and social perspective. They are “unconventional” because the oil is exposed near the surface and is highly viscous because of microbial changes that have taken place at the surface. The hydrocarbons that form this reserve originated in deeply buried Paleozoic rocks adjacent to the Rocky Mountains and migrated up and toward the east (Figure 20.3.7).
The oil sands are controversial primarily because of the environmental cost of their extraction. Since the oil is so viscous, it requires heat to make it sufficiently liquid to process. This energy comes from gas; approximately 25 m3 of gas is used to produce 0.16 m3 (one barrel) of oil. (That’s not quite as bad as it sounds, as the energy equivalent of the required gas is about 20% of the energy embodied in the produced oil.) The other environmental cost of oil sands production is the devastation of vast areas of land where strip-mining is taking place and tailings ponds are constructed, and the unavoidable release of contaminants into the groundwater and rivers of the region.
At present, most oil recovery from oil sands is achieved by mining the sand and processing it on site. Exploitation of oil sand that is not exposed at the surface depends on in situ processes, an example being the injection of steam into the oil-sand layer to reduce the viscosity of the oil so that it can be pumped to the surface.
Shale gas is gas that is trapped within rock that is too impermeable for the gas to escape under normal conditions, and it can only be extracted by fracturing the reservoir rock using water and chemicals under extremely high pressure. This procedure is known as hydraulic fracturing or “fracking.” Fracking is controversial because of the volume of water used, and because, in some jurisdictions, the fracking companies are not required to disclose the nature of the chemicals used. Although fracking is typically done at significant depths, there is always the risk that overlying water-supply aquifers could be contaminated (Figure 20.3.8). Fracking also induces low-level seismicity.

During the process that converts organic matter to coal, some methane is produced, which is stored within the pores of the coal. When coal is mined, methane is released into the mine where it can become a serious explosion hazard. Modern coal-mining machines have methane detectors on them and actually stop operating if the methane levels are dangerous. It is possible to extract the methane from coal beds without mining the coal; gas recovered this way is known as coal-bed methane.
Media Attributions
- Figures 20.3.1, 20.3.2, 20.3.3, 20.3.4: © Steven Earle. CC BY.
- Figure 20.3.5: “Sedimentary basin analysis” © AAPG. Based on data from Lovely and Ruggiero. CC BY-SA.
- Figure 20.3.6: Image from the USGS. Public domain.
- Figure 20.3.7: © Steven Earle. CC BY.
- Figure 20.3.8: “HydroFrac2” © Mikenorton. Adapted by Steven Earle. CC BY-SA.
a low-grade type of coal with less than 70% carbon
a medium-grade type of coal with 70 to 92% carbon
a high grade of coal (92 to 98% carbon) that is formed from deep burial and weak metamorphism
the depth range, which is approximately 2000 to 4000 metres, within which the temperature is appropriate for the formation of oil from organic matter in sedimentary rock
the sedimentary rock from which petroleum originates prior to its migration into a reservoir rock
rock into which petroleum has migrated and is now trapped
fracturing rock by injecting water and chemicals down a well at very high pressure (equivalent to fracking)
fracturing rock by injecting water and chemicals down a well at very high pressure (equivalent to hydraulic fracturing)
methane that is trapped within the porosity of coal
