8 Data Analysis 2
8.1 Percentiles and Quartiles

Learning Objectives
By the end of this section it is expected that you will be able to:
- Describe the measures of location: percentile and quartile
- Find the percentile represented by a given data value
- Determine the first, second and third quartiles for a set of data
Measures of Central Tendency
The mean, median and mode, as measures of central tendency, provide us with a point of comparison. As an example, consider Company ABC where the average (mean) salary is $55,000/year. An employee earning $38,000/year might feel unjustly treated or at the very least the employee might explore the reasons for the substantial difference. If in the process the employee learns that the median salary at his workplace is $26,000/year the employee would learn that relative to everyone else this employee’s salary is in the upper half of the employee group.
To provide additional comparison the employee could consider other measures of position or location. Two such measures are percentiles and quartiles.
Percentiles
Percentiles are useful for comparing values. If a data item is in the 75th percentile then three-quarters of the values are less than this value. This is not to be confused with a score of 75%, which is something very different. A student could score 35% on an exam but be in the 75th percentile. This means that relative to the rest of the class the student had a score that was higher than 75% of the students.
Percentiles
Percentiles divide ordered data into hundredths. A data item is said to be in the kth percentile of a data set if k% of the data items are less than the item.
The notation Pk can be used to represent the kth percentile. A data set can be divided into one hundred equal parts by ninety-nine percentiles P1 , P2 , P3 , … P99 . The 60th percentile would be denoted P60 . If an item is in the 60th percentile, then 60 percent of the data items are less than this item.
Consider a set of math exam scores. A student scoring in the 60th percentile achieved a score equal to or higher than 60 percent of the other students. This does not mean that the student scored 60% on the exam. Perhaps the student’s score was 78%, which would mean that 60 percent of the other students in the class had exam scores less than (or equal to) 78%.
It is important to note that since percentiles divide a data set into one hundred equal parts, percentiles are best used with large data sets. Percentiles are mostly used with very large populations. For a specified percentile Pk if you were to say that k percent of the data values are less (and not the same or less) than a specified data value, it would be acceptable because removing one particular data value is not significant.
Refer again to the employee earning $38,000/year at Company ABC. If the employee learns that their salary is in the 90th percentile then 90 percent of the other employees at Company ABC have a salary less than (or possibly equal to) this salary. In relation to the other employees this salary ranks among the upper portion of the employee group.
Percentiles are useful for comparing values. For this reason, universities and colleges use percentiles on entrance exams. Rather than set one value as an acceptance score, a university may set a percentile target. Perhaps all students scoring in the the 80th percentile or above will receive an acceptance letter. Every year there is likely to be a different acceptance score. Students will be accepted based on their score relative to all other applicants.
Determining Percentiles
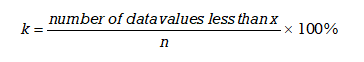
To determine the kth percentile that is represented by a particular data item x, the following formula can be used.
Step 1: If necessary order the data values from smallest to largest.
Step 2: Determine the total number of data values, n. This will be the denominator in the formula.
Step 3: Count the number of data values that are less than the value x. This will be the value in the numerator of the formula.
Step 4: Calculate the percentile, k, that is associated with a score of x using the formula.
EXAMPLE 1
A class set of exam scores for 48 students are ranked from lowest to highest. Determine the percentiles associated with the scores of a) 39% b) 60% c) 94%.
| 39 | 54 | 59 | 65 | 75 | 79 | 84 | 92 |
| 42 | 54 | 60 | 67 | 76 | 80 | 86 | 92 |
| 43 | 55 | 60 | 69 | 76 | 80 | 88 | 94 |
| 48 | 57 | 60 | 69 | 77 | 82 | 88 | 95 |
| 51 | 57 | 63 | 72 | 77 | 83 | 89 | 96 |
| 51 | 59 | 65 | 72 | 78 | 83 | 91 | 97 |
Solution
a) For a score of 39%:
Step 1: The data values are already ordered from smallest to largest.
Step 2: Determine the number of data values. Since there are 48 students n = 48.
Step 3: We count 0 data values that are less than 39
Step 4: Calculate the percentile, k, that is associated with a score of x using the formula
![]()
k = (0/48)*100% = 0%.
This means that the student who scored 39% is in the 0 percentile. A score of 39% is not higher than any other score.
b) For a score of 60%:
There are 13 scores lower than 60% so k = (13/48)*100% = 27%. A score of 60% is in the 27th percentile which means that 27% (or just over one-fourth) of the test scores are less than 60%.
c) For a score of 94%:
There are 44 scores less than 94% so k = (44/48)*100% = 92%. A score of 94% is in the 92nd percentile which means that 92% of the test scores are less than 94%.
TRY IT 1
A set of assignment scores for a class of 32 students are provided in the table below. Determine the percentiles associated with the scores of a) 61% b) 79% c) 98%.
| 72 | 65 | 85 | 52 | 61 | 49 | 65 | 82 |
| 55 | 99 | 58 | 79 | 98 | 79 | 58 | 93 |
| 88 | 48 | 97 | 74 | 65 | 85 | 71 | 75 |
| 99 | 39 | 60 | 96 | 80 | 70 | 54 | 77 |
Show answer
a) 61% is 28th percentile b) 79% is 59th percentile c) 98% is 91st percentile
Quartiles
Quartiles divide ordered data into quarters. Quartiles are special percentiles. The first quartile, Q1, is the same as the 25th percentile, and the third quartile, Q3, is the same as the 75th percentile. The median is a number that separates ordered data into halves. Half the values are the same as or smaller than the median, and half the values are the same as or larger than the median. The median can be called both the second quartile Q2 and the 50th percentile.
Quartiles
Quartiles divide the data set into four equal parts.
The first quartile, Q1, is the same as the 25th percentile, and the third quartile, Q3, is the same as the 75th percentile. The median can be called both the second quartile, Q2 , and the 50th percentile.
As with the median, the quartiles may or may not be part of the data set.
As indicated in Figure 1 each quartile divides a data set into four equal parts so that one-fourth of the data set is located in each part.

Determining Quartiles
We will consider two methods for determining quartiles. As with percentiles, the data values must first be ordered from smallest to largest. The first method involves dividing the data set into four equal parts. The second method involves the use of formulas.
Determining Quartiles: Method 1
Step 1: Order the data from smallest to largest.
Step 2: Determine the number of data values n.
Step 3: Determine the median (Q2) of the data set. This will divide the data set into two equal parts.
Step 4: Determine Q1. This will divide the first half of the data set into two equal parts.
Step 5: Determine Q3. This will divide the second half of the data set into two equal parts.
Note: The median and the quartiles may not be actual observations from the data set.
Method 1
Consider the following data set:
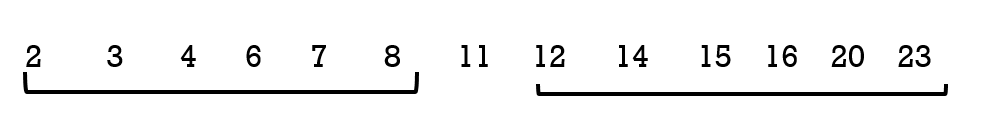
15 4 20 8 3 12 14 11 7 2 6 23 16
Step 1: To determine the quartiles, order the data values from smallest to largest:
2 3 4 6 7 8 11 12 14 15 16 20 23
Step 2: The number of data values is 13.
Step 3: Determine the median, which measures the “centre” of the data. It is the number that separates ordered data into halves. Half the observations are the same number or smaller than the median, and half the observations are the same number or larger.
Since there are 13 observations, the median will be in the seventhh position. The median, and therefore the 2nd quartile Q2 , is eleven. The median is often referred to as the “middle observation,” but it is important to note that it does not actually have to be one of the observed values.
Step 4: The first quartile, Q1, is the middle value of the lower half of the data.
To determine the first quartile, Q1, consider the lower half of the data observations:
2 3 4 6 7 8
Since there are six observations, the middle observation will be the average of the third and fourth data values or (4 + 6)/2 = 5 therefore Q1 is 5
Step 5: The third quartile, Q3, is the middle value of the upper half of the data.
To determine the third quartile, Q3, consider the upper half of the data observations:
12 14 15 16 20 23
Since there are six observations, the middle observation will be the average of 15 and 16 , or 15.5 therefore Q3 is 15.5.
Figure 2 illustrates the three quartiles, which divide the data set into four equal parts.
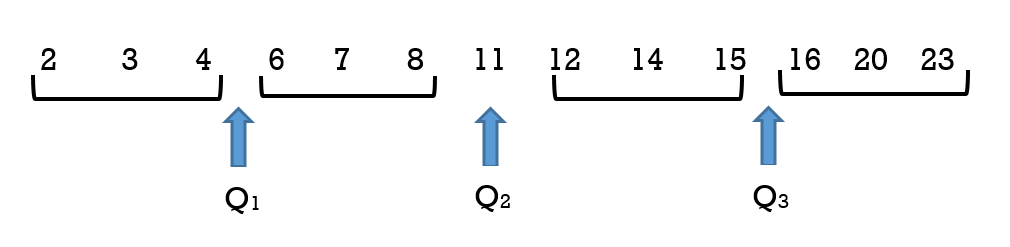
The number 4.5 is the first quartile, Q1. One-fourth of the entire set of observations lie below 4.5 and three-fourths of the data observations lie above 4.5.
The third quartile, Q3, is 15.5. Three-fourths (75%) of the ordered data set lie below 15.5. One-fourth (25%) of the ordered data set lie above 15.5.
It is important to note that a quartile may not be a data observation. Sometimes there may be a need to average or weight the data values when determining the quartiles.
A second method for determining quartiles is to use a formula to determine the position of each quartile. This is especially useful when there is a large number of data items.
Determining Quartiles: Method 2
Quartile Formula
The following formulas, where n is the number of data values, can be used to determine the position of the three quartiles.
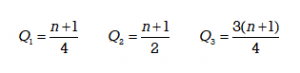
It is important to note that these results indicate the positions of the quartiles, not the actual data obervations. If, for example, the calculation gives Q1=3, this indicates that the first quartile will be the data obervation in the 3rd position. If Q3 = 32, this indicates that the third quartile will be the data observation in the 32nd position.
Step 1: Order the data from smallest to largest.
Step 2: Determine n.
Step 3: Use the formula to determine the position for the median (Q2) of the data set. Count from left to right to determine the corresponding data value. If the position is a fraction then two data values will need to be weighted to determine the median value.
Step 4: Use the formula to determine the position for the first quartile Q1 of the data set. Count from left to right to determine the corresponding data value. If the position is a fraction then two data values will need to be weighted to determine the value of Q1.
Step 5: Use the formula to determine the position for the third quartile Q3 of the data set. Count from left to right to determine the corresponding data value. If the position is a fraction then two data values will need to be weighted to determine the value of Q3.
Method 2:
Consider the following data set:
15 4 20 8 3 12 14 11 7 2 6 23 16
Step 1: To determine the quartiles, order the data values from smallest to largest:
2 3 4 6 7 8 11 12 14 15 16 20 23
Step 2: The number of data values is 13.
Step 3: Use the formula to determine the position for the median (Q2) of the data set.
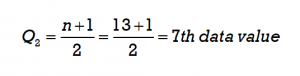
Count from left to right to determine the corresponding data value in the 7th position. The corresponding value is 11.
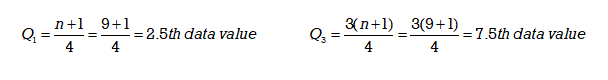
Step 4: Use the formula to determine the position for the first quartile (Q1) of the data set.
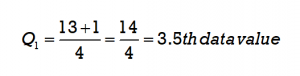
Since 3.5 is a fraction, the first quartile will be the average of the two data values that are in the 3rd and 4th positions. Count from left to right to determine the corresponding data values. The data value 4 is in the 3rd position and the data value 6 is in the 4th position so these will be averaged (4 + 6)/2 = 5. The first quartile will be 5.
Step 5: Use the formula to determine the position for the third quartile (Q3) of the data set.
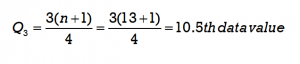
Since 10.5 is a fraction, the third quartile will be the average of the two data values that are in the 10th and 11th positions. Count from left to right to determine the corresponding data values. The data value 15 is in the 10th position and the data value 16 is in the 11th position so these will be averaged (15 + 16)/2 = 15.5. The third quartile will be 15.5.
Figure 3 illustrates the three quartiles, which divide the data set into four equal parts.
EXAMPLE 2
A shoe store wanted to determine the popularity of different shoe sizes for women’s tennis shoes. It planned to place its next order using this information. In a five day period it sold nine pairs of women’s tennis shoes in the following sizes: 7, 8, 11, 10, 7, 6, 9, 10, 7
Solution
Method 1:
To determine the quartiles:
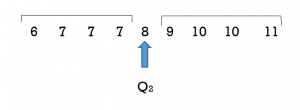
- Order the shoe sizes from smallest to largest: 6, 7, 7, 7, 8, 9, 10, 10, 11
- Count the number of values: n = 9
- Determine Q2, the median, which is the middle observation. Since there are nine data observations (shoe sizes) the median, or second quartile, will be the 5th data value. The 5th data value is 8.
4. Determine the first quartile Q1. It will be the middle observation of the lower half of data values. This will be the average of the 2nd and 3rd data values so (7 +7)/2 = 7.
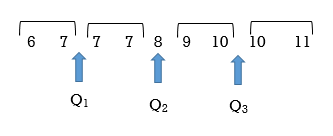
5. Determine the third quartile Q3. This will be the middle observation of the upper half. This will be the average of the 7th and 8th data values so (10+10)/2 = 10
Method 2:
The formulas can be used to determine the quartiles.
- Order the shoe sizes from smallest to largest: 6, 7, 7, 7, 8, 9, 10, 10, 11 .
- Determine the number of data values, n. n = 9
- Use the formula to determine the median. The median , or second quartile, can be determined as follows:
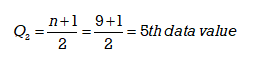
Counting from left to right, the 5th data value is 8. The median, or 2nd quartile Q2, is 8.
4 & 5. The first and third quartiles can be determined as follows:
The first quartile is the 2.5th data value. To determine the 2.5th data value we must take the average of the 2nd and 3rd data values. The 2nd data value is 7 and the 3rd data value is 7 so (7+7)/2 = 7.
The first quartile, Q1 = 7
The third quartile is the 7.5th data value. This will be the average of the 7th and 8th data values. The 7th data value is 10 and the 8th data value is also 10 so (10+10)/2 = 10.
The third quartile, Q3 = 10
We can see that Q2 = 8 splits the data set into two halves. Q1= 7 is the middle value of the lower half of the data set and Q3 = 10 is the middle value of the upper half of the data set.
In Example 2 the number of data items was odd. When n is odd the median or Q2 will be one of the data observations. When n is odd the formula for finding quartiles is straight forward.
TRY IT 2
Determine the quartiles for the following temperature data that was recorded over a 3-week period in May:
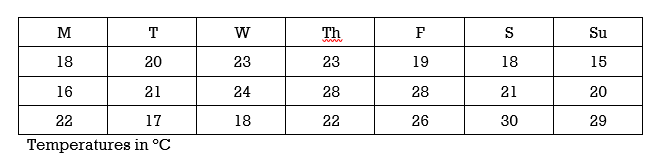
Show answer
Q2 = 21; Q1 = 18; Q3 = 25
It is important to note that a quartile may not be a data observation. When the number of data values n is even the median or Q2 will not be one of the actual data observations. As a result, when n is even an adjustment must be made to the value of n that is to be used in the formula to determine the first and third quartiles.
Method 1:
Consider the following data set:
1; 11.5; 6; 7.2; 4; 8; 9; 10; 6.8; 8.3; 2; 2; 10; 1
Step 1: To determine the quartiles, order the data values from smallest to largest:
1 1 2 2 4 6 6.8 7.2 8 8.3 9 10 10 11.5
Step 2: The number of data values is 14
Step 3: Determine the median, which measures the “centre” of the data. It is the number that separates ordered data into halves. Half the observations are the same number or smaller than the median, and half the observations are the same number or larger.
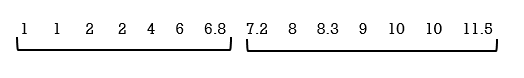
Since there are 14 observations, the median lies between the seventh observation, 6.8, and the eighth observation, 7.2. To find the median, add the two values together and divide by two. Median = (6.8 + 7.2)/2 = 7
The median, and therefore the 2nd quartile Q2 , is seven. It is important to note that the median is not actually one of the observed data values.
Step 4: The first quartile, Q1, is the middle value of the lower half of the data.
To determine the first quartile, Q1, consider the lower half of the data observations:
1 1 2 2 4 6 6.8.
Since there are seven observations, the middle observation will be the 4th item. The middle or 4th item of these data observations is 2.
Step 5: The third quartile, Q3, is the middle value of the upper half of the data.
To determine the third quartile, Q3, consider the upper half of the data observations:
7.2 8 8.3 9 10 10 11.5.
Since there are seven observations, the middle observation will be the 4th item in the upper half. The middle item of these data observations is 9.
Figure 4 illustrates the three quartiles, which divide the data set into four equal parts.
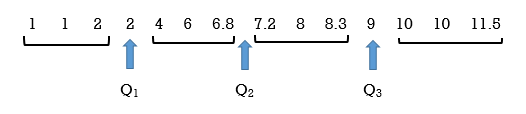
The number 2 is the first quartile, Q1. One-fourth of the entire set of observations lie below 2 and three-fourths of the data observations lie above 2.
The third quartile, Q3, is 9. Three-fourths (75%) of the ordered data set lie below 9. One-fourth (25%) of the ordered data set lie above 9.
Method 2:
Consider the following data set:
1; 11.5; 6; 7.2; 4; 8; 9; 10; 6.8; 8.3; 2; 2; 10; 1
Step 1: To determine the quartiles, order the data values from smallest to largest:
1 1 2 2 4 6 6.8 7.2 8 8.3 9 10 10 11.5
Step 2: The number of data values is 14 so n is an even number.
Step 3: Use the formula to determine the position of Q2, the median. The position will be (14 + 1)/2 = 7.5. This means that the median, or Q2, will be in the 7.5th observation or halfway between the 7th and 8th position. The observation 6.8 is in the 7th position and the observation 7.2 is in the 8th position therefore the average of these (6.8 + 7.2)/ 2 is the median or Q2.
Note that the median is not an actual observation in the data set. If we use the formula to find Q1 and Q3 then we must adjust “n” to include this additional item so in effect “n” will be 15. This is done only when determining the positions of Q1 and Q3 (and not for determining the position of Q2)
Step 4: Use the formula to determine the position of Q1, the first quartile. Remember than n will now be 15, not 14. The position will be (15 + 1)/4 = 4 th. This means that Q1 will be in the 4th position. Counting from the left, the data value 2 is in the 4th position so Q1= 2.
Step 5: Use the formula to determine the position of Q3, the third quartile. Remember than n will now be 15, not 14. The position will be 3(15 + 1)/4 = 12th. This means that Q3 will be in the 12th position. Refer to Figure 5. Counting from the left, we include the median value of 7, to determine that the data value in the 12th position. This value is 9 so Q3 will be 9.
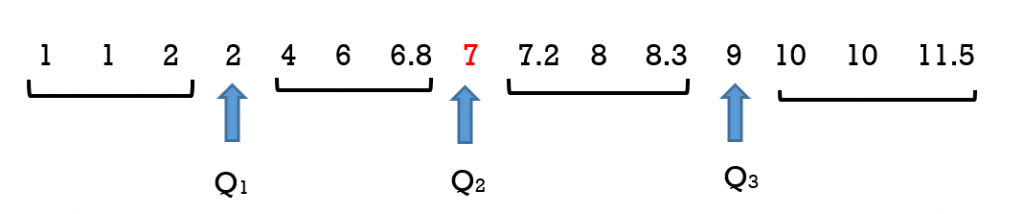
It is also important to recognize that the median of 7 is not an actual data value in this set. It was included in Figure 5 to illustrate that its position must be counted when determing the position of the third quartile. It is not actually part of the data set. The actual data set is illustrated in Figure 6 (and Figure 4).
Consider Figure 7 where the data set that has an even number of data values: 1 2 4 5
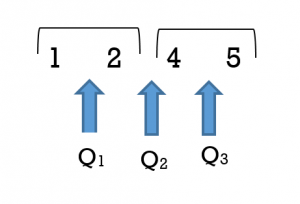
In this data set Q1 = 1.5, Q2 = 3, and Q3 = 4.5 This illustrates that quartile values need not be actual values in the data set. The second quartile Q2 is 3 which is the average of the data values 2 and 4. Similarily the first quartile of 1.5 is the average of two data values 1 and 2 and the third quartile of 4.5 is the average of the two data values 4 and 5. Determining the quartile values can become complex as it may require different weightings of the data values but this is beyond the scope of this textbook.
Example 3 illustrates two techniques for determining quartiles when the number of data observations is even.
EXAMPLE 3
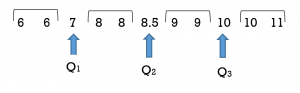
Consider again the shoe store and a different week. Over a five day period it sold ten pairs of tennis shoes in the following sizes:
6, 8, 11, 10, 7, 6, 9, 10, 8, 9
Note that there is an even number of data values n = 10
Solution
Method 1:
To determine the quartiles:
- Rank the sizes from smallest to largest: 6, 6, 7, 8, 8, 9, 9, 10, 10, 11 and divide the data set into four equal quarters.
- n = 10
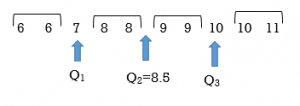
- Start with the median which is the middle observation. The median, or second quartile, will lie between the 5th and 6th data values. The 5th data value is 8 and the 6th data value is 9 so the average of 8 and 9, or 8.5, is the median.
- Determine the first quartile Q1. It will be the middle observation of the lower half of data values. This is the 3rd data value or the observation of 7.
- Determine the third quartile Q3. This will be the middle observation of the upper half. This will be the data observation of 10.
Note that each quartile divides the data values such that there are an equal number of data values in each of the four sections.
Method 2:
An alternative is to use the formulas to determine the quartiles.
To determine the quartiles:
- Rank the sizes from smallest to largest: 6, 6, 7, 8, 8, 9, 9, 10, 10, 11
- n = 10
- Determine the position of the median using the formula.
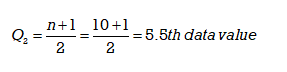
The 5.5th data value will be the average of the 5th and 6th data values. The 5th data value is 8 and the 6th data value is 9 so
(8 + 9) /2 = 8.5 The median or Q2 is 8.5.
Note: Q2 is not one of the actual data values. In this example Q2 is the 5.5th data value or 8.5. It is the data value that lies between the 5th and 6th data values but it is not one of the original data values.
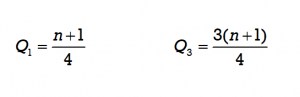
4 & 5. Determine the first quartile Q1 and the third quartile Q3.
Since the number of data values n is even the median or Q2 is not one of the actual data values so when we use the formula to determine Q1 and Q3 we must increase the value of n by 1. In effect the number of data values has increased by one and therefore the value of n in the formula must be increased by 1. This is done only when determining the positions of Q1 and Q3 (and not for determining the position of Q2)
In this example, when determining Q1 and Q3 the original value of n = 10 will now be increased by 1. The new number for n to be used in the formula will be n = 11. Using the formula, the first and third quartile positions can be determined as follows:
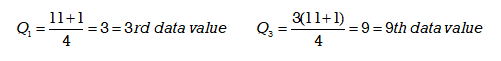
Using the results from the formula we count to get the 3rd and 9th data values. When determining these values be sure to include and count the position occupied by the new median value of 8.5. The 3rd data value is 7 and the 9th data value is 10.
Note that Method 1 and Method 2 yield the same results.
We have seen that either of Method 1 or Method 2 will produce the same quartile values although the formula method can be less intuitive when n is even.
TRY IT 3
Use either technique to determine the quartiles for the following temperature data that was recorded over the month of April:
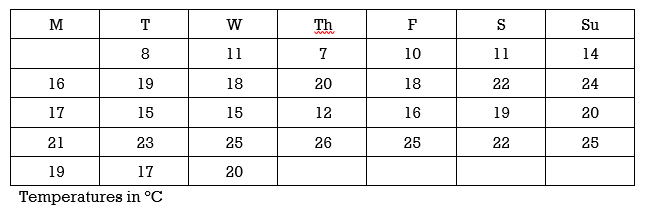
Show answer
Q2 = 18.5 Q1 = 15; Q3 = 22
EXAMPLE 4
Consider the data set: 3, 4, 5, 6, 7, 8, 8, 9, 10, 10, 11, 12, 13, 13, 14, 15. Determine the three quartiles using either technique.
Method 1:
Step 1: Order the data values 3, 4, 5, 6, 7, 8, 8, 9, 10, 10, 11, 12, 13, 13, 14, 15
Step 2: n = 16
Step 3: The median will be the average of 9 and 10, so 9.5. This is not one of the observed values.
Step 4: Q1 is the value that splits the lower half, which will be the average of 6 and 7, so 6.5.
Step 5: Q3 is the value that splits the upper half, which will be the average of 12 and 13, so 12.5.
Method 2:
Step 1: Order the data values 3, 4, 5, 6, 7, 8, 8, 9, 10, 10, 11, 12, 13, 13, 14, 15
Step 2: n = 16
Step 3: Use the formula (16 + 1) /2 = 8.5. The median will be in the 8.5th position. This is the average of the 8th value of 9 and the 9th value of 10 so the median is 9.5
Step 4 and 5: Since n is even, we will use a value of 17, not 16, in the formulas to determine Q1 and Q3.
Q1 will be (17 + 1)/4 = 4.5 th. This means that Q1 will be in the 4.5th position or the average of the 4th and 5th data values. The 4th value is 6 and the 5th value is 7 so Q1= 6.5.
Q3 will be 3(17 + 1)/4 = 13.5 th. This means that Q3 will be in the 13.5th position or the average of the 13th and 14th data values. Including the median’s position when we count, the 13th value is 12 and the 14th value is 13 so Q3 = (12 + 13)/2 = 12.5.
Note that these identical results were obtained without using the formulas. It is also important to recognize that the median of 9.5 is not an actual data value in this set. It serves only to divide the data set into two equal halves and it is not actually part of the data set.
TRY IT 4
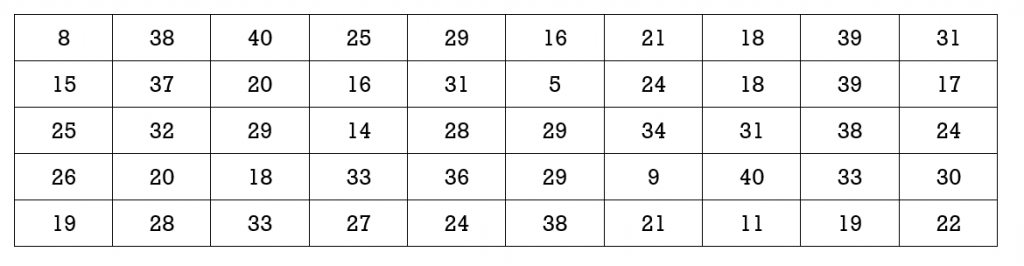
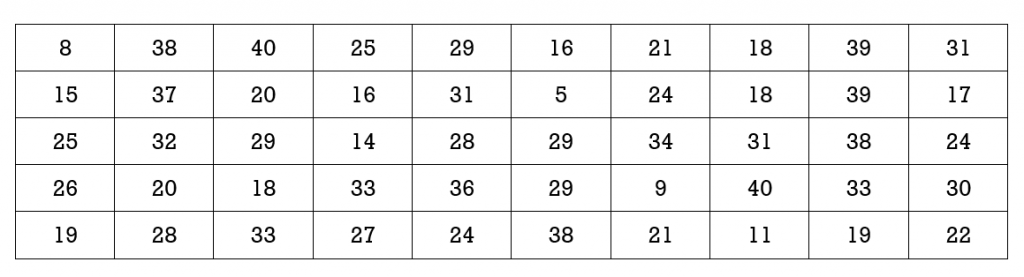
An athlete was training for a race and logged the following distances (in km) over a 36 day period. Determine the three quartiles for the distances covered by the athlete.
| 18 | 22 | 34 | 38 | 42 | 14 | 22 | 0 | 18 |
| 21 | 30 | 41 | 56 | 11 | 18 | 18 | 30 | 0 |
| 24 | 52 | 11 | 16 | 28 | 36 | 25 | 25 | 11 |
| 0 | 18 | 24 | 20 | 46 | 38 | 40 | 27 | 10 |
Show answer
Q1= 17, Q2 = 23, Q3= 35
Key Concepts
- A data set can be divided into one hundred equal parts by ninety-nine percentiles P1 , P2 , P3 , … P99 . Percentiles are best used with large sets of data.
- Quartiles divide the data set into four equal parts. The first quartile, Q1, is the same as the 25th percentile, and the third quartile, Q3, is the same as the 75th percentile. The median can be called both the second quartile, Q2 , and the 50th percentile.
- Quartiles may or may not be actual observations within a set of data.
Glossary
Percentiles
divide ordered data into hundredths.
Quartiles
divide ordered data into four equal parts.
8.1 Exercise Set
- Your instructor announces to the class that anyone with a midterm exam score of 63% scored in the 80th percentile. If you received a score of 63% how did you do in relation to your classmates?
- A test consists of 40 marks. Fifty students wrote the test and their scores are in the table below. Determine the percentiles that are associated with scores of:
-
- 15
- 25
- 37
-
- An employee at a large manufacturing company learns that their salary is in the 45th percentile. If the median salary at the company is $56,000/year can we conclude that this employee’s annual salary is more than $56,000?
- Your instructor announces to the class that the third quartile for the midterm exam was a score of 88%. If you received a score of 88% how did you do in relation to your classmates?
- A cell phone provider is trying to improve its service by reducing the amount of time that its help desk spends with each customer. It kept track of the average length of time (to the nearest minute) each of its 33 employees spent with customers.
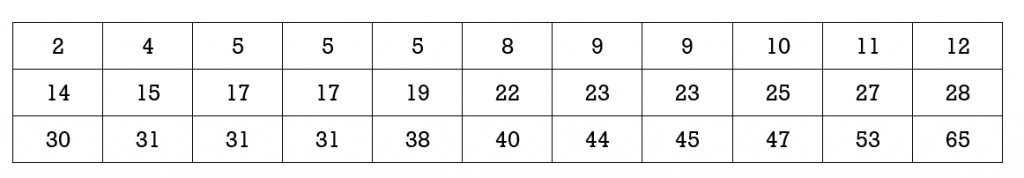
- Determine the mean, median and mode for average wait times.
- Determine the percentiles that correspond to help times of 14 minutes, 23 minutes and 47 minutes.
- Determine the 1st, 2nd and 3rd quartiles for average help times.
- A test consists of 40 marks. Fifty students wrote the test and their scores are as recorded. Determine the 1st, 2nd and 3rd quartiles.
- Which of the following must be an actual data value: mean, median, mode, first quartile, third quartile?
- At a restaurant one evening the customers were asked to rate the service they received. Scores could range from 1 to 10. The following thirty responses (scores) were provided:1 1 1 2 2 2 3 3 3 4 4 4 5 5 5 6 6 6 7 7 7 8 8 8 9 9 9 10 10 10
-
- Determine the percentiles that correspond to scores of 2 and 5. Explain what this means.
- Determine the first, second and third quartiles.
-
- At a restaurant one evening the customers were asked to rate the service they received. Scores could range from 1 to 10. The following twenty-nine responses (scores) were provided:
1 1 1 2 2 3 3 3 4 4 4 5 5 5 6 6 6 7 7 8 8 8 8 8 9 9 10 10 10-
- Determine the mean, median and mode.
- Determine the first, second and third quartiles.
-
Answers
- If your score is 63% and this is in the 80th percentile this means that 80% of your classmates received scores lower than or equal to 63%
- A score of 15 is in the10th percentile.
- A score of 25 is in the 44th percentile.
- A score of 37 is in the 84th percentile.
- We can conclude that the employee’s salary is not more than $56,000/year because the median salary is also the 50th percentile. If the employee’s salary is in the 45th percentile they cannot be earning more than the median.
- You scored better than three quarters of your class mates.
-
- The mean is 765/33 = 23.18; the median is 22; and there are two modes 5 and 31.
- A help time of 14 minutes is in the 33rd percentile; 23 minutes is in the 52nd percentile; 47 minutes is in the 91st perecntile
- Q1 = 9.5 min.; Q2 = 22 min. ; Q3 = 31 min.
-
- Q1 = 19; Q2 = 26.5; Q3 = 33
- The mode must be an actual data value
-
- A score of 2 is the 10th percentile. This means that 10% of the scores were less than a score of 2. A score of 5 is the 40th percentile. This means that 40% of the scores were less than a score of 5.
- The first quartile is 3, the second quartile is 5.5, the third quartile is 8
-
- mean 5.6; median 6; mode 8
- Q1 is 3; Q2 is 6; Q3 is 8
-
Attribution
Some content in this chapter has been adapted from “Measures of the Location of the Data” in Introductory Statistics (OpenStax) by Daniel Birmajer, Bryan Blount, Sheri Boyd, Matthew Einsohn, James Helmreich, Lynette Kenyon, Sheldon Lee, and Jeff Taub, which is under a CC BY 4.0 Licence. Adapted by Kim Moshenko. See the Copyright page for more information.
