8 Data Analysis 2
8.2 Measures of Dispersion

Learning Objectives
By the end of this section the student should be able to:
- Determine the range for a data set.
- Determine the standard deviation for a data set.
- Determine the standard deviation from a histogram
Measures of Dispersion or Spread
We have seen that measures of central tendency, including the mean and median, are used to identify a central position within a data set. They indicate where the data clusters.
Consider student A’s scores on five tests: 32% 95% 89% 74% 55% The mean, or average, is (32 + 95 + 89 + 74 + 55)/5 = 69% and the median is 74%.
Consider student B’s scores on the same five tests: 68% 69% 72% 74% 62% The mean, or average, is (68 + 69 + 72 + 74 + 62)/5 = 69% and the median is 69%.
Both student’s have the same test average of 69% but there is a substantial difference in the spread or dispersion of their scores. Student A’s test scores range from a low score of 32% to a high score of 95% so the spread in marks is 63 percentage points. Student B’s test scores range from a low score of 62% to a high score of 74% so the spread in marks is 12 percentage points.
When we analyze data it is important to consider how dispersed or spread out the data values are. In this section we will consider two measures of dispersion.
Range
Range is one measure of dispersion. A measure of dispersion is used to describe the spread of data.
Range
The range indicates the total spread in data values. It is the difference between the highest and lowest data values.
Range = highest data value – lowest data value
EXAMPLE 1
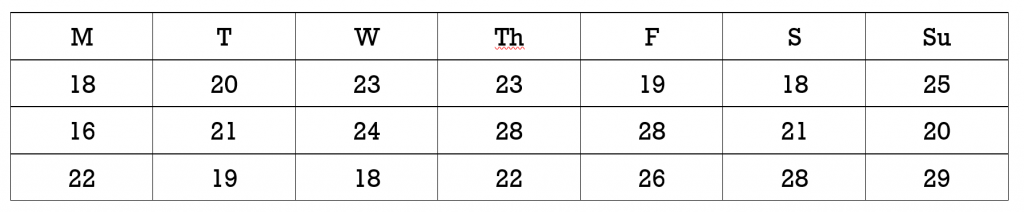
The table shows the daily high temperature (°C) over a three week period.
Determine the highest temperature, lowest temperature, and the range in daily high temperatures over the three weeks.
Solution
The highest temperature was 29º, the lowest temperature was 16°, and the range in temperatures was 29 – 16 = 13º.
TRY IT 1
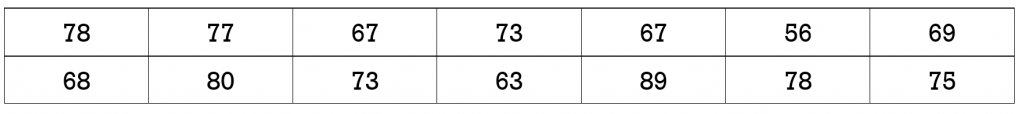
The table shows the test score for a group of fourteen students.
Determine the highest test score, the lowest test score, and the range in test scores for the group of 14 students.
Show answer
The highest score was 89%, the lowest score was 56%, and the range in scores was 33%.
An advantage of using the range as a measure of dispersion is that it involves a simple calculation. A disadvantage is that the range only provides a measure between the highest and lowest values so it disregards all other data values. If the highest or lowest data value is an outlier then the range will not provide a true measure of the spread in the typical values.
EXAMPLE 2
A student wrote five tests and earned the following five scores:
92% 95% 89% 94% 35%
- Determine the mean, median and the range for these five scores.
- Which of the five scores is an outlier?
- Remove the outlier and recalculate the mean, median and the range for the four remaining scores.
- Comparing the results for the five scores versus four scores, which of the three measures was least impacted by the outlier?
- Comparing the results for the five scores versus four scores, which of the three measures was most impacted by the outlier?
Solution
1. The student’s mean score: (92 + 95 + 89 + 94 + 35) / 5 = 81%
The median score is 92%.
The range in marks is 95% – 35% = 60%.
2. The score of 35% is an outlier.
3. The student’s mean score: (92 + 95 + 89 + 94) / 4 = 92.5%
The median score is 93%.
The range in marks is 95% – 89% = 6%.
4. The median was least impacted by the removal of the outlier.
5. The range was most impacted by the outlier.
TRY IT 2
The following seven values are salaries at a local computer company.
$62,000 $95, 000 $120,000 $101, 000 $99,000 $98,000 $110,000
- Determine the mean, median and the range for these seven salaries.
- Which of the seven salaries is an outlier?
- Remove the outlier and recalculate the mean, median and the range for the six remaining salaries.
- Comparing the results for the seven versus six salaries, which of the three measures was least impacted by the outlier?
- Comparing the results for the seven versus six salaries, which of the three measures was most impacted by the outlier?
Show answer
- mean salary $97,857; median salary $99,000; range in salaries $58,000
- $62,000
- mean salary $103, 833; median salary $100,000; range in salaries $25,000
- the median
- the range
Refer back to Example 2 and the measures that were calculated for five test scores.The student’s mean score is 81% and the range in marks is 60%. The range of 60% does not capture the fact that if the outlier is removed then there is a spread of only 6% for the four remaining data values. The range depends on only the highest and lowest data values. The existence of an outlier can result in a misleading representation of the spread in data values.
An alternative measure of dispersion is called the standard deviation. It depends on all data values rather than on only the highest and lowest data values.
Standard Deviation
Standard deviation measures the dispersion of the data values around the mean. Unlike the range, its value depends on every data value in the data set. The standard deviation is found by determining how much each data value differs from the mean.
What does the standard deviation actually tell us? Consider two sets of test scores:
Set A: 76% 74% 86% 84% 85%
Set B: 53% 95% 62% 99% 96%
Refer to Figure 1. For both sets the mean is 81%. If we plot the scores (indicated by the *) on a scale of 0% to 100% we see that the scores in Set A are much less spread out around the mean. The scores from Set B are much more dispersed.

If we compare the standard deviations for the two data sets we should find that although the mean is the same, the standard deviation for Set B will be greater since the data is more widely spread out from the mean.
Population versus Sample Standard Deviation
When working with standard deviation it is important to distinguish whether you are working with the entire population or a sample of the population. Statisticians generally survey a sample of the population because it is often impossible to survey the entire population. As an example, assume your university wants to determine food preferences for its entire student body. The population would be all students enrolled in the university. Rather than attempt to survey every student, the university will survey only a sample.
The symbolic representation of standard deviation is different for a population versus a sample. If you are working with an entire population, the symbol for standard deviation is the Greek letter sigma, σ. The symbol for the standard deviation of a sample is s. Similarly, the calculation of standard deviation is different for a population versus a sample. Unless otherwise indicated in this chapter, we will assume that we are working with a sample, rather than an entire population.
Standard Deviation Formula
Standard Deviation Formula for a Population
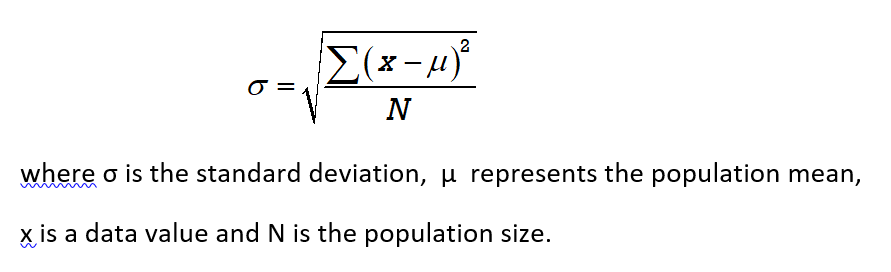
The Greek letter sigma ∑ is the summation symbol. It indicates that all of the values (x – μ)2 must be added.
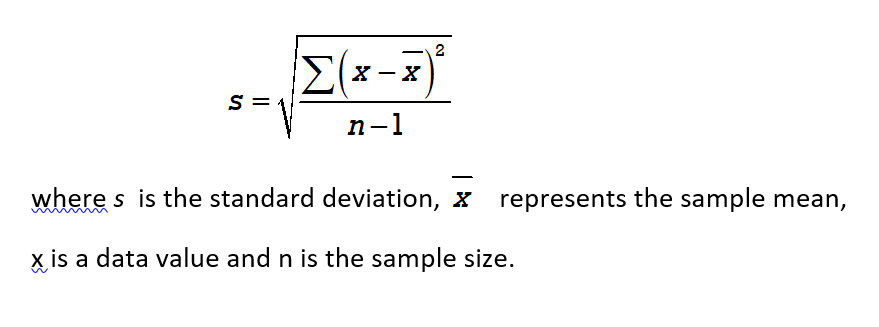
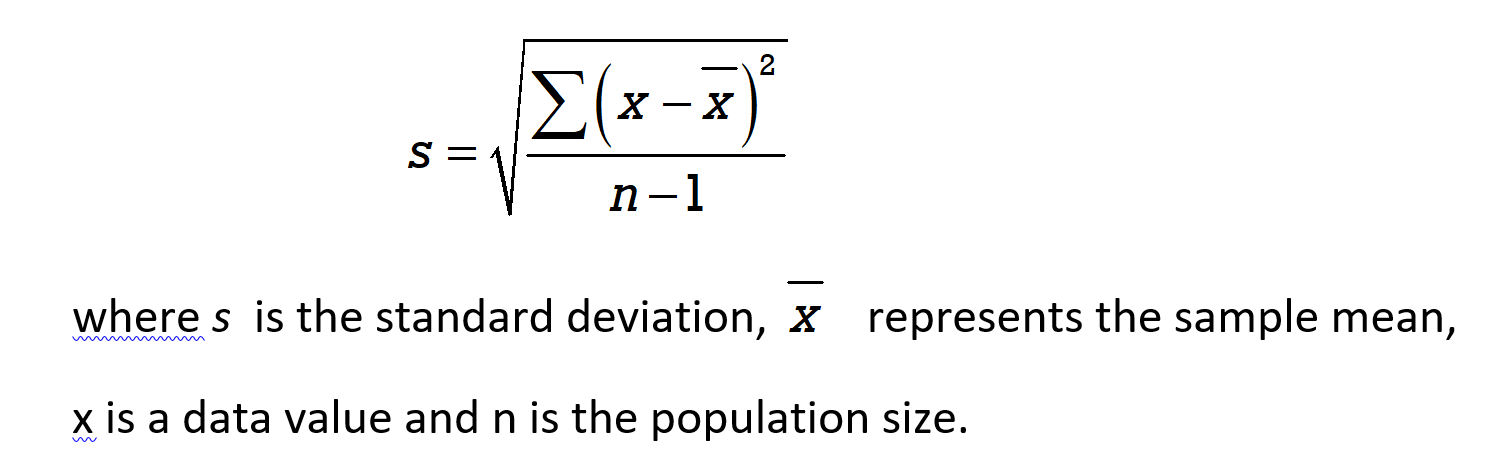
Standard Deviation Formula for a Sample
Calculating the Standard Deviation
When calculating the standard deviation with the aid of a scientific calculator it is helpful to record the steps using a table.
Calculating Standard Deviation
We will use the formula for finding the standard deviation of a sample:
To determine the standard deviation for a sample we will use the following steps :
- Find the mean
- Create a table with three columns: data value, data value – mean, (data value – mean)2
- Fill in the data value column with all values from the sample
- Subtract the mean from each data value: (data value – mean)
- Square the results from step 4: (data value – mean)2
- Sum the results in column 3 (from step 5)
- Divide the sum (from step 6) by (n – 1)
- Find the square root of the result in step 7
EXAMPLE 3
a) Determine the standard deviation for the sample set A test scores: 76% 74% 86% 84% 85%
b) Determine the standard deviation for the sample set B test scores: 53% 95% 62% 99% 96%
c) Compare the means and standard deviations for Set A and Set B. Which set is more spread out (dispersed)?
Solution
a)
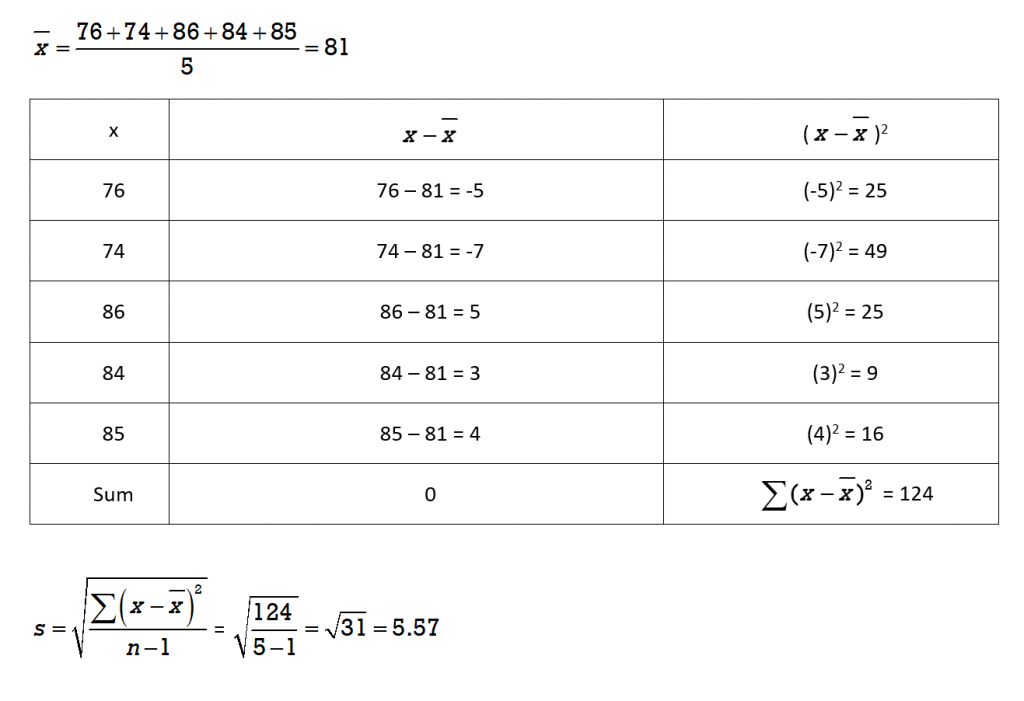
The standard deviation for Set A is 5.57 (rounded to 2 decimal places)
b)
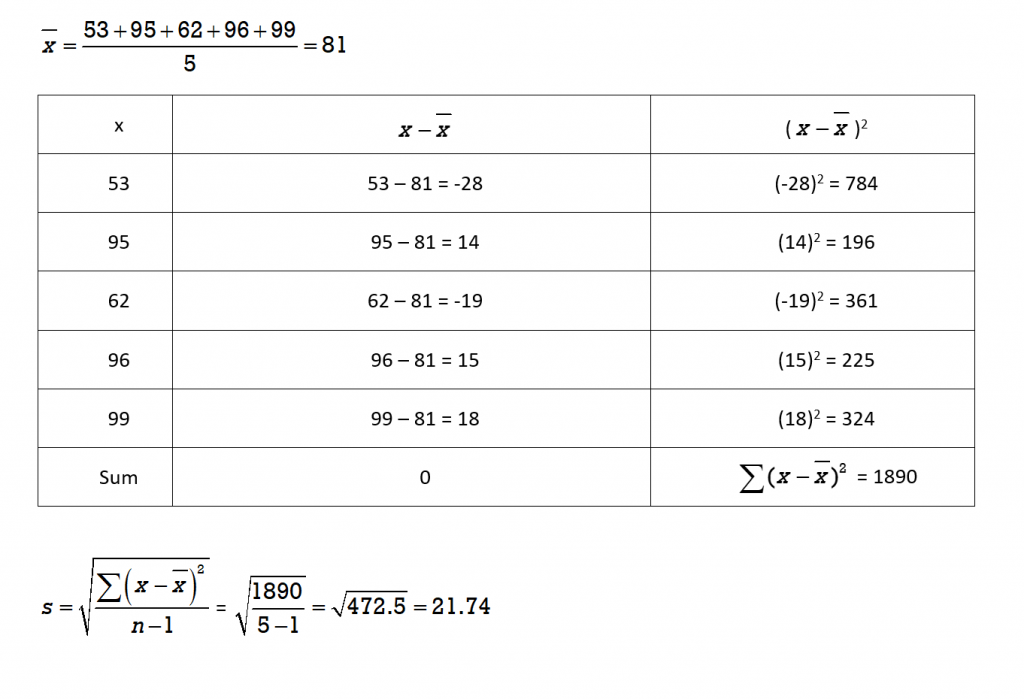
The standard deviation for Set B is 21.74 (rounded to 2 decimal places).
c)
In comparing the two data sets A and B:
- The means are the same value of 81.
- The standard deviation for Set A is s = 5.57 and for Set B it is s = 21.74. The much larger standard deviation for Set B indicates that there is a much greater spread in the data values around the mean of 81%.
Note that the sum of the middle column (data value – mean) is 0. This will always be the case. That is why we must square the values before we add them, as is done in column 3.
TRY IT 3
The average high temperatures (in ºC) for one week in April for two different cities in Canada were as follows:
City A: 15 19 22 26 21 19 18
City B: 6 9 15 18 20 19 21
a) Calculate the mean high temperature (if necessary round to 2 decimal places) for each city. Which of the two cities appears to have a wider spread in temperatures around their means?
b) Calculate the standard deviation for each temperature set (if necessary round to 2 decimal places) to see if your observation is correct.
Show answer
The mean for City A is 20 ˚C and the mean for City B was 15.43˚C.
The standard deviation for City A is 3.46 and for City B is 5.80. City B’s temperatures are more widely spread out from the mean temperature.
We have seen that two measures of spread or dispersion are the range and the standard deviation. Although the range is a much simpler calculation, it only takes into consideration the highest and lowest data values. The existence of an outlier can result in a range that is not truly indicative of the spread in data values. The standard deviation is a more complex calculation but takes into consideration all data values. It is important to note that technology is often used to calculate the standard deviation which eliminates the need for tedious calculations.
EXAMPLE 4
In Example 1 the range for the following set of temperature was determined to be 13 ºC.
a) Determine the mean and the standard deviation.
b) Explain why the values for the range and standard deviation are different.
Solution
a) The mean (average) is 22.29 ˚C and the standard deviation is 3.86.
b) The reason for the difference in values is that the range only tells us the difference between the highest and lowest temperature whereas the standard deviation tells us how widespread the temperatures are in relation to the mean temperature of 22.29 ˚C
TRY IT 4
Refer back to TRY IT 1 and the test scores for a group of 14 students. The range was determined to be 33.
Determine the mean (rounded to the nearest whole number) and the standard deviation (rounded to the nearest 2 decimal places) for this set of test scores.
Show answer
The mean is 72 and the standard deviation is 8.19.
Histograms and the Dispersion of Data Values
We have seen that for two data sets with the same mean, when the standard deviation is larger the data values are more spread out. A histogram can be used to illustrate the spread of data values.
Consider a dance competition where teams comprised of seven dancers compete for the prize money in several different dance categories. There were four teams entered in the elite category. The dancers must be between the ages of 18-24 years old. The age breakdown for the members of the four teams in the elite category is:
Team Unity: all seven dancers are age 21
Team Harmony: 2 dancers are 20, 3 dancers are 21 and 2 dancers are 22
Team Mix: 1 dancer is 19, 2 dancers are 20, 1 dancer is 21, 2 dancers are 22 and 1 dancer is 23
Team Extend: 3 dancers are 18, 1 dancer is 21, and 3 dancers are 24
The mean age for all four teams is 21 but the standard deviations for each of the four teams are different. Team Unity has a standard deviation of 0, Team Harmony has a standard deviation of 0.82, Team Mix has a standard deviation of 1.412 and Team Extend has a standard deviation of 3.
The histograms for each of the teams appears in Figures 2a through Figures 2d below.
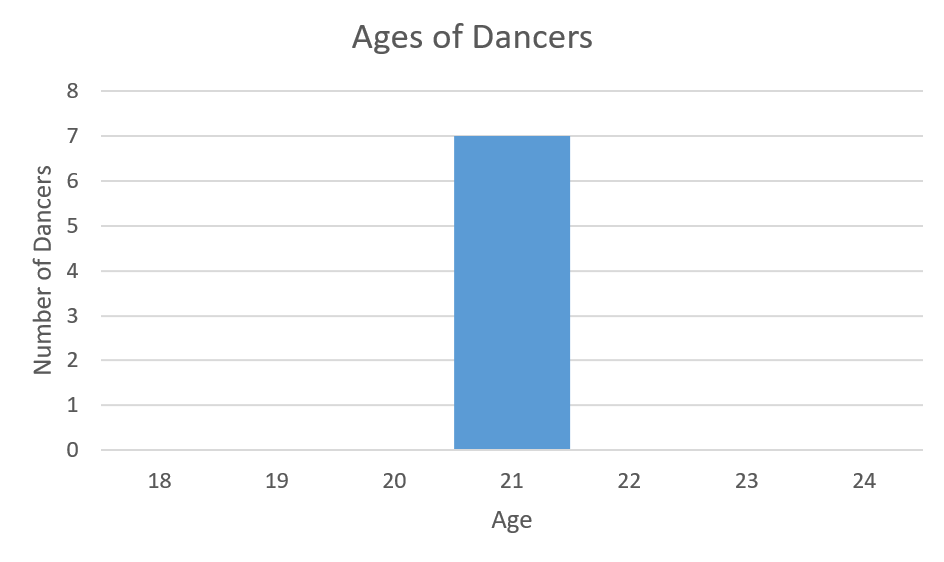
In Figure 2a Team Unity has a standard deviation of 0 since all ages are the same. None of the ages spread out from the mean of 21.
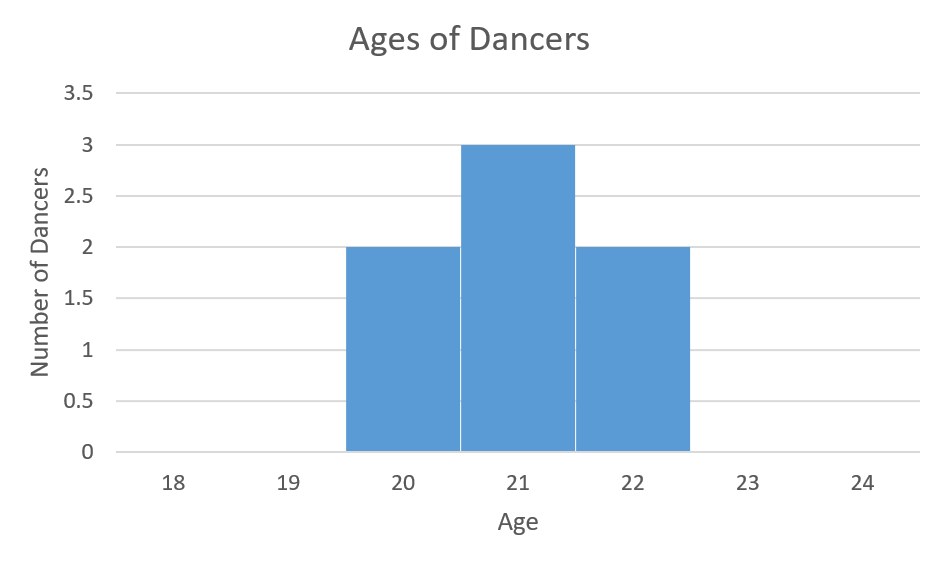
In Figure 2b Team Harmony has a standard deviation of 0.82 years. The histogram illustrates that the ages are closely clustered around the mean of 21.
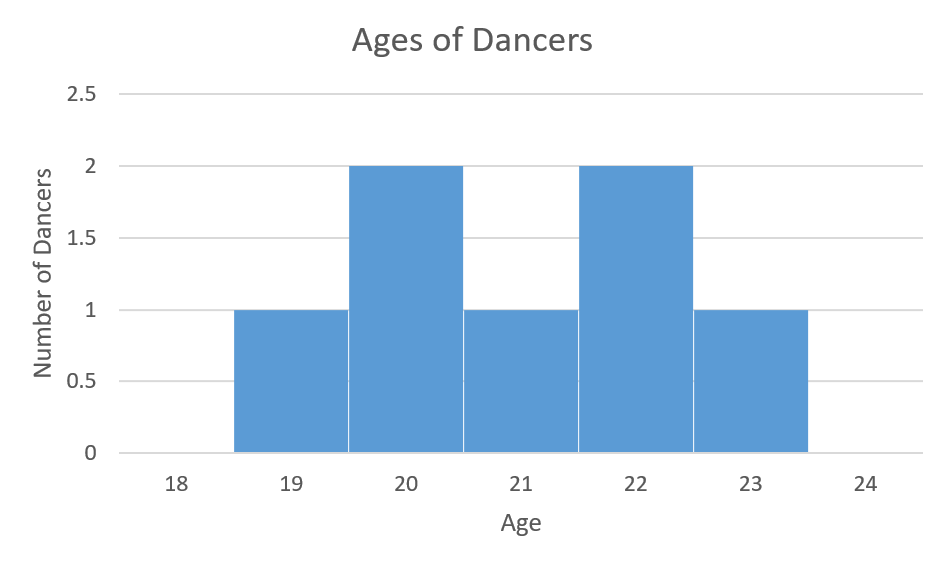
In Figure 2c Team Mix has a standard deviation of 1.41. The histogram illustrates that the data (age) spread is greater than for Team Unity and Team Harmony.
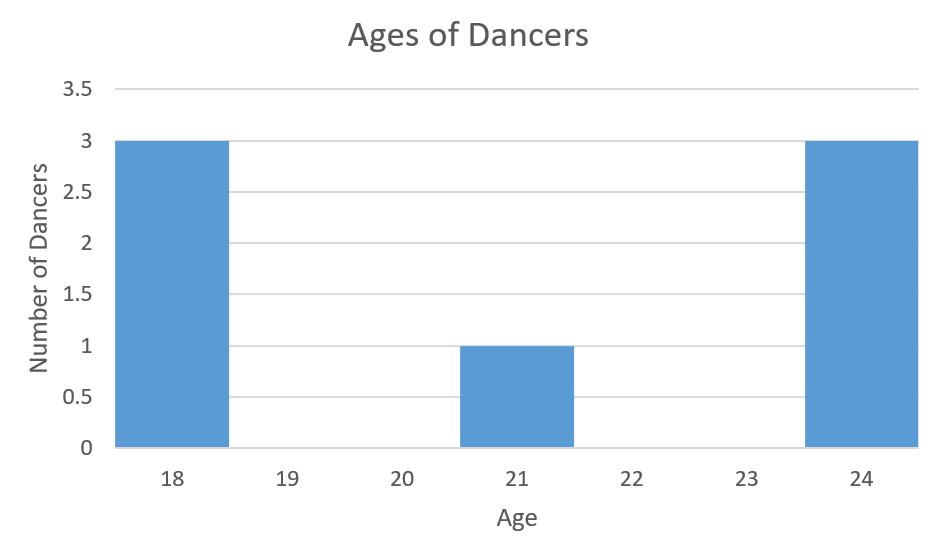
In Figure 2d Team Extend has a standard deviation of 3. The histogram clearly illustrates that the ages for this team are the most spread out from the mean of 21.
EXAMPLE 5
Ten participants in a group fitness class were asked to rank the class on a scale from 1 to 5. Determine the mean and standard deviation for the evaluation scores as depicted in the histogram below.

Solution

The mean score is 3 and the standard deviation is 1.49
TRY IT 5
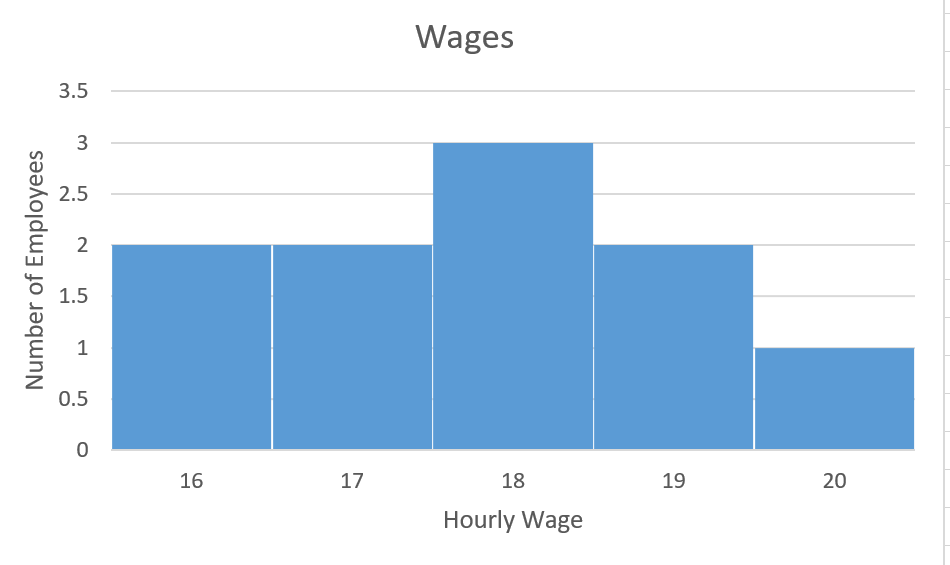
The hourly wages for ten employees at a small coffee shop are illustrated in the histogram. Determine the mean and standard deviation for the employee hourly wages.
Show answer
The mean is $17.80 and the standard deviation is $1.32
We have seen that standard deviation provides us with a measure of the spread of data values in relation to the mean. We have learned how to calculate the standard deviation for a data set but we have not explored the significance or meaning of these calculated values. In the next section we will explore the significance of the calculated values as we consider the relationship between the standard deviation and the distribution of the data values.
Key Concepts
- Two measures of dispersion or spread in data values are:
- Range = highest data value – lowest data value
- Standard deviation. Unlike the range, its value depends on every data value in the data set. It is found by determining how much each data value differs from the mean.
Glossary
histogram
represents the frequency distribution (number of occurrences) of each data value. The data values are grouped into intervals or “bins”.
outlier
A data observation that is deemed to be unusual based on the pattern of the other data values.
range
indicates the total spread in data values. It is the difference between the highest and lowest data values.
sigma
is the uppercase Greek letter written ∑. It is used to indicate the sum of a series of values.
standard deviation
measures the dispersion of the data values around the mean.
8.2 Exercise Set
- The daily high temperature (in degrees C) for Calgary AB was recorded over a period of two weeks:
28 25 26 27 27 29 30 30 12 20 22 25 24 25 - Determine the mean, median and the range for these fourteen temperatures.
- Which of the temperatures appears to be an outlier?
- Remove the outlier and recalculate the mean, median and the range for the thirteen remaining values.
- Comparing the results for the fourteen temperature values versus thirteen temperature values, which of the three measures was most impacted by the outlier?
- The population of Cache Creek, B.C. for the years 2011 to 2019 is provided in the table below (Demographic Analysis Section, BC Stats)
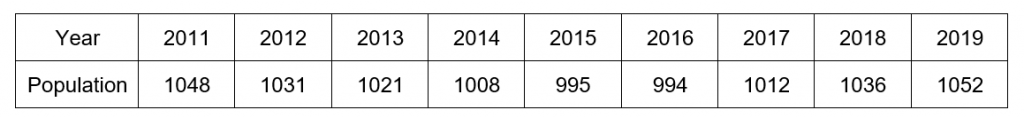
- Determine the mean and median population.
- Determine the range.
- Determine the standard deviation.
- Set A: 6 7 7 10 10 11Set B: 10 11 12 13 14 15Set C: 10 12 16 11 12 13
- For each of the three data samples below, calculate the range, mean, and standard deviation.
- Based on these calculations, determine any similarities that exist between any of the data samples.
- Which of the three measures is different for every set?
- Given the two data samples Set A and Set B below, which appears to have the greatest spread in values?
- Set A: 69 86 74 60 67 65
- Set B: 50 51 86 50 52 51
- For each sample calculate the mean, range and standard deviation. If necessary round final answers to 2 decimal places.
- Based on these calculations which sample has the larger standard deviation?
- If the 86 in each data set is changed to a 56 which set would you predict would have the greatest change in standard deviation? Recalculate the standard deviations with a value of 56 instead of 86. Is your prediction correct?
- Set A: 69 56 74 60 67 65
- Set B: 50 51 56 50 52 51
- The standard deviation for a sample is calculated to be 0. What can you conclude about the data values?
- The maximum hourly wage (in dollars/hour) for pipefitters and carpenters in the ten Canadian provinces is listed below.(Source: Wages for Steamfitters, pipefitters and sprinkler system installers from the Canadian Job Bank)
- Pipefitter: 48 47 45 45 40 48 42 50 46 43
- Carpenter: 36 33 25 28 39 36 33 35 39 35
- Without calculating the average, which occupation appears to have the higher average maximum hourly wage?
- Calculate the average (mean) maximum hourly wage (to the nearest cent) for each occupation.
- Determine the range in maximum hourly wages for each occupation. Which occupation has a greater range in hourly wages?
- Calculate the standard deviation (to the nearest cent) for each occupation. Which occupation has a maximum hourly wage that is more spread out?
- Revisit question #1. The daily high temperature (in degrees C) for Calgary AB was recorded over a period of two weeks:
28 25 26 27 27 29 30 30 12 20 22 25 24 25 - Calculate the standard deviation for the fourteen temperature values.
- Remove the outlier and recalculate the standard deviation for the thirteen temperature values. How has the standard deviation changed with the removal of the outlier?
- Two histograms are provided below:
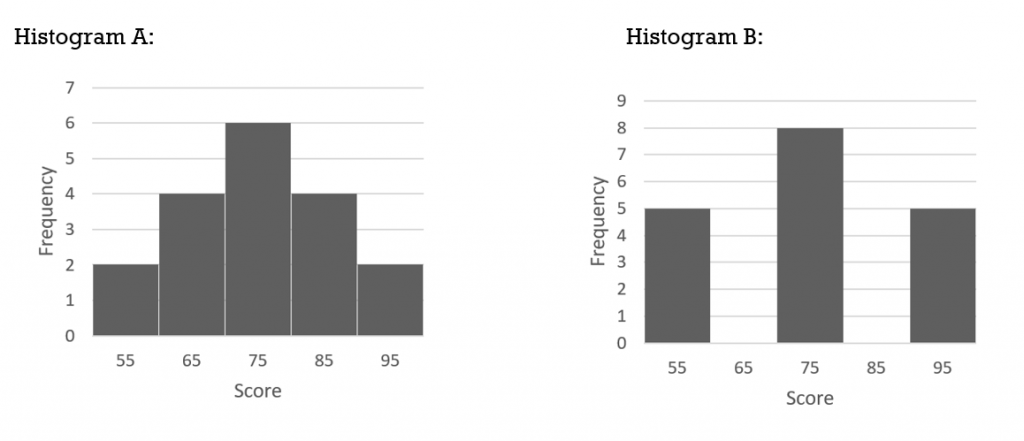
- For each histogram determine the range, mean, and standard deviation.
- Considering only the means and ranges, what can you conclude about the spread or dispersion of the data values for each set?
- Considering only the means and standard deviations, what can you conclude about the spread or dispersion of the data values for each set?
Answers
-
- mean 25; median 25.5, range 18
- outlier is 12
- mean 26; median 26, range 10
- The range was most impacted by the removal of the outlier.
- mean is 1022; median is 1021
- 58
- standard deviation = 21.40
- Set A: range is 5; mean is 8.5; standard deviation is 2.07Set B: range is 5; mean is 12.5; standard deviation is 1.87Set C: range is 6; mean is 12.33; standard deviation is 2.07
- Set A and Set B have identical ranges but different means and standard deviations.Set A and Set C have the same standard deviation but different ranges.
- Each set has a different mean.
- Answers may vary. Set A scores appear to be more spread out; aside from one score of 86, the scores in Set B are less spread out.
- Set A: range is 26; mean is 70.17; standard deviation is 9.02Set B: range is 36; mean is 56.67; standard deviation is 14.39
- Set B has a larger standard deviation.
- Predictions will vary. For Set A the new standard deviation is 6.43 (compared to 9.02); Set B has a new standard deviation of 2.25 (compared to 14.39) so set B had the greatest change in standard deviation.
- All data values are equal.
- pipefitter
- pipefitter ‘s top hourly wage on average is $45.40/hour; carpenter’s top hourly wage on average is $33.90/hour
- pipefitter range of $10/hour for the 10 provincescarpenter range of $14/hour for the 10 provincesThe carpenter has a greater range in wages
- pipefitter has a standard deviation of $3.06 and the carpenter has a standard deviation of $4.46. The carpenter has a higher standard deviation and therefore the carpenter’s hourly wage is more spread out.
- Standard deviation is 4.71
- Standard deviation is 2.97; With the removal of the outlier this value has become smaller
- Histogram A: range is 40, mean is 75, standard deviation is 11.88Histogram B: range is 40, mean is 75, standard deviation is 15.34
- Considering only the means and ranges, these are both identical so it would appear that the data values are equally dispersed.
- Histogram B has a greater dispersion of data as indicated by the larger standard deviation.
