4. Systems of Equations
4.5 Graphing Systems of Linear Inequalities
Lynn Marecek and MaryAnne Anthony-Smith
Learning Objectives
By the end of this section it is expected that you will be able to:
- Determine whether an ordered pair is a solution of a system of linear inequalities
- Solve a system of linear inequalities by graphing
- Solve applications of systems of inequalities
Determine Whether an Ordered Pair is a Solution of a System of Linear Inequalities
The definition of a system of linear inequalities is very similar to the definition of a system of linear equations.
System of Linear Inequalities
Two or more linear inequalities grouped together form a system of linear inequalities.
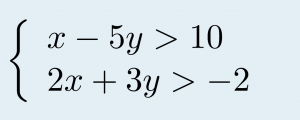
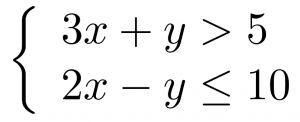
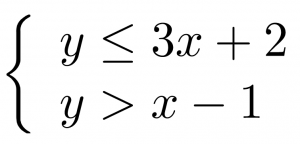
A system of linear inequalities looks like a system of linear equations, but it has inequalities instead of equations. A system of two linear inequalities is shown below.

To solve a system of linear inequalities, we will find values of the variables that are solutions to both inequalities. We solve the system by using the graphs of each inequality and show the solution as a graph. We will find the region on the plane that contains all ordered pairs  that make both inequalities true.
Solutions of a System of Linear Inequalities
Solutions of a system of linear inequalities are the values of the variables that make all the inequalities true.
The solution of a system of linear inequalities is shown as a shaded region in the x-y coordinate system that includes all the points whose ordered pairs make the inequalities true.
To determine if an ordered pair is a solution to a system of two inequalities, we substitute the values of the variables into each inequality. If the ordered pair makes both inequalities true, it is a solution to the system.
EXAMPLE 1
Determine whether the ordered pair is a solution to the system.
a) (−2, 4) b) (3,1)
a) Is the ordered pair (−2, 4) a solution?
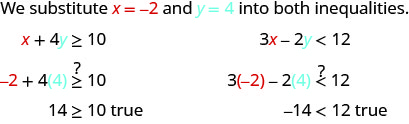
The ordered pair (−2, 4) made both inequalities true. Therefore (−2, 4) is a solution to this system.
b) Is the ordered pair (3,1) a solution?
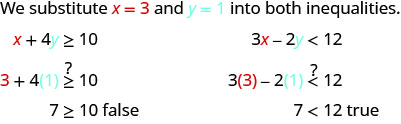
The ordered pair (3,1) made one inequality true, but the other one false. Therefore (3,1) is not a solution to this system.
TRY IT 1
Determine whether the ordered pair is a solution to the system.
a)  b)
b) 
Show answer
a) no b) yes
Solve a System of Linear Inequalities by Graphing
The solution to a single linear inequality is the region on one side of the boundary line that contains all the points that make the inequality true. The solution to a system of two linear inequalities is a region that contains the solutions to both inequalities. To find this region, we will graph each inequality separately and then locate the region where they are both true. The solution is always shown as a graph.
EXAMPLE 2
Solve the system by graphing.


TRY IT 2
Solve the system by graphing. 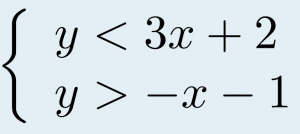
Show answer
Solve a system of linear inequalities by graphing.
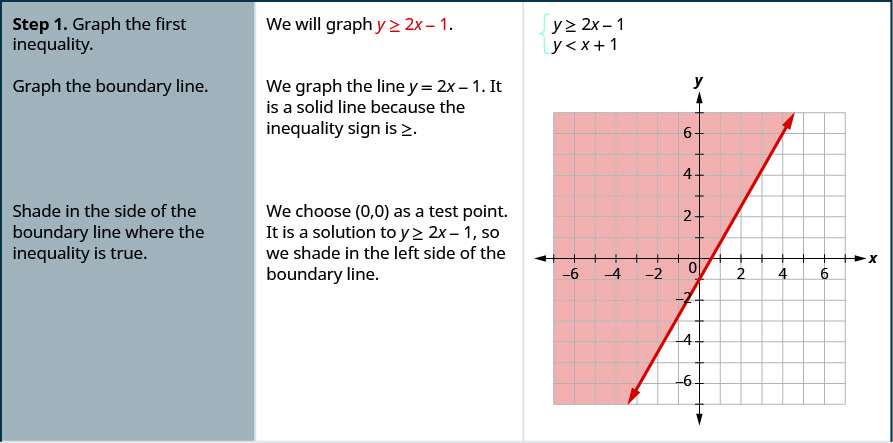
- Graph the first inequality.
- Graph the boundary line.
- Shade in the side of the boundary line where the inequality is true.
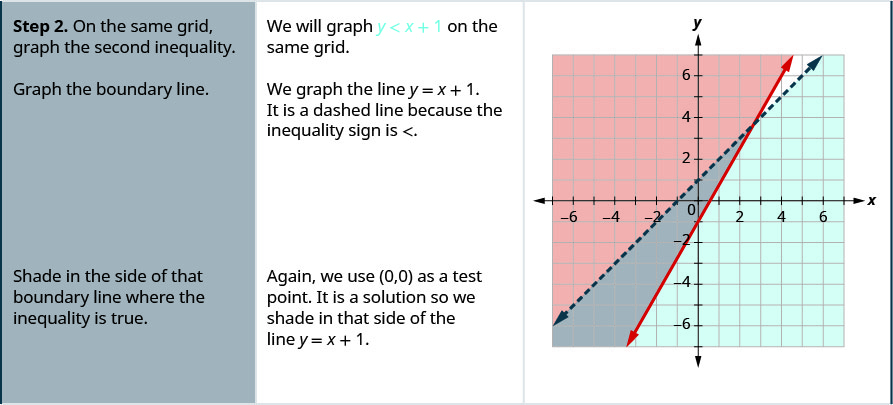
- On the same grid, graph the second inequality.
- Graph the boundary line.
- Shade in the side of that boundary line where the inequality is true.
- The solution is the region where the shading overlaps.
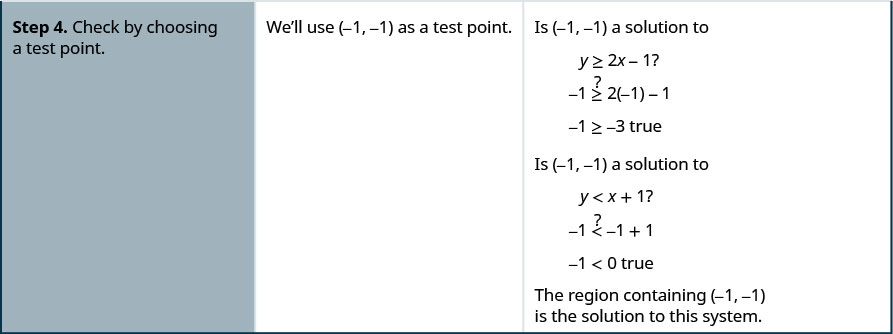
- Check by choosing a test point.
EXAMPLE 3
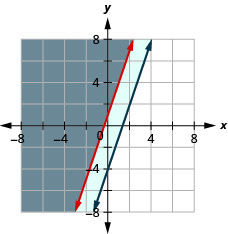
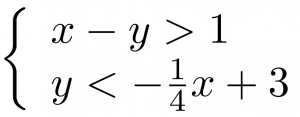
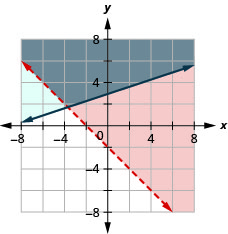
Solve the system by graphing. 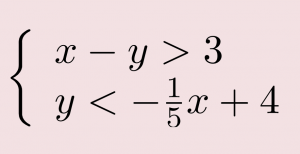
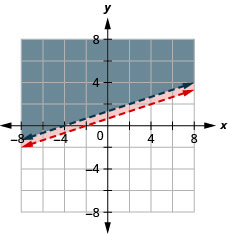
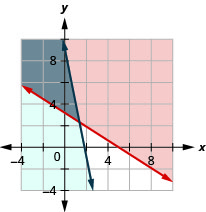
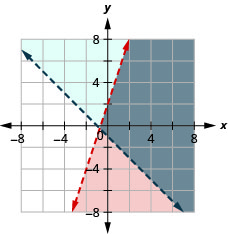
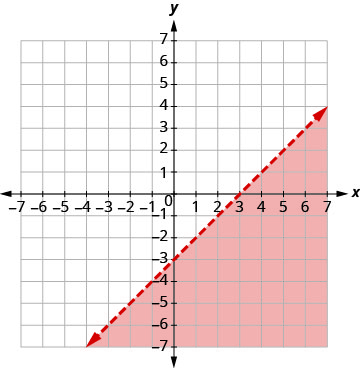
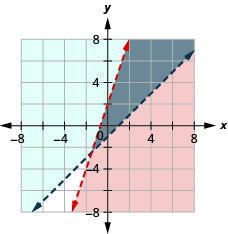
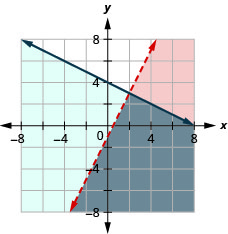
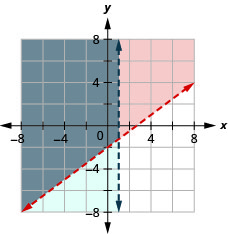
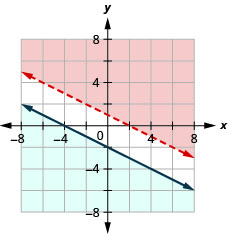
| Graph x − y > 3, by graphing x − y = 3 and testing a point. The intercepts are x = 3 and y = −3 and the boundary line will be dashed. Test (0, 0). It makes the inequality false. So, shade the side that does not contain (0, 0) red. |
|
Graph  by graphing by graphing  using the slope  and y−intercept and y−interceptb = 4. The boundary line will be dashed. Test (0, 0). It makes the inequality true, so shade the side that contains (0, 0) blue. Choose a test point in the solution and verify that it is a solution to both inequalities. |
 |
The point of intersection of the two lines is not included as both boundary lines were dashed. The solution is the area shaded twice which is the darker-shaded region.
TRY IT 3
Solve the system by graphing. 
Show answer
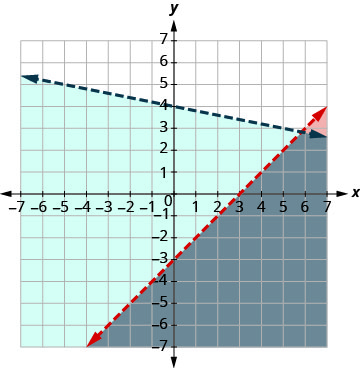
EXAMPLE 4
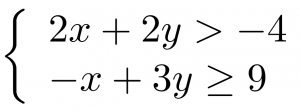
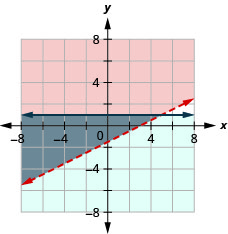
Solve the system by graphing. 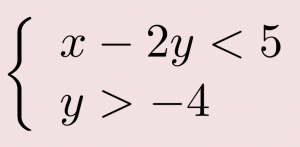
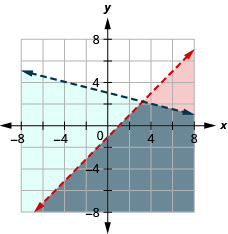
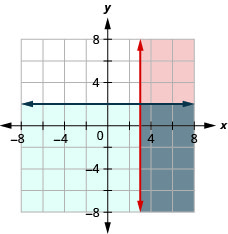
Graph  , by graphing , by graphing  and testing a point. and testing a point.The intercepts are x = 5 and y = −2.5 and the boundary line will be dashed. Test (0, 0). It makes the inequality true. So, shade the side that contains (0, 0) red. |
 |
| Graph y > −4, by graphing y = −4 and recognizing that it is a horizontal line through y = −4. The boundary line will be dashed. Test (0, 0). It makes the inequality true. So, shade (blue) the side that contains (0, 0) blue. |
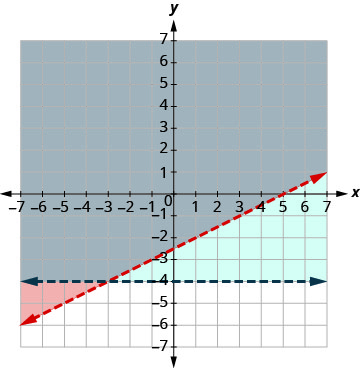 |
The point (0, 0) is in the solution and we have already found it to be a solution of each inequality. The point of intersection of the two lines is not included as both boundary lines were dashed.
The solution is the area shaded twice which is the darker-shaded region.
TRY IT 4
Solve the system by graphing. 
Show answer
Systems of linear inequalities where the boundary lines are parallel might have no solution. We’ll see this in the next example.
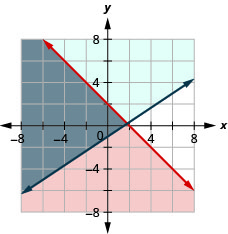
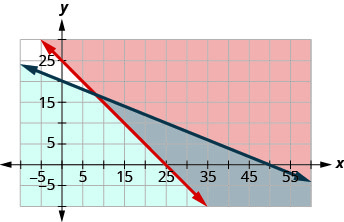
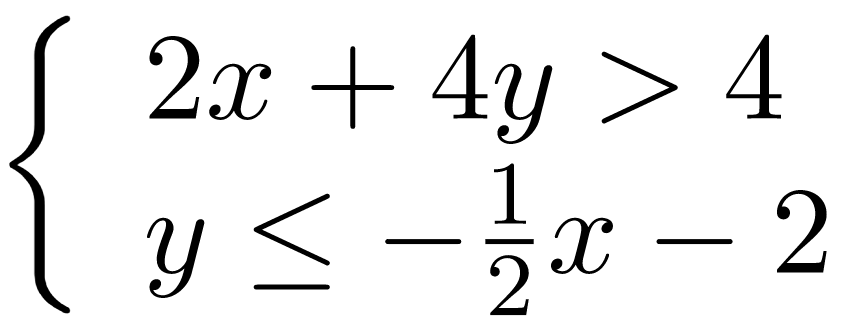
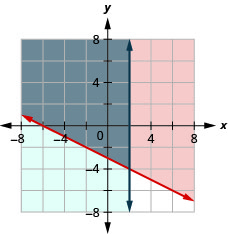
EXAMPLE 5
Solve the system by graphing. 
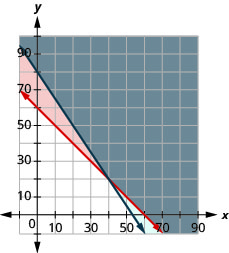
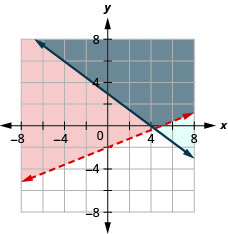
Graph  , by graphing , by graphing  and testing a point. and testing a point.The intercepts are x = 3 and y = 4 and the boundary line will be solid. Test (0, 0). It makes the inequality false. So, shade the side that does not contain (0, 0) red. |
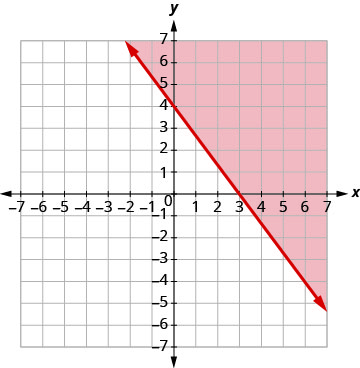 |
Graph  by graphing by graphing  using the using theslope  and the y-intercept b = 1. The boundary line will be dashed. and the y-intercept b = 1. The boundary line will be dashed.Test (0, 0). It makes the inequality true. So, shade the side that contains (0, 0) blue. |
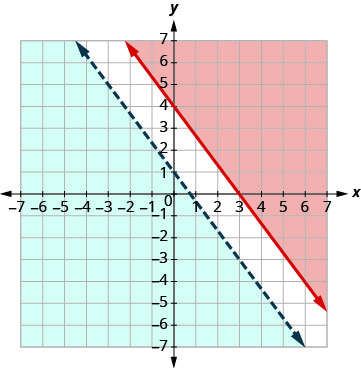 |
There is no point in both shaded regions, so the system has no solution. This system has no solution.
TRY IT 5
Solve the system by graphing. 
Show answer
no solution
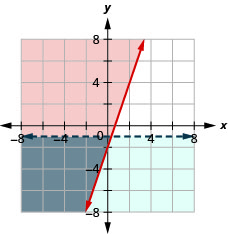
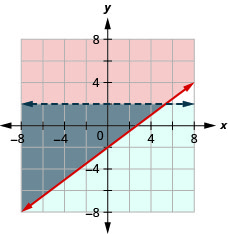
EXAMPLE 6
Solve the system by graphing. 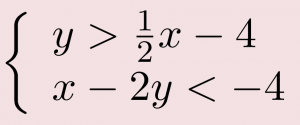
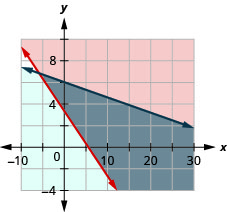
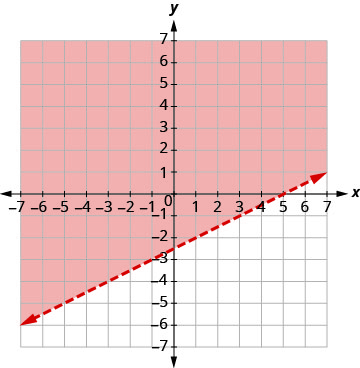
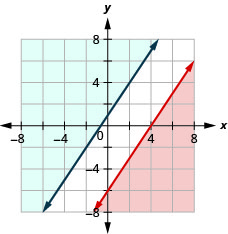
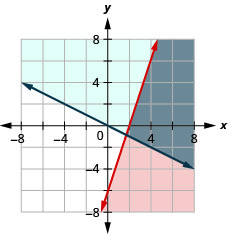
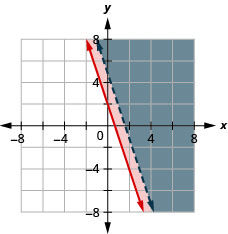
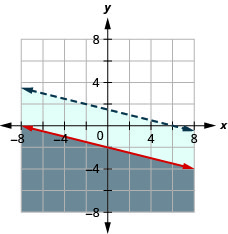
Graph  > >  by graphing by graphing  using the slope  and the intercept and the interceptb = −4. The boundary line will be dashed. Test (0, 0). It makes the inequality true. So, shade the side that contains (0, 0) red. |
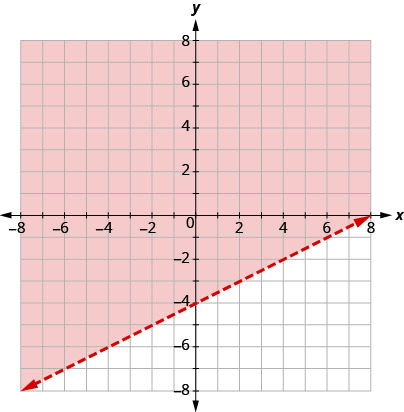 |
Graph  by graphing by graphing  and testing a point. and testing a point.The intercepts are x = −4 and y = 2 and the boundary line will be dashed. Choose a test point in the solution and verify that it is a solution to both inequalities. |
 |
No point on the boundary lines is included in the solution as both lines are dashed.
The solution is the region that is shaded twice, which is also the solution to .
TRY IT 6
Solve the system by graphing. 
Show answer

Solve Applications of Systems of Inequalities
The first thing we’ll need to do to solve applications of systems of inequalities is to translate each condition into an inequality. Then we graph the system as we did above to see the region that contains the solutions. Many situations will be realistic only if both variables are positive, so their graphs will only show Quadrant I.
EXAMPLE 7
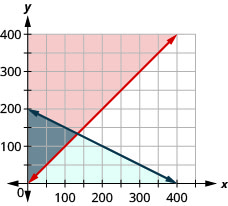
Christy sells her photographs at a booth at a street fair. At the start of the day, she wants to have at least 25 photos to display at her booth. Each small photo she displays costs her ?4 and each large photo costs her ?10. She doesn’t want to spend more than ?200 on photos to display.
a) Write a system of inequalities to model this situation.
b) Graph the system.
c) Could she display 15 small and 5 large photos?
d) Could she display 3 large and 22 small photos?
a) Let  the number of small photos.
 the number of large photos
To find the system of inequalities, translate the information.

We have our system of inequalities. 
b)
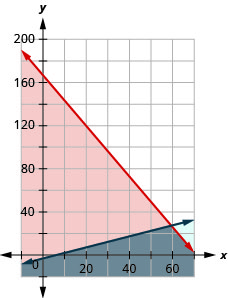
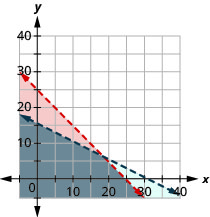
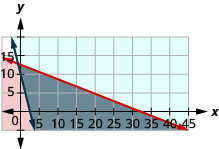
To graph  , graph x + y = 25 as a solid line. , graph x + y = 25 as a solid line.Choose (0, 0) as a test point. Since it does not make the inequality true, shade the side that does not include the point (0, 0) red. To graph  , graph 4x + 10y = 200 as a solid line. , graph 4x + 10y = 200 as a solid line.Choose (0, 0) as a test point. Since it does not make the inequality true, shade the side that includes the point (0, 0) blue. |
 |
The solution of the system is the region of the graph that is double shaded and so is shaded darker.
c) To determine if 10 small and 20 large photos would work, we see if the point (10, 20) is in the solution region. It is not. Christy would not display 10 small and 20 large photos.
d) To determine if 20 small and 10 large photos would work, we see if the point (20, 10) is in the solution region. It is. Christy could choose to display 20 small and 10 large photos.
Notice that we could also test the possible solutions by substituting the values into each inequality.
TRY IT 7
Mary needs to purchase supplies of answer sheets and pencils for a standardized test to be given to the juniors at her high school. The number of the answer sheets needed is at least 5 more than the number of pencils. The pencils cost $2 and the answer sheets cost $1. Mary’s budget for these supplies allows for a maximum cost of $400.
a) Write a system of inequalities to model this situation.
b) Graph the system.
c) Could Mary purchase 100 pencils and 100 answer sheets?
d) Could Mary purchase 150 pencils and 150 answer sheets?
Show answer
a) 
b)
c) no
d) no
EXAMPLE 8
Omar needs to eat at least 800 calories before going to his team practice. All he wants is hamburgers and cookies, and he doesn’t want to spend more than $5. At the hamburger restaurant near his college, each hamburger has 240 calories and costs $1.40. Each cookie has 160 calories and costs $0.50.
a) Write a system of inequalities to model this situation.
b) Graph the system.
c) Could he eat 3 hamburgers and 1 cookie?
d) Could he eat 2 hamburgers and 4 cookies?
a) Let  the number of hamburgers.
 the number of cookies
To find the system of inequalities, translate the information.
The calories from hamburgers at 240 calories each, plus the calories from cookies at 160 calories each must be more that 800.

The amount spent on hamburgers at $1.40 each, plus the amount spent on cookies at $0.50 each must be no more than $5.00.

We have our system of inequalities. 
b)
To graph graph  as a solid line. as a solid line.Choose (0, 0) as a test point. it does not make the inequality true. So, shade (red) the side that does not include the point (0, 0). To graph , graph  as a solid line. as a solid line.Choose (0,0) as a test point. It makes the inequality true. So, shade (blue) the side that includes the point. |
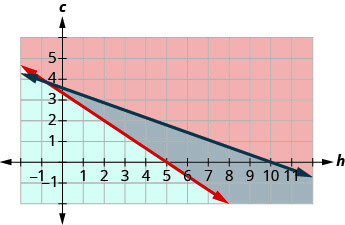 |
The solution of the system is the region of the graph that is double shaded and so is shaded darker.
c) To determine if 3 hamburgers and 2 cookies would meet Omar’s criteria, we see if the point (3, 1) is in the solution region. It is. He might choose to eat 3 hamburgers and 2 cookies.
d) To determine if 2 hamburgers and 4 cookies would meet Omar’s criteria, we see if the point (2, 4) is in the solution region. It is. He might choose to eat 2 hamburgers and 4 cookies.
We could also test the possible solutions by substituting the values into each inequality.
TRY IT 8
Tension needs to eat at least an extra 1,000 calories a day to prepare for running a marathon. He has only $25 to spend on the extra food he needs and will spend it on $0.75 donuts which have 360 calories each and $2 energy drinks which have 110 calories.
a) Write a system of inequalities that models this situation.
b) Graph the system.
c) Can he buy 8 donuts and 4 energy drinks?
d) Can he buy 1 donut and 3 energy drinks?
Show answer
a) 
b)
c) yes
d) no
Access these online resources for additional instruction and practice with graphing systems of linear inequalities.
- Graphical System of Inequalities
- Systems of Inequalities
- Solving Systems of Linear Inequalities by Graphing
Key Concepts
- To Solve a System of Linear Inequalities by Graphing
- Graph the first inequality.
- Graph the boundary line.
- Shade in the side of the boundary line where the inequality is true.
- On the same grid, graph the second inequality.
- Graph the boundary line.
- Shade in the side of that boundary line where the inequality is true.
- The solution is the region where the shading overlaps.
- Check by choosing a test point.
- Graph the first inequality.
4.5 Exercise Set
In the following exercises, determine whether each ordered pair is a solution to the system.


In the following exercises, solve each system by graphing.


In the following exercises, translate to a system of inequalities and solve.
- Caitlyn sells her drawings at the county fair. She wants to sell at least 60 drawings and has portraits and landscapes. She sells the portraits for $15 and the landscapes for $10. She needs to sell at least $800 worth of drawings in order to earn a profit.
- Write a system of inequalities to model this situation.
- Graph the system.
- Will she make a profit if she sells 20 portraits and 35 landscapes?
- Will she make a profit if she sells 50 portraits and 20 landscapes?
- Reiko needs to mail her Christmas cards and packages and wants to keep her mailing costs to no more than $500. The number of cards is at least 4 more than twice the number of packages. The cost of mailing a card (with pictures enclosed) is $3 and for a package the cost is $7.
- Write a system of inequalities to model this situation.
- Graph the system.
- Can she mail 60 cards and 26 packages?
- Can she mail 90 cards and 40 packages?
- Jocelyn is pregnant and needs to eat at least 500 more calories a day than usual. When buying groceries one day with a budget of $15 for the extra food, she buys bananas that have 90 calories each and chocolate granola bars that have 150 calories each. The bananas cost $0.35 each and the granola bars cost $2.50 each.
- Write a system of inequalities to model this situation.
- Graph the system.
- Could she buy 5 bananas and 6 granola bars?
- Could she buy 3 bananas and 4 granola bars?
- Jocelyn desires to increase both her protein consumption and caloric intake. She desires to have at least 35 more grams of protein each day and no more than an additional 200 calories daily. An ounce of cheddar cheese has 7 grams of protein and 110 calories. An ounce of parmesan cheese has 11 grams of protein and 22 calories.
- Write a system of inequalities to model this situation.
- Graph the system.
- Could she eat 1 ounce of cheddar cheese and 3 ounces of parmesan cheese?
- Could she eat 2 ounces of cheddar cheese and 1 ounce of parmesan cheese?
- Tickets for an American Baseball League game for 3 adults and 3 children cost less than ?75, while tickets for 2 adults and 4 children cost less than $62.
- Write a system of inequalities to model this problem.
- Graph the system.
- Could the tickets cost $20 for adults and $8 for children?
- Could the tickets cost $15 for adults and $5 for children?
Answers:
-
- true
- false
- false
- true
- true
- false
- true
- true
|
5.  |
6.  |
7.  |
|
8.  |
9.  |
10.  |
|
11.  |
12.  |
13.  |
|
14.  |
15.  |
16. No solution
|
17. No solution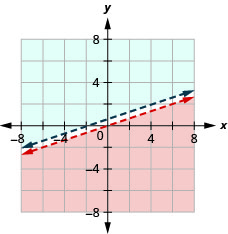 |
18.  |
19.
|
|
20.
|
21. a) 
b) c) No d) Yes |
22. a) 
b) c) Yes d) No |
23. a) 
b) c) No d) Yes |
24. a) 
b) c) Yes d) No |
25. a) 
b) c) No d) Yes |

 >
>