7. Data Analysis I
7.1 Measures of Central Tendency

Learning Objectives
By the end of this section it is expected that you will be able to:
- Calculate three measures of central tendency: the mean, median and mode
- Describe what the mean, median and mode tell us about a data set
When we discuss the mountains of the world we often hear mention of the world’s highest peak, Mount Everest. Aside from the highest, there are other criteria which can be used to compare mountains. Perhaps we might want to determine the average height of the mountains within a specified mountain range. We may wish to determine who has made the most number of summit attempts of a particular mountain and what that number of attempts was. These kinds of questions can be answered with statistics.
Measures of Central Tendency
In our daily lives we encounter data and statistics on a regular basis. The data can be analysed to ascertain patterns and trends or to determine measures of central tendency. Three statistics that measure the center point of a set of data are mean, median and mode. Each of these measures of central tendency serves a different purpose and provides a different perspective.
Consider a college level biology class of 44 students that receives feedback on their midterm exam. The instructor shares the following results with the class: the average score was 68%, the most common score was 48%, and the score that ranked right in the middle of the class was 75%. The three values each represent a different measure of central tendency for the exam scores. What can we conclude about how the class performed? An examination of each of the three measures will help answer this question.
Mean
In the college biology class the average score on the midterm exam was 68%. The average score is also referred to as the mean. The average score of 68% on the biology exam is the sum of all exam scores divided by the number of scores (44 students).
Mean
The mean is the sum of all data items divided by the number of data items. This can be expressed as :

The symbol ∑ is called the summation symbol and indicates that all data items are to be summed. The mean or average of a set of data is calculated by adding all of the values and dividing by the number of values.
Consider a runner who is training for a 10 km race. Her coach requires that she run an average distance of 15 km a day. Over a two week period the runner logged the following distances (in km) on her daily runs.
| Su | M | T | W | Th | F | Sa | Su | M | T | W | Th | F | Sa |
| 15 | 16 | 14 | 22 | 15 | 10 | 30 | 0 | 15 | 20 | 20 | 24 | 5 | 32 |
Did the runner meet the coach’s requirement? To determine the answer we need to calculate the average or mean.
To determine the average daily distance the calculation would be:

On average the runner covered 17km/day which exceeds the coach’s required 15km/day.
EXAMPLE 1
Fifteen students wrote a math test and received the following grades: 89, 45, 78, 76, 73, 98, 73, 92, 88, 73, 100, 51, 64, 80, 95.
Solution
To determine the mean:
Add the grades and divide by the number of grades (15) (89+45+78+76+73+98+73+92+88+73+100+51+64+80+95)/15 = 1175/15 = 78.33…
The average grade, rounded to the nearest whole number, was 78.
TRY IT 1
Find the mean of the data set: 5.7, 3.4, 7.8, 9.2, 3.8, 1.6
Show answer

Data is often compiled in the form of tables and it is more efficient to calculate the mean using aggregates of each value.
EXAMPLE 2
A class of 46 students were asked to rate their instructor on a scale of 1 to 5, with 5 being the highest. The table provides the number of students assigning a score of 1, 2, 3, 4, or 5.
| Score | Number of Students Assigning this Score |
| 1 | 2 |
| 2 | 5 |
| 3 | 15 |
| 4 | 11 |
| 5 | 13 |
Solution
To determine the mean, sum the 46 scores and divide by 46:
 (rounded to one decimal place)
The instructor received an average score of 3.6.
TRY IT 2
A coffee outlet sells coffee in 4 different sizes: small, medium, large, and extra large. The table provides a summary of one morning’s sales.
a) Calculate the total number of ounces of coffee sold.
b) Ignoring the four cup sizes, what was the average number of ounces of coffee consumed per purchase (to the nearest ounce)?
c) Based on your answer, which of the four sizes is most representative of the typical coffee purchase?
| Size | Quantity of Coffee | Number of Purchasers |
| small | 12 oz. | 29 |
| medium | 15 oz. | 47 |
| large | 20 oz. | 52 |
| extra large | 24 oz. | 11 |
Show answer
a) (29×12 oz) + ((47x15oz) + (52x20oz) + (11x24oz) = 2357 ounces
b)  per purchase
c) This 17 oz cup is closest to a medium cup.
Median
When the values in a set of data are quite different we can consider another measure of central tendency called the median. In the biology class with 44 students the score that ranked right in the middle of the class was 75%. This means that half of the exam scores were lower than 75% and half of the exam scores were higher than 75%.
Median
The median is the data item in the middle of each set of ranked, or ordered, data. The median separates the upper half and the lower half of a data set. It is the “middle” value of the data set when it is arranged from highest to lowest values or from lowest values to highest values. If there are two middle values, the median is the average of these two values.
To find the median of a group of data items:
- Arrange the data items in order, from smallest to largest or from largest to smallest.
- If the number of data items is odd, the median is the data item in the middle of the list.
- If the number of data items is even, the median is the mean of the two middle data items.
Returning to the runner who logged the following distances over two weeks:
| Su | M | T | W | Th | F | Sa | Su | M | T | W | Th | F | Sa |
| 15 | 16 | 14 | 22 | 15 | 10 | 30 | 0 | 15 | 20 | 20 | 24 | 5 | 32 |
The median would be determined by ranking the distances from smallest to largest:
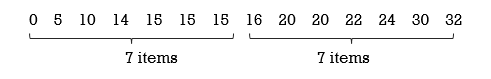
The number of data items is even (14 items), therefore the median is the average of the two middle items. The two middle values are 15km and 16km. The average of these is (15 + 16)/ 2 = 15.5km so the median distance is 15.5 km. This indicates that for the runner half of the distances run would be less than 15.5 km and half would be greater than 15.5 km.
If the number of data items is odd, the median is the data item that lies exactly in the middle of the ranked data items; it separates the data items into two halves.
EXAMPLE 3
Fifteen students wrote a math test and received the following grades: 89, 45, 78, 76, 73, 98, 73, 92, 88, 73, 100, 51, 64, 80, 95. What was the median grade?
Solution
To determine the median:
- Order the data set from highest to lowest values: 100, 98, 95, 92, 89, 88, 80, 78, 76, 73, 73, 73, 64, 51, 45
- Determine the middle value: 100, 98, 95, 92, 89, 88, 80, 78, 76, 73, 73, 73, 64, 51, 45
Note that there is an odd number of values (15) so there is exactly one middle value. The median value is the 8th value since 15 values/2 = the 7.5th or 8th value. Counting from highest to lowest or from lowest to highest values, the 8th value is 78.
In example 1 the mean was calculated as 78.3… In this case the mean and median are quite close. It is important to note that the mean and median may not always be so close.
TRY IT 3
Find the median of the data set: 5.7, 3.4, 7.8, 9.2, 3.8, 1.6
Show answer

When data is presented in the form of a table the median can be determined using a few different methods.
EXAMPLE 4
A class of 46 students were asked to rate their instructor on a scale of 1 to 5, with 5 being the highest possible rating. The table provides the number of students assigning a score of 1, 2, 3, 4, or 5.
| Score | Number of Students Assigning this Score | Total Number of Scores |
| 1 | 2 | 2 scores of 1 |
| 2 | 5 | 2+5= 7 scores of 1 or 2 |
| 3 | 15 | 7+15= 22 scores of 1, 2 or 3 |
| 4 | 11 | 22+11= 33 scores of 1, 2, 3, or 4 |
| 5 | 13 | 33+13= 46 scores of 1, 2, 3 ,4 or 5 |
Solution
To determine the median, divide the number of student scores by 2: 46/2=23 This indicates that there will be 23 scores in the top half and 23 scores in the bottom half, therefore the middle score will be the average of the 23rd and 24th scores. Working from the low score of 1 to the high score of 5, the first 22 scores were either 1, 2, or 3. The 23rd score is 4 and the 24th score is 4, therefore the median score is 4.
Note: An alternate method for determining the median would be to list every score from low to high and then count until the middle score is reached: 1, 1, 2, 2, 2, 2, 2, 3, 3, 3, 3, 3, 3, 3, 3, 3, 3, 3, 3, 3, 3, 3, 4 ⇑ 4, 4, 4, 4, 4, 4, 4, 4, 4, 4, 5, 5, 5, 5, 5, 5, 5, 5, 5, 5, 5, 5, 5
The 23rd and 24th scores are 4 and 4 so the median is the average of these (4+4)/2 = 4
TRY IT 4
A coffee outlet sells coffee in 4 different sizes: small, medium, large, and extra large. The table provides a summary of one morning’s sales. Determine which of the four sizes, small, medium, large or extra large would be the median size purchased.
| Size | Number of Purchasers |
| small (12 oz) | 29 |
| medium (15 oz.) | 47 |
| large (20 oz.) | 52 |
| extra large (24 oz.) | 11 |
Show answer
 . Therefore since 69 purchasers were in the bottom half and 69 were in the top half, the median purchaser was a medium cup sup of 15 oz..
Mode
For the college biology class the most common score was 48%. This grade represents the mode for the set of exam scores, as the mode is the data value that occurs most often. Although a mode of 48% may seem to indicate a poor overall result, this is not necessarily the case. A score of 48% could possibly have occurred only twice for the entire class if all other grades each occurred only once.
Mode
The mode is the most frequently occurring data value. A data set can have more than one mode. If there are two values that each occur the same number of times then the data set is bimodal.
EXAMPLE 5
Fifteen students wrote a math test and received the following grades: 89, 45, 78, 76, 73, 98, 73, 92, 88, 73, 100, 51, 64, 80, 95.
Solution
To determine the mode: Count the number of times each data value occurs. In this example the value that occurs three times, 73, is the mode.
TRY IT 5
Over a two week period a runner logged the following distances (in km) on her daily runs. Determine the mode (the distance that she ran most often).
| Su | M | T | W | Th | F | Sa | Su | M | T | W | Th | F | Sa |
| 15 | 16 | 14 | 22 | 15 | 10 | 30 | 0 | 15 | 20 | 20 | 24 | 5 | 32 |
Show answer
The mode is 15 km
When data is presented in tabular form the mode is often apparent.
EXAMPLE 6
A class of 46 students were asked to rate their instructor on a scale of 1 to 5, with 5 being the highest. The table provides the number of students assigning a score of 1, 2, 3, 4, or 5.
| Scores | Number of Students assigning this Score |
|---|---|
| 1 | 2 |
| 2 | 5 |
| 3 | 15 |
| 4 | 11 |
| 5 | 13 |
Solution
The mode is the value that occurs 15 times, which is 3.
It is possible to have more than one mode in a set of data. If two different data values occur most often the data is considered to be bimodal. In example 2, if the students assigning scores of 1 changed their scores to 5, then the score of 3 and the score of 5 would both occur 15 times. In this case the data set would be bimodal.
If each value in a set of data occurs the same number of times then there is said to be no mode. In Try It 1 the data set is 5.7, 3.4, 7.8, 9.2, 3.8, 1.6. There is no mode for this set of data.
TRY IT 6
A coffee outlet sells coffee in 4 different sizes: small, medium, large, and extra large. The table provides a summary of one morning’s sales. Determine which of the four sizes, small, medium, large or extra large would be the mode.
| Size | Number of Purchasers |
|---|---|
| small (12 oz.) | 29 |
| medium (15 oz.) | 47 |
| large (20 oz.) | 52 |
| extra large (24 oz.) | 11 |
Show answer
Since 52 of the purchasers chose the large size of 20 oz. the 20 oz cup size is the mode.
Mean, Median or Mode?
The three measures of central tendency can yield very different results for one data set, as evidenced by examples one and two above. When choosing which measure to use, consideration must be given to the purpose.
In example 1 the average grade and median are both 78 but the mode is 73. Although the mean is often used for grade comparisons, the median is also useful as it serves as an indicator of the midpoint of the grade distribution (distribution will be covered in a later section of this text). Although the mode is used less often with grades, it does indicate to students that although a grade of 73 was below the average, it was the most common grade.
EXAMPLE 7
Consider again the example 6 involving the instructor evaluation. In a class of 46 students, the mean evaluation score was 3.6, the median was 4 and the mode was 3. Which measure is most useful: mean, median or mode? Why?
Solution
The difference in these values may seem slight, yet each provides a different perspective. The mean and the median are probably most useful.
The mean score of 3.6 does not truly reflect any of the possible choices since only scores of 1, 2, 3, 4, and 5 are possible but it does indicate that on average students are more happy (than not) with the instructor. The median score of 4 indicates that half of the students awarded the instructor a score of 4 or 5 so the median also provides an encouraging result. The mode indicates that out of the entire class a ranking of 3 was given most often (15 times) by one third of the students but it doesn’t yield any information about the other two thirds of the evaluations.
TRY IT 7
Referring back to the coffee outlet, discuss with a classmate: which measure is most useful to the owner of the coffee outlet? mean, median or mode? Why?
Show answer
Answers may vary.
Key Concepts
- Three measures of central tendency are the mean, median and mode
- To determine the mean:
Add all data values and divide by the number of data values. - To determine the median:
Rank the data values from smallest to largest and determine the middle value. - To determine the mode:
Count the number of occurences of each data value and determine which value occurs most often.
Glossary
7.1 Exercise Set
- Find the mean, median and mode for the data set: 55, 45, 35, 65, 25, 75, 85
- Find the mean, median and mode for the data set: 68, 55, 63, 68, 55, 63, 45, 68
- Find the mean, median and mode for the data set:
1 1 1 2 2 2 2 3 3 3 3 3 4 5 6 - Find the mean, median and mode for the data set: 25, 2, 7, 47, 56, 27, 2, 17, 56
- A hotdog vendor sold the following number of hotdogs over a two week period.
56 72 67 85 55 59 65 32 82 49 66 52 70 44 - What was the total number of hotdogs sold in the two weeks?
- What was the average number of hotdogs sold over the two week period?
- What was the median number of hotdogs sold over the 2-week period?
- A runner has four different routes that he chooses from. Over the period of one month the runner chose one circuit every day as indicated in the chart.
Circuit Number of times chosen Very Easy (5 km) 6 Pleasant (10 km) 12 Challenging (20 km) 8 Exhausting (40 km) 2 - What was the total number of kilometres run during the month?
- What was the average number of kilometres run per day?
- What was the median number of kilometres run per day?
- The ages of all students in a precalculus math class are:
17 18 18 18 19 19 19 19 19 19 19 20 20 20 20 21 21 21 22 22 23 24 25 25 28 31 31 35 48 49 50 70 - Determine the mean, median and mode.
- If the highest and lowest ages are removed from the class, how are the mean, median and mode impacted?
- The ages of all students in a graduate English class are:
25 25 25 28 29 29 30 30 31 31 31 34 38 42 - Determine the mean, median and mode.
- If the highest and lowest ages are removed from the class, how are the mean, median and mode impacted?
- A math instructor returned a graded exam to the class of 44 students. The instructor announced that 15 students scored 63%. and 15 students scored 71%. Which measure(s) of central tendency can be determined from this information?
- Before returning a graded exam to a class of students the instructor announced that the mean was 55% and the median was 78%. What does this indicate about how the students in the class performed on the exam?
Answers
- mean 55; median 55; mode none
- mean 60.625; median 63; mode 68
- mean 2.73…; median 3; mode 3
- mean 26.55…; median 25; mode 2, 56 – data bimodal
-
- 854 hotdogs
- 61 hotdogs
- 62 hotdogs
-
- 390 km
- 13.9 km
- 10 km
-
- mean 25.9, median 21, mode 19
- The new mean is lower at 24.8 and the median and mode are the same
-
- mean 30.6, median 30, bimodal 25 & 31
- The new mean is lower at 30.1, the median remains at 30 and there is one mode of 31
- the mode
- From the median we know that half of the students scored 78% or better. Since the mean was only 55% we can conclude that some scores were quite low (less than 55%).
