19.3 Dating Rocks Using Fossils
Geologists obtain a wide range of information from fossils:
- Fossils help us to understand evolution, and life in general.
- They provide critical information for understanding depositional environments and changes in Earth’s climate.
- They can be used to date rocks.
Although the recognition of fossils goes back hundreds—if not thousands—of years, the systematic cataloguing and assignment of relative ages to different organisms from the distant past—the science of paleontology—only dates back to the earliest part of the 19th century.
The oldest undisputed fossils are from rocks dated ~3.5 Ga, and although fossils this old are typically poorly preserved and are not useful for dating rocks, they can still provide important information about conditions at the time. The oldest well-understood fossils are from rocks dating back to ~600 Ma, and the sedimentary record from this time forward is rich in fossil remains that provide a detailed record of the history of life. However, as anyone who has gone hunting for fossils knows, this doesn’t mean that all sedimentary rocks have visible fossils or that fossils are easy to find.
Fossils alone can’t give us numerical ages for rocks, but over the past century geologists have acquired enough isotopic dates from rocks associated with fossiliferous rocks (such as igneous dykes cutting through sedimentary layers) to be able to put specific time limits on most fossils.
A Brief History of Life
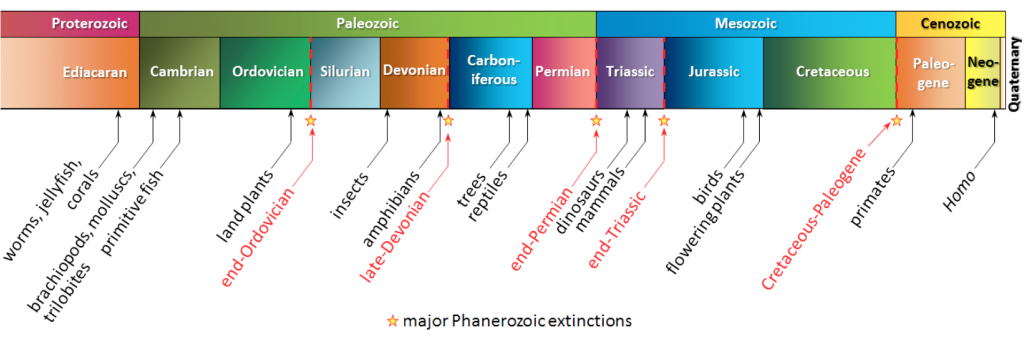
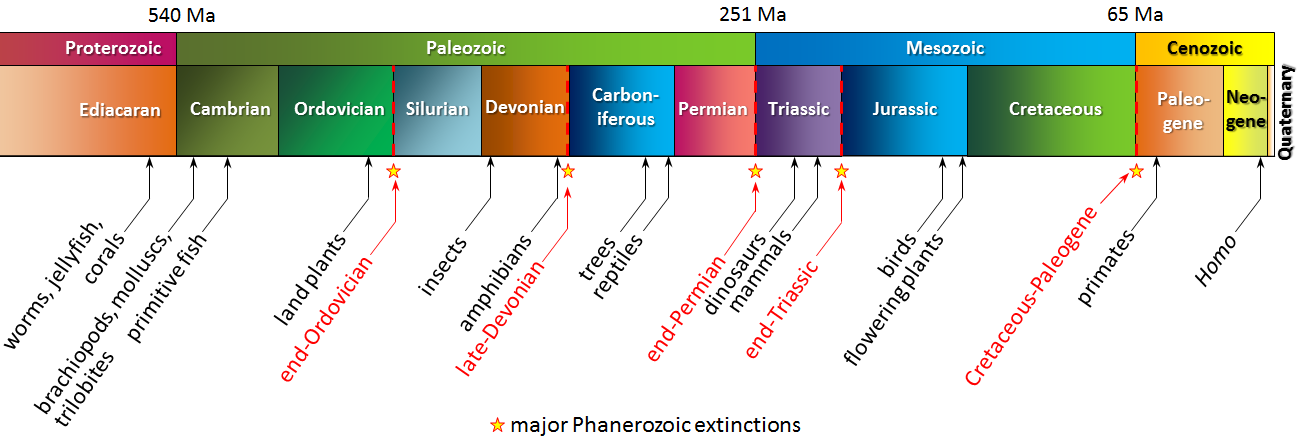
A selective history of life on Earth over the past 600 million years is provided in Figure 19.11.
- The major groups of organisms that we are familiar with appeared between the late Proterozoic and the Cambrian (~600 Ma to ~541 Ma).
- Plants, which originally evolved in the oceans as green algae, invaded land during the Ordovician (~450 Ma).
- Insects, which evolved from marine arthropods, invaded land during the Devonian (400 Ma), and amphibians (i.e., vertebrates) invaded land about 50 million years later.
- By the late Carboniferous, trees had evolved from earlier plants, and reptiles had evolved from amphibians.
- By the mid-Triassic, dinosaurs and mammals had evolved from reptiles and reptile ancestors.
- Birds evolved from dinosaurs during the Jurassic.
- Flowering plants evolved in the late Jurassic or early Cretaceous.
- The earliest primates evolved from other mammals in the early Paleogene, and the genus Homo evolved during the late Neogene (~2.8 Ma).
If we understand the sequence of evolution on Earth, we can apply this knowledge to determining the relative ages of rocks. This is William Smith’s principle of faunal succession, although in spite of the name, it can apply to fossils of plants and simple organisms as well as to fauna (animals).
Mass Extinctions
The Phanerozoic Eon has witnessed five major extinctions (stars in Figure 19.11). The most significant of these was at the end of the Permian, which saw the extinction of over 80% of all species, and over 90% of all marine species. Most well-known types of organisms that survived were still severely impacted by this event.
The second most significant extinction occurred at the Cretaceous-Paleogene boundary (K-Pg, also known the Cretaceous-Tertiary or K-T extinction). At that time, ~75% of marine species disappeared, as well as dinosaurs (except for birds) and pterosaurs. Other species were badly reduced but survived, and then flourished in the Paleogene. The K-Pg extinction may have been caused by the impact of a large asteroid (10 km to 15 km in diameter) and/or volcanic eruptions associated with the formation of the Deccan Traps.
It’s not a coincidence that the major extinctions all coincide with boundaries of geological periods and/or eras. Paleontologists have placed most of the divisions of the geological time scale at points in the fossil record where there are major changes in the type of fossils observed.
Fossil Ranges
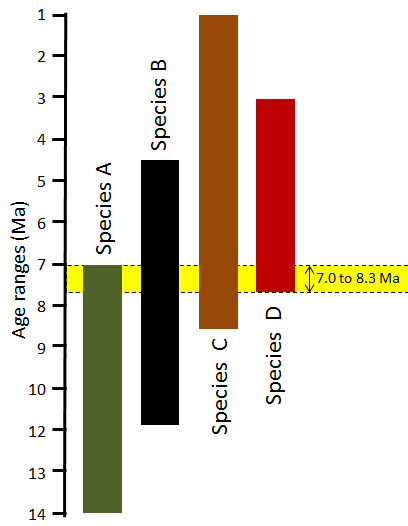
If we can identify a fossil, and we know when the organism lived, we can assign a range of time to the formation of the sediments in which the organism was preserved when it died. This range might be several millions of years, because some organisms survived for a very long time. But If the rock we’re studying has several types of fossils in it, and we can assign time ranges to all of these fossils, we may be able to narrow down the time range for the age of the rock considerably (Figure 19.12).
Index Fossils
Some organisms survived for a very long time, and are not particularly useful for dating rocks. Sharks, for example, have existed for over 400 million years, and the great white shark has survived for 16 million years so far. In contrast, organisms that lived for relatively short time periods are useful for dating rocks, especially if they were distributed over a wide geographic area and hence can be used to compare rocks from different regions. These are known as index fossils. There is no specific limit on how short the time span has to be for a fossil to qualify as an index fossil. Some such organisms lived for millions of years, and others for much less than a million years.
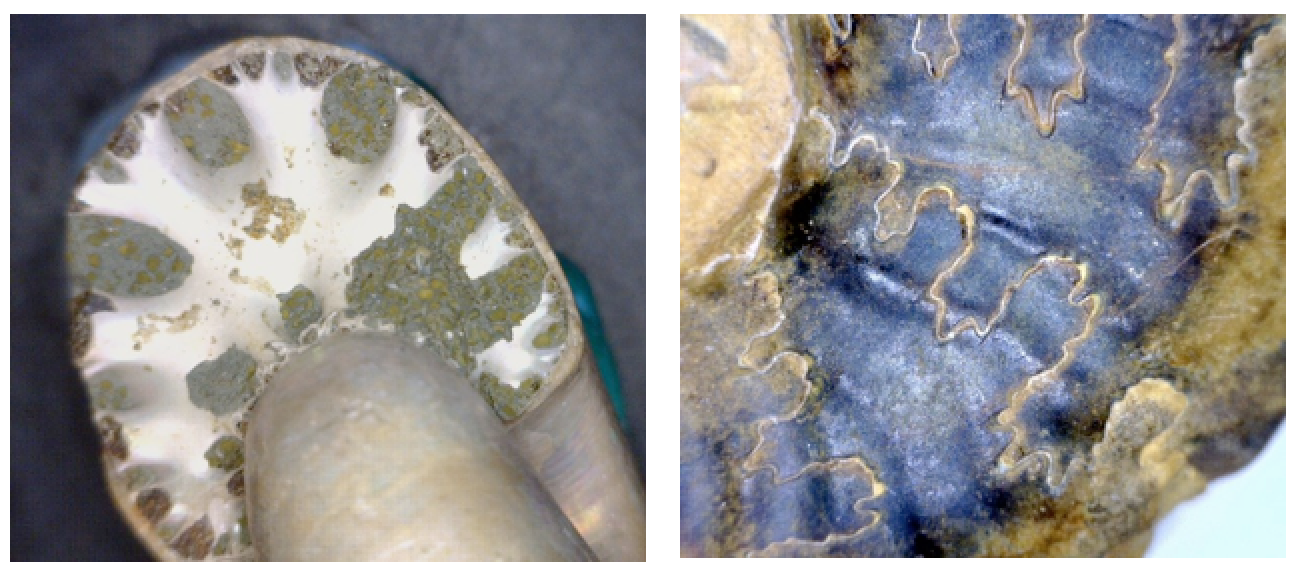
Some well-studied groups of organisms qualify as biozone fossils because, although the genera and families lived over a long time, each species lived for a relatively short time and can be easily distinguished from others on the basis of specific features. Ammonites, for example, have a distinctive feature known as the suture line, where the internal shell layers that separate the individual chambers (septae) meet the outer shell wall (Figure 19.13). These suture lines are sufficiently variable to identify species that can be used to estimate the relative or absolute ages of the rocks in which they are found.
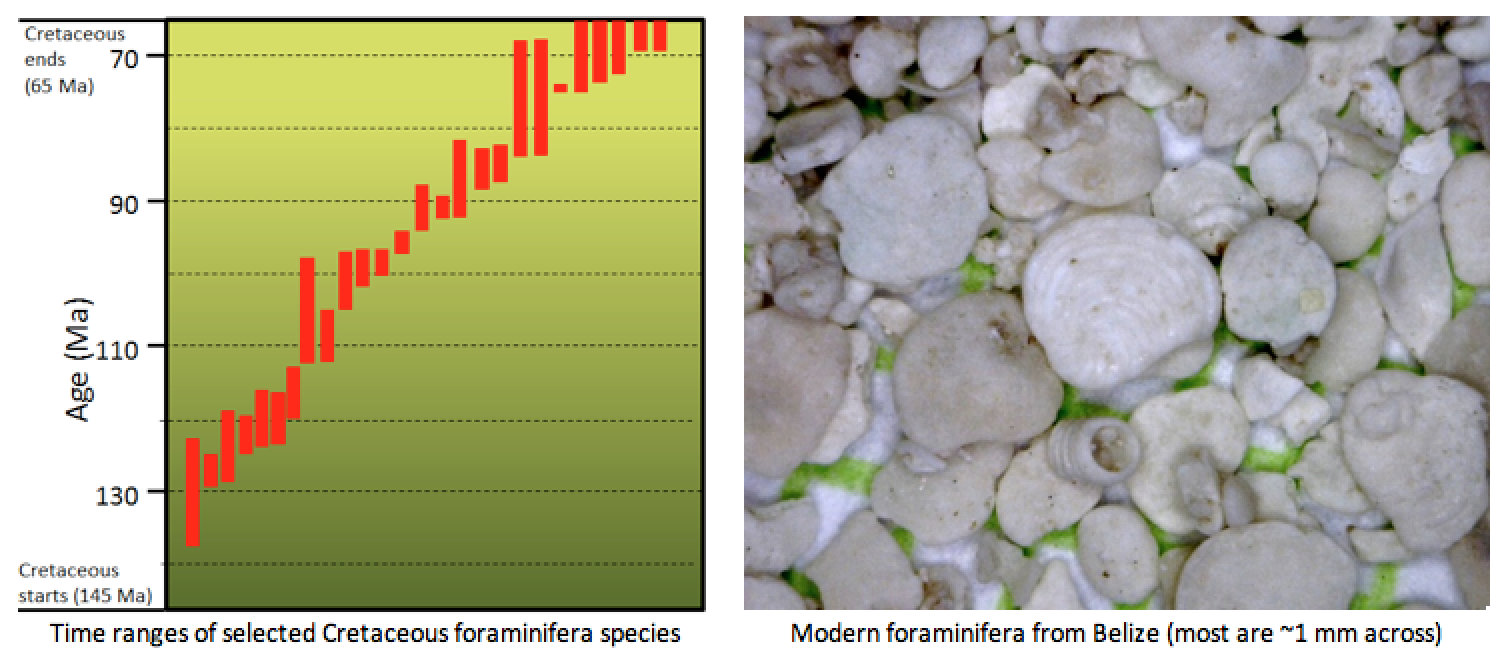
Foraminifera—small, calcium carbonate-shelled marine organisms that originated during the Triassic and are still alive today—are also useful biozone fossils. Numerous different foraminifera lived during the Cretaceous Period. Some lived for over 10 million years, but others lived for less than 1 million years (Figure 19.14). If the foraminifera in a rock can be identified to the species level, the rock’s age can be determined.
Try It!
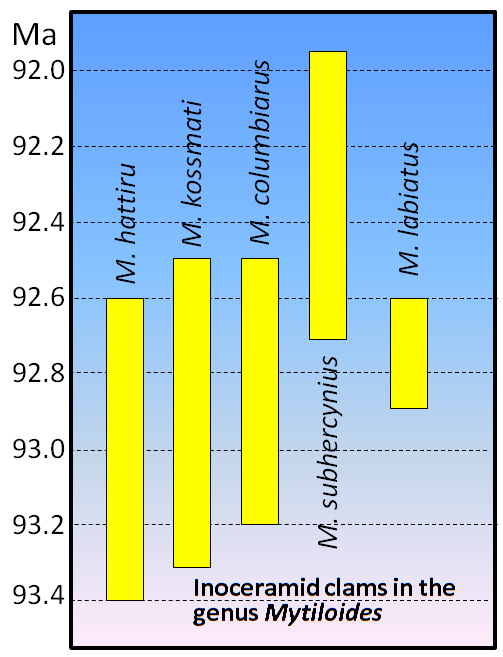
Image Description:
- Species M. hattiru: 93.4 – 92.6 Ma
- Species M. kossmati: 93.3 – 92.5 Ma
- Species M. columbiarus: 93.2 – 92.5 Ma
- Species M. subhercynius: 92.7 – 91.9 Ma
- Species M. labiatus: 92.9 – 92.6 Ma
Questions:
- Use the bracketing method to figure out the possible age range of a rock in which all five of these organisms were found.
- How would the age range change if M. subhercynius were not present in the rock?
To check your answers, navigate to the below link to view the interactive version of this activity.
Correlation
Geologists employ relative age dating techniques to correlate rocks between regions. Correlation seeks to relate the geological history between regions, by relating the rocks in one region to those in another.
There are different techniques of correlation. The easiest technique is to correlate by rock type, or lithology, called lithostratigraphic correlation. In this method, specific rock types are related between regions. If a sequence of rocks at one site consists of a sandstone unit overlain by a limestone unit, then a unit of shale, and the exact same sequence of rocks—sandstone, limestone, shale—occurs at a nearby site, lithostratigraphic correlation means assuming that the rocks at both sites are in the same rocks. If you could see all of the rock exposed between the two sites, the units would connect with one another. The problem with this type of correlation is that some rocks may only have formed locally, or may pinch out between the two sites, and therefore not be present at the site to which a correlation is being attempted.
Another technique, biostratigraphic correlation, involves correlation based on fossil content. This technique uses fossil assemblages (fossils of different organisms that occur together) to correlate rocks between regions. The best fossils to use are those that are widely spread, abundant, and lived for a relatively short period of time.
Yet another technique, chronostratigraphic correlation, is to correlate rocks that have the same age. This can be the most difficult way to correlate, because rocks are generally diachronous. That is, if we trace a given rock unit across any appreciable lateral distance, the age of that rock actually changes. To give a familiar example, when you go to the beach, you know that the beach itself and the lake bottom in the shallow water is sandy. But if you swim out to deeper water and touch bottom, the bottom feels muddy. The difference in sediment type has to do with the energy of deposition, with the waves at and near the beach keeping any fine sediments away, only depositing them in deeper quieter waters.
If you think of this example in time, you realize that the sand at and near the beach is being deposited at the same time as the mud in deeper water. But if lake levels drop, the beach sands will slowly migrate outwards and cover some of the deeper water muds. If lake levels rise, the deeper water muds will slowly migrate landwards and cover some of the shallower water sands. This is an example of Walther’s Law, which states that sedimentary rocks that we see one on top of each other in the rock record actually formed adjacent to one another at the time of deposition. In order to correlate rock units in time, we need to find marker beds that formed instantaneously, such as an ash layer from the eruption of a volcano that blanketed an entire region in ash.
References
Harries, P.J., Kauffman, E.G., Crampton, J.S. (Redacteurs), Bengtson, P., Cech, S., Crame, J.A., Dhondt, A.V., Ernst, G., Hilbrecht, H., Lopez, Mortimore, G.R., Tröger, K.-A., Walaszcyk, I., & Wood, C.J. (1996). Mitteilungen aus dem Geologisch – Paläontologischen Museum der Universität Hamburg, 77, 641-671. http://www.fuhrmann-hilbrecht.de/Heinz/geology/InoIntro/InoIntro.html
Scott, R. (2014). A Cretaceous chronostratigraphic database: construction and applications, Carnets de Géologie, 14(2), 15-37. http://paleopolis.rediris.es/cg/1402/
