3.2 Imaging Earth’s Interior
Seismology is the study of vibrations within Earth. You may have heard of seismology in the context of detecting and studying earthquakes, but vibrations can also come from extraterrestrial impacts, explosions, storm waves hitting the shore, and tides.
Seismic waves travel through different materials at different speeds. By measuring how long it takes for seismic waves to travel from their source to a recording station, and applying knowledge of how they interact with different materials, we can figure out where Earth’s layers are, and what they’re like. This is similar to the way ultrasound is used to image the human body.
Another feature of seismic waves is that some, called P-waves, can travel rapidly though both liquids and solids, but others, called S-waves, can only travel though solids, and are slower than P-waves. This is handy because observing where P-waves travel, and S-waves do not, allows us to identify regions within Earth that are melted.
Seismic Wave Paths
Seismic waves travel in all directions from their source, but it’s more convenient to imagine the path traced by one point on the wave front, and represent that path as a seismic ray (heavy arrows, Figure 3.5).
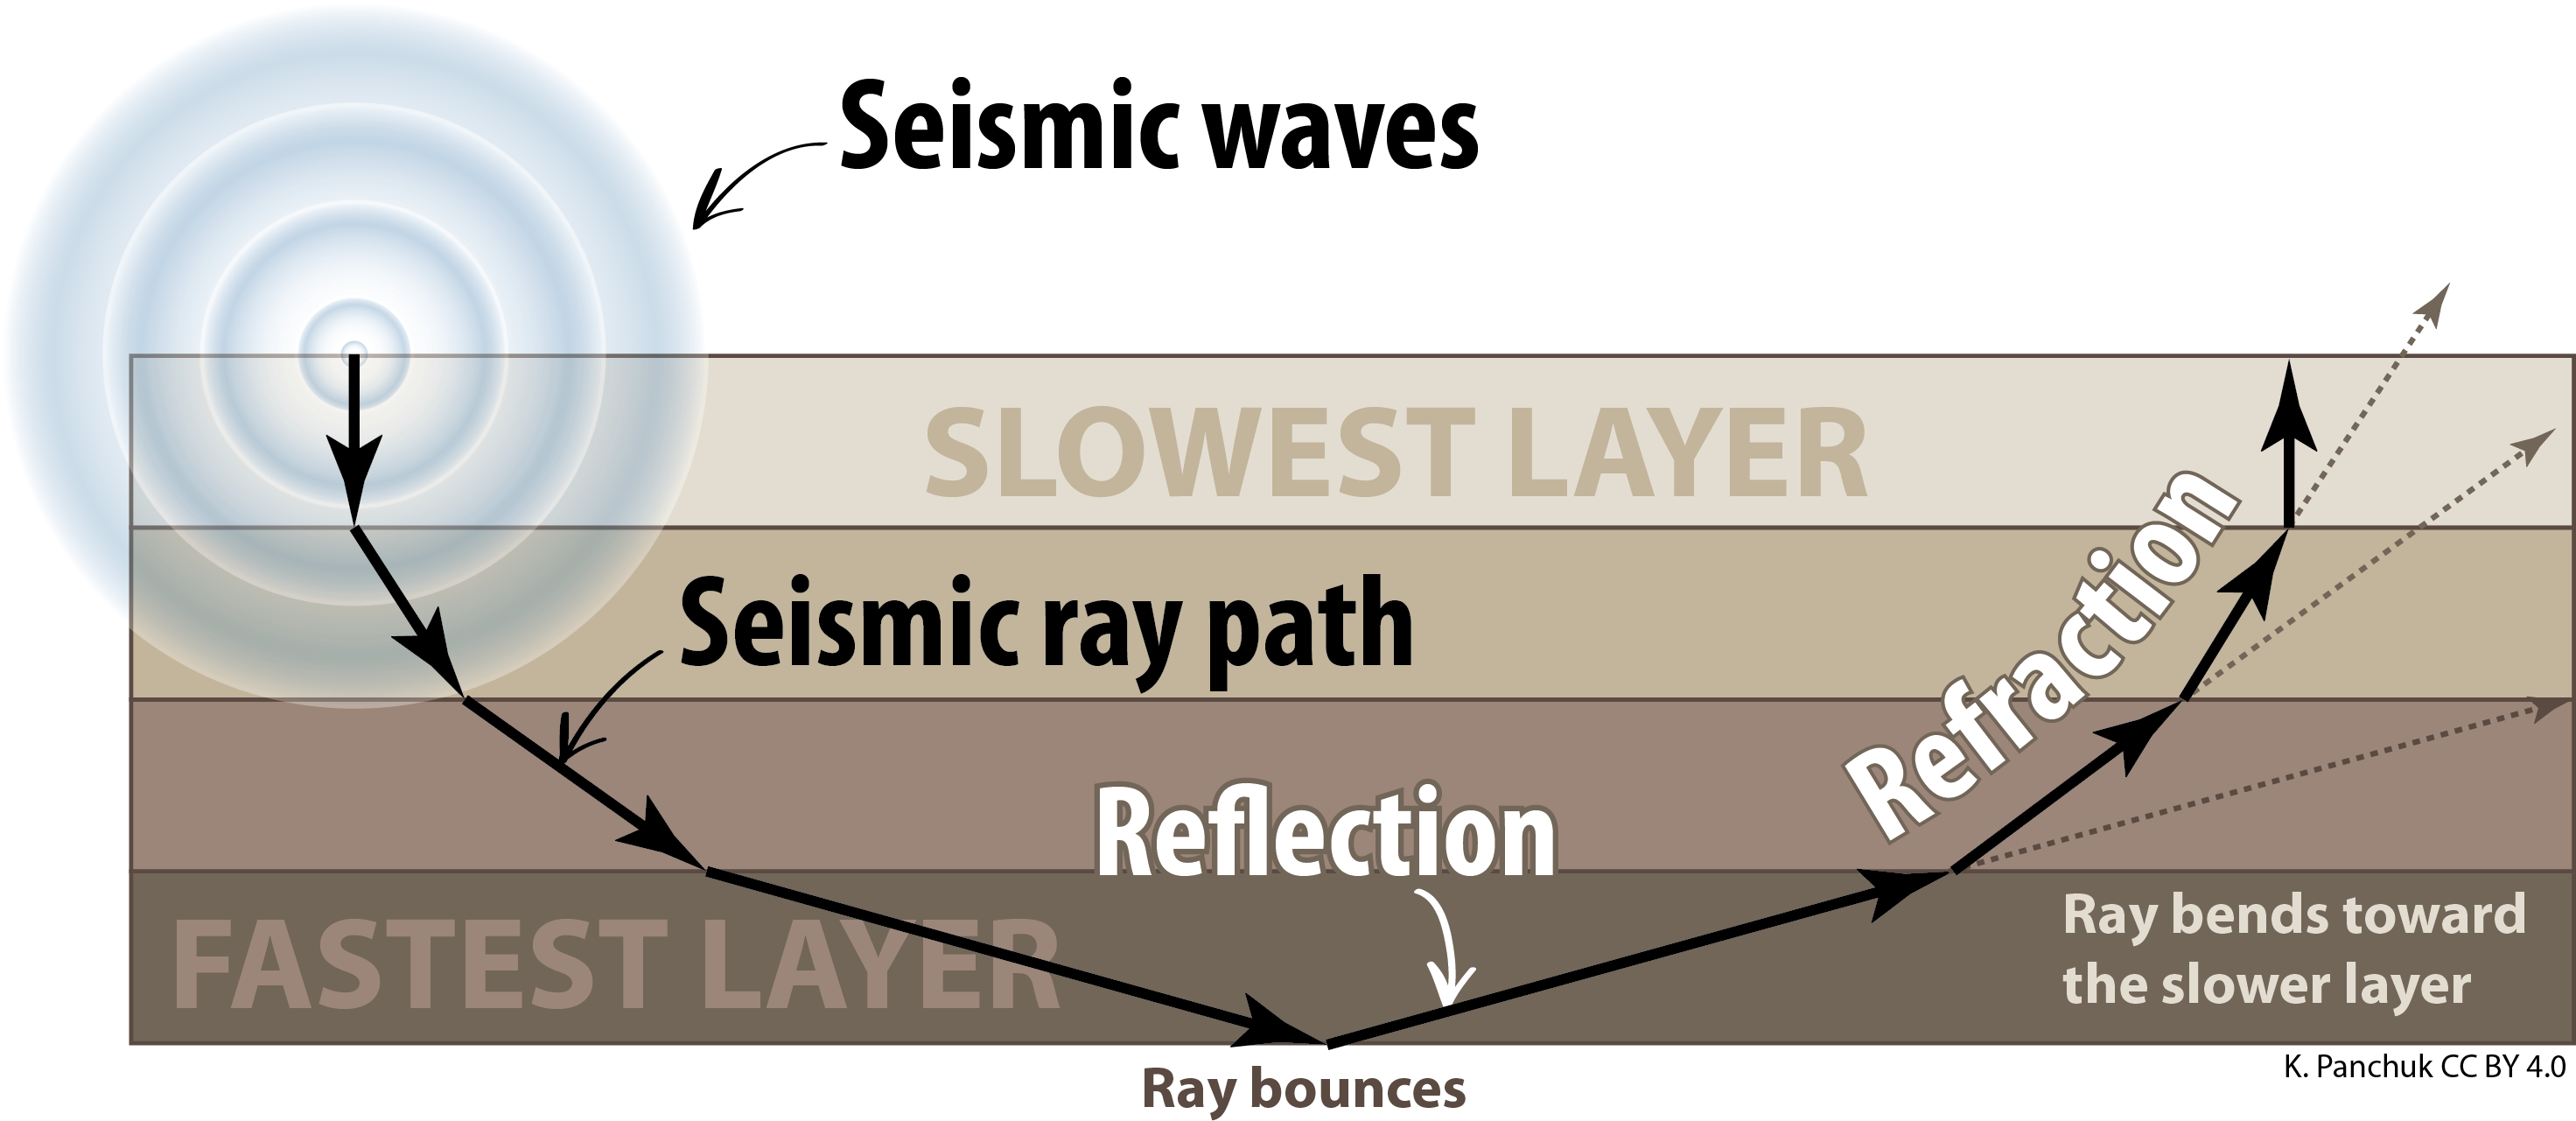
When seismic waves encounter a different rock layer, some might bounce off the layer, or reflect. But some waves will travel through the layer. If the wave travels at a different speed in the new layer, its path will be bent, or refracted, as it crosses into the new layer. If the wave can travel faster in the new layer, it will be bent slightly toward the slower layers. In Figure 3.5, this bending causes the ray to go at a shallower and shallower angle on the way down, and then at progressively steeper angles on the way up.
Seismic velocities are higher in more rigid layers, and higher pressures tend to make layers more rigid. Pressure increases with depth within the Earth, so broadly speaking, seismic waves can gofaster deeper within the Earth. Over all, seismic rays tend to take curved paths through the Earth because refraction bends their path until they’re reflected and directed upward again, as in Figure 3.5.
Discoveries with Seismic Waves
The Moho: Where Crust Meets Mantle
In the early 1900s, Croatian seismologist Andrija Mohorovičić (pronounced Moho-ro-vi-chich) made one of the first seismology-related discoveries about Earth’s interior. He noticed that sometimes, seismic waves were detected at seismic stations (measuring locations) farther from an earthquake before they were detected at stations closer to the earthquake. He reasoned that the waves that traveled farther were faster because they bent down deep enough to get into different rocks where they could travel much faster (those of the mantle) before being bent upward back into the crust (Figure 3.6).
An analogy would be hiking in the wilderness and deciding that instead of taking a long winding trail, you’ll take a shortcut through a swamp. Except you underestimate how slow going it will be through the very muddy swamp, and it turns out you would have completed the hike faster if you’d stuck with the longer trail.
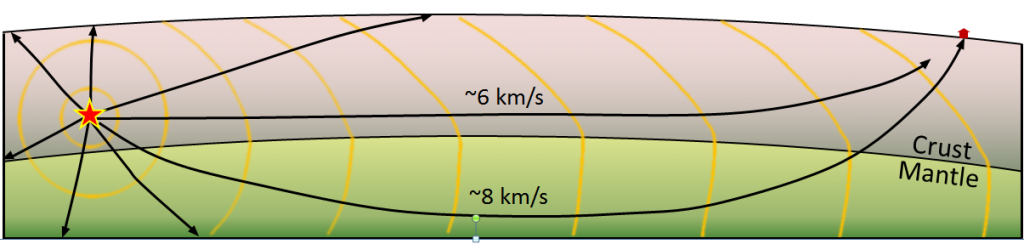
The boundary between the crust and the mantle is now known as the Mohorovičić discontinuity (or Moho). Its depth is between 60 – 80 km beneath major mountain ranges, 30 – 50 km beneath most of the continental crust, and 5 – 10 km beneath ocean crust.
Concept Check: Where Is the Moho?
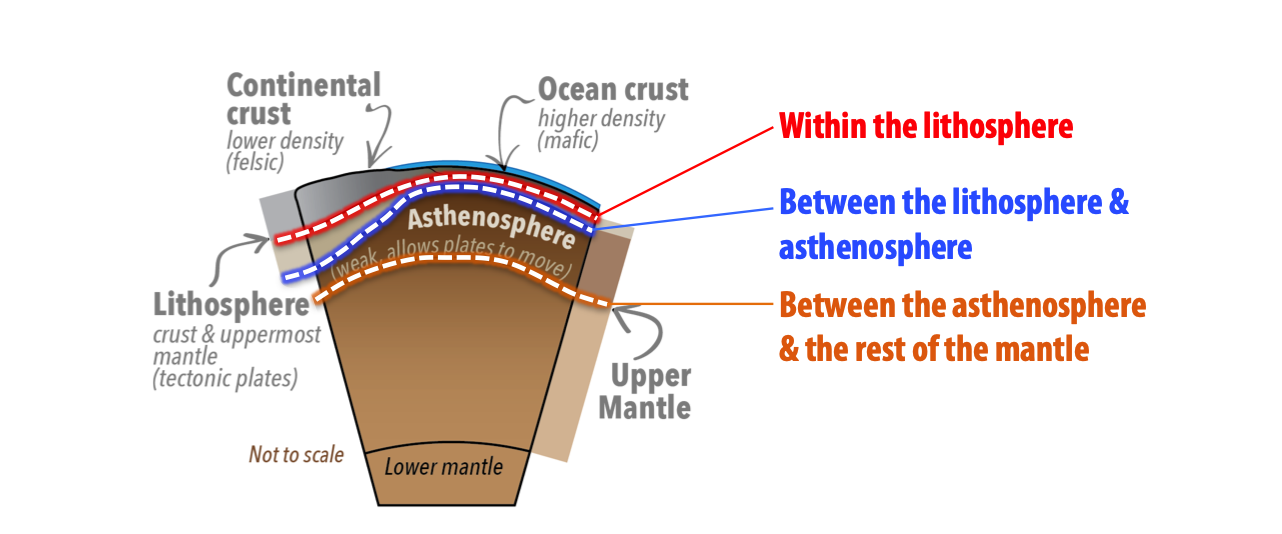 Where is the Moho located? Choose one option.
- Within the lithosphere, and therefore within tectonic plates
- At the base of tectonic plates, between the lithosphere and asthenosphere
- It marks the sharp contrast between the weak asthenosphere and the rigid part of the upper mantle immediately beneath it.
To check your answers, navigate to the below link to view the interactive version of this activity.
The Core-Mantle Boundary
Arguments for a liquid outer core were supported by a distinctive signature in the global distribution of seismic waves from earthquakes. When an earthquake occurs, there is a zone on the opposite side of Earth where S-waves are not measured. This S-wave shadow zone begins 103° on either side of the earthquake (Figure 3.7, left). There is also a P-wave shadow zone on either side of the earthquake, from 103° to 150° (Figure 3.7, right).
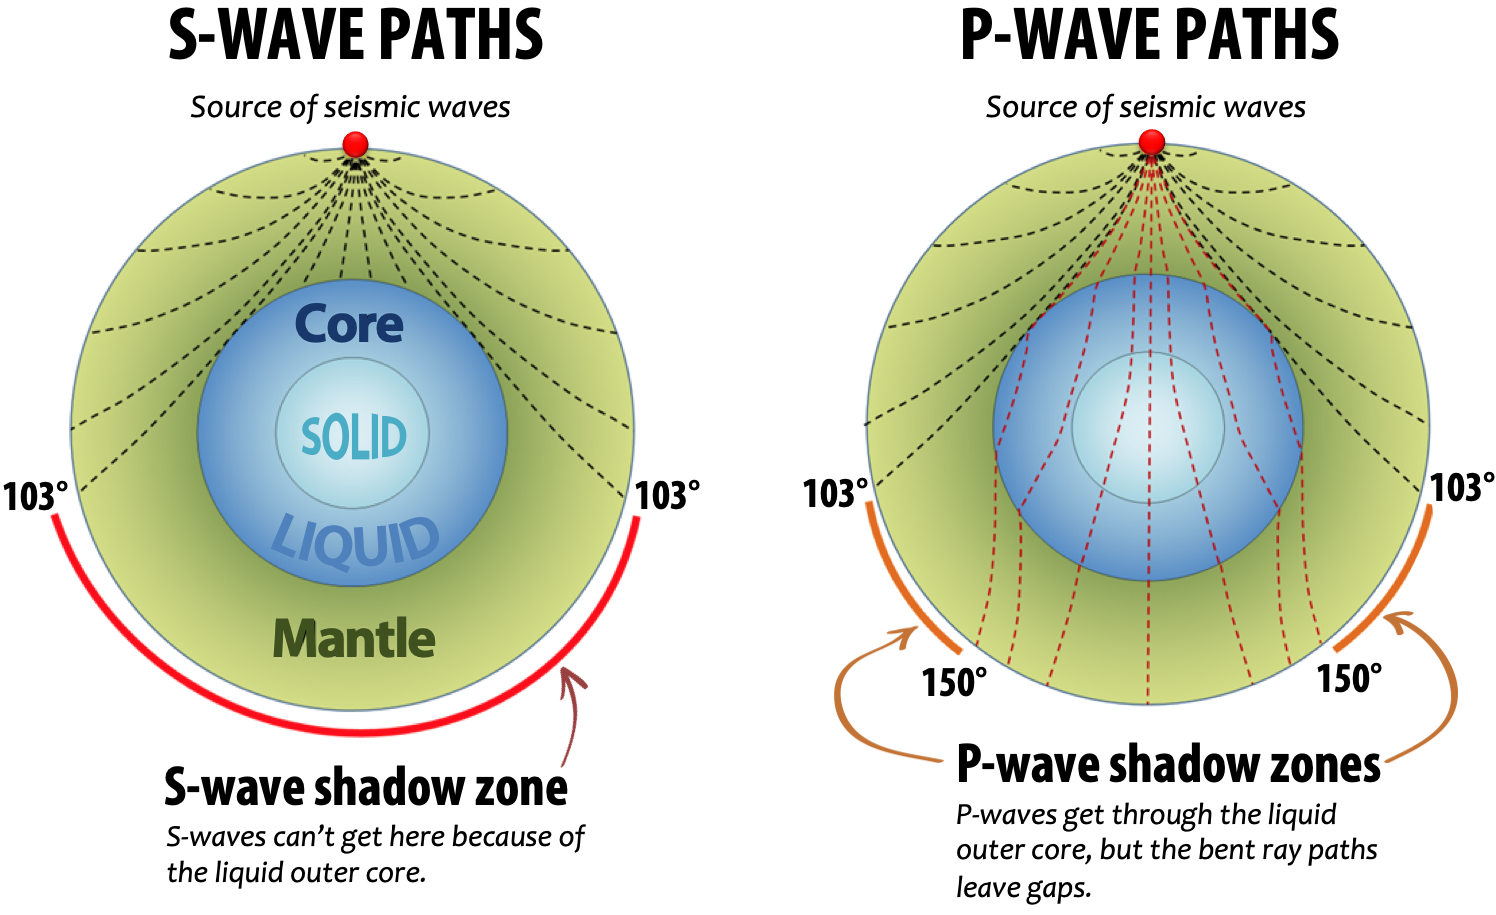
The S-wave shadow zone occurs because S-waves can’t t travel through the liquid outer core. The P-wave shadow zone occurs because seismic velocities are much lower in the liquid outer core than in the overlying mantle, so the P-waves are refracted in a way that leaves a gap. Not only do the shadow zones tell us that the outer core is liquid, the size of the shadow zones allows us to calculate the size of the core, and the location of the core-mantle boundary.
Concept Check: Liquid Cores of Other Planets
How big are the cores of Planet A and Planet B? Bigger or smaller than Earth’s core? Use the S-wave shadow zone example for Earth to figure it out.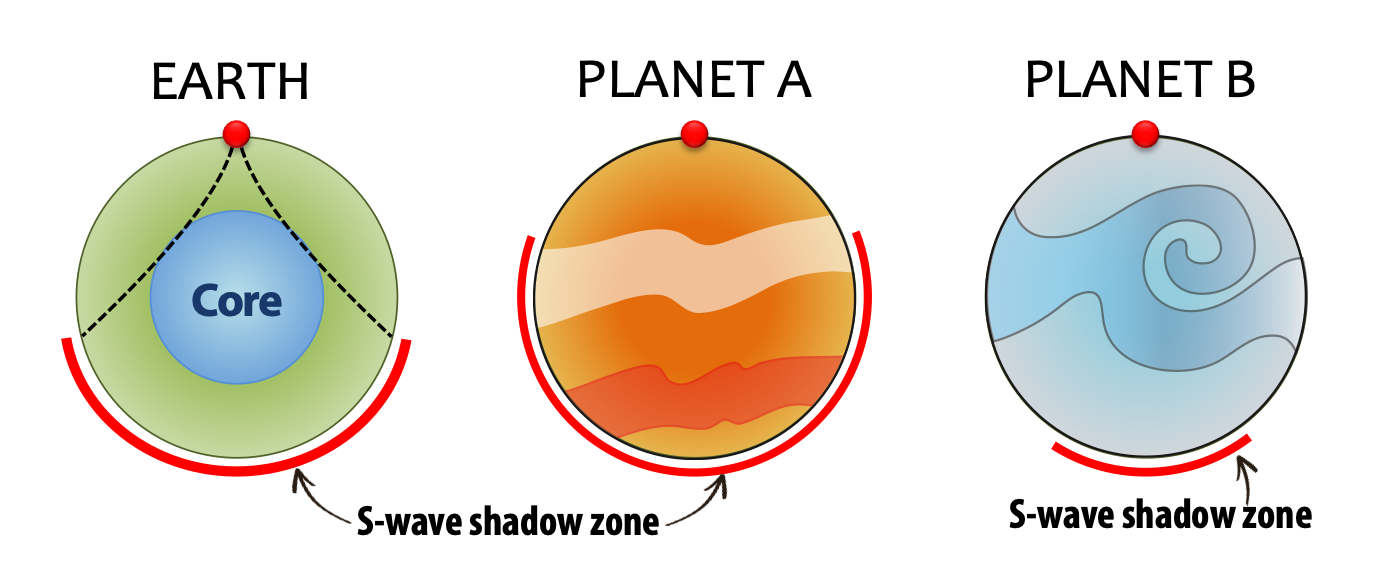
Look through the following images to see the answers.
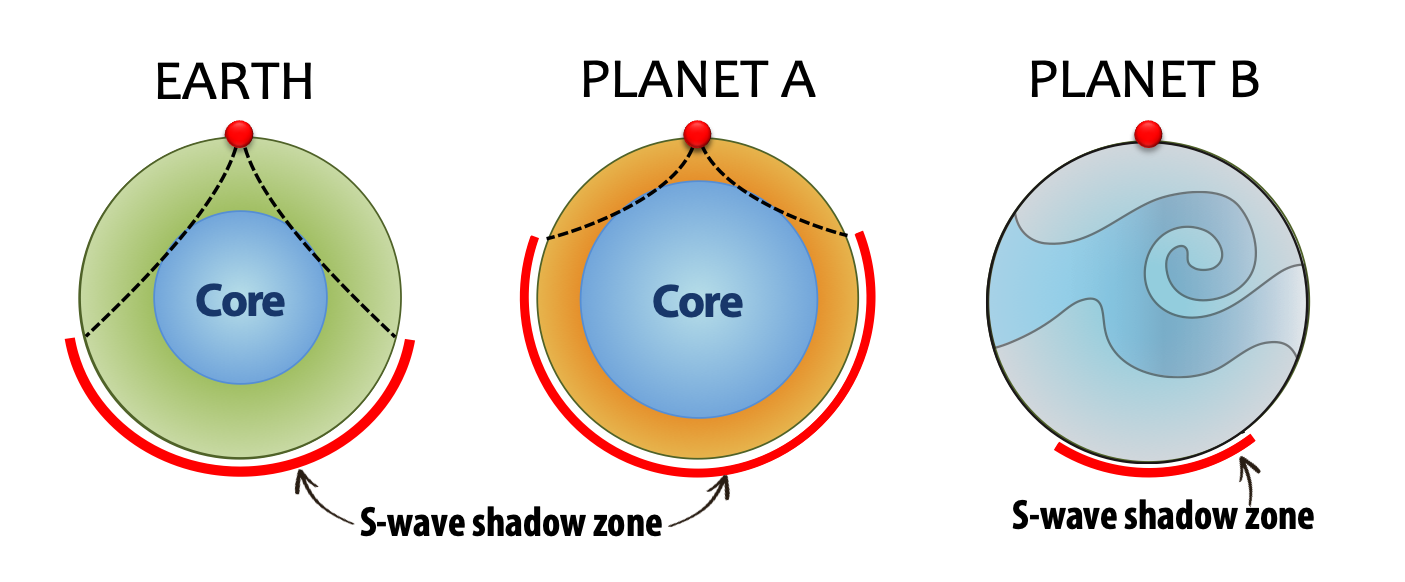
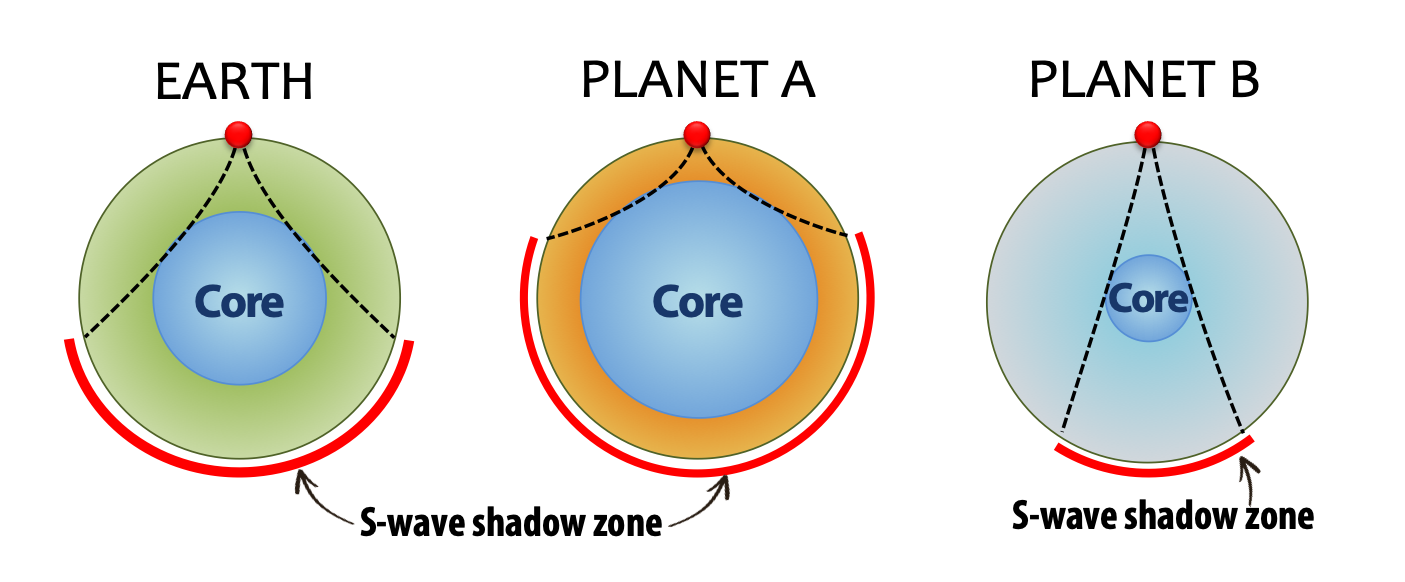
Explanation
The bigger the shadow zone, the larger diameter of the core. The starting point of the shadow zone depends on how close the core is to the source of the seismic signal. The closer the core, the sooner the S-waves will run into liquid, limiting how deep the S-waves can go, and thus how far around the planet they can be detected.
Seismic Portrait of Earth’s Layers
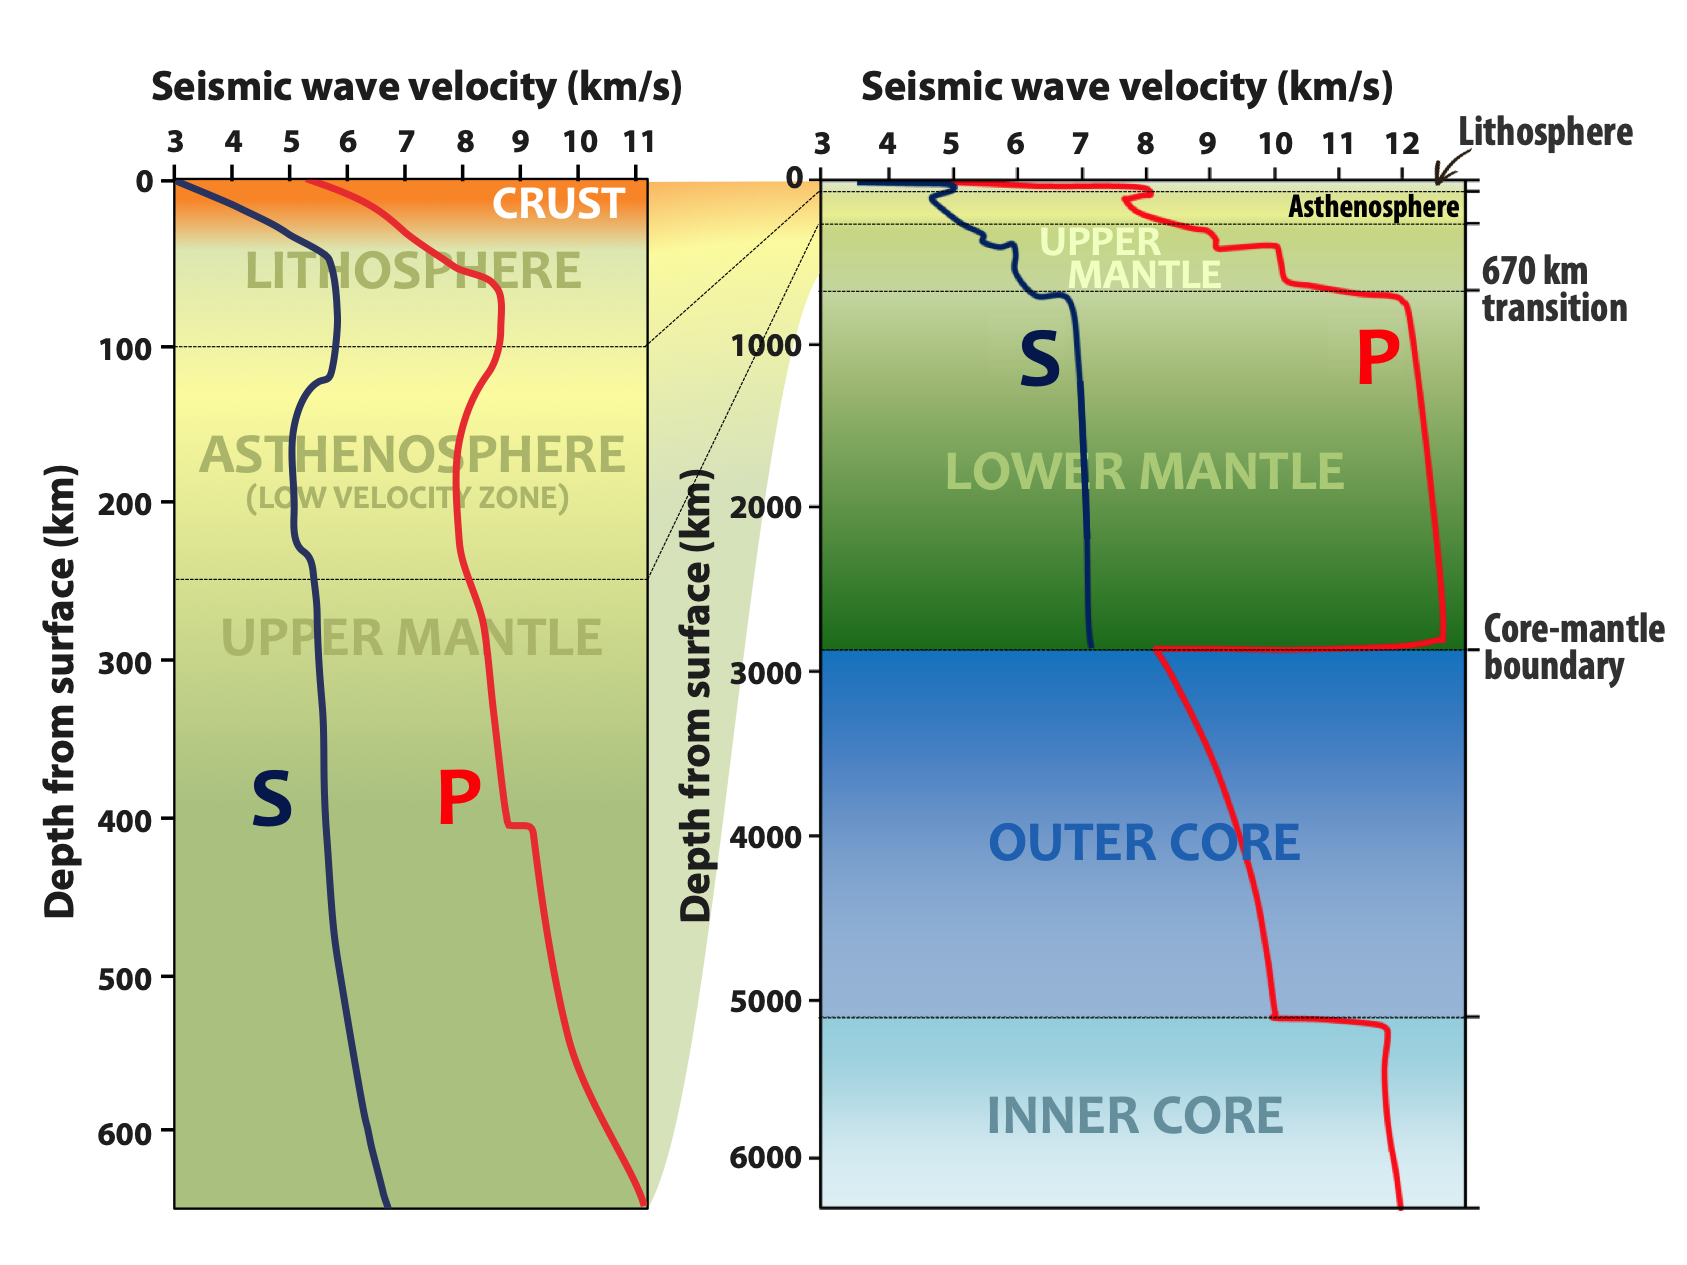
The change seismic wave velocity with depth in Earth (Figure 3.8) has been determined over the past several decades by analyzing seismic signals from large earthquakes all around the world. Earth’s layers are detectable as changes in velocity with depth. Key features are the following:
- The asthenosphere is visible as a low velocity zone within the upper mantle.
- There is an abrupt increase in P-wave velocity at 420 km, showing the depth at which minerals transform into structures that are more stable at higher pressures and temperatures.
- The boundary between the upper and lower mantle is visible at 670 km as a sudden change from rapidly increasing P- and S-wave velocities to slow or no change in P-wave and S-wave velocities.
- The core-mantle boundary is apparent as a sudden drop in P-wave velocities, where seismic waves move from solid mantle to liquid outer core.
- The boundary between the outer core and inner core is marked by a sudden increase in P-wave velocity after 5000 km, where seismic waves move from a liquid back into a solid again.
Concept Check: Seismic Velocity Changes
Where are the most abrupt changes in seismic velocity in Earth’s interior, and what causes them?
The most abrupt changes happen at the top and bottom boundaries of the outer core. Velocities drop suddenly going from the solid mantle to the liquid outer core, then increase suddenly moving back into the solid material of the inner core.
Seismic Images of Plate Tectonic Structures
Using data from many seismometers and hundreds of earthquakes, it’s possible to create images from the seismic properties of the mantle. This technique is known as seismic tomography. Tomography can be used to map out slabs of lithosphere that are entering the mantle, or have disappeared within it. Those slabs are cooler, and therefore more rigid than surrounding mantle rocks, so seismic waves travel through them faster. In Figure 3.9, higher-than-average seismic velocities in cool slabs are indicated in dark blue.
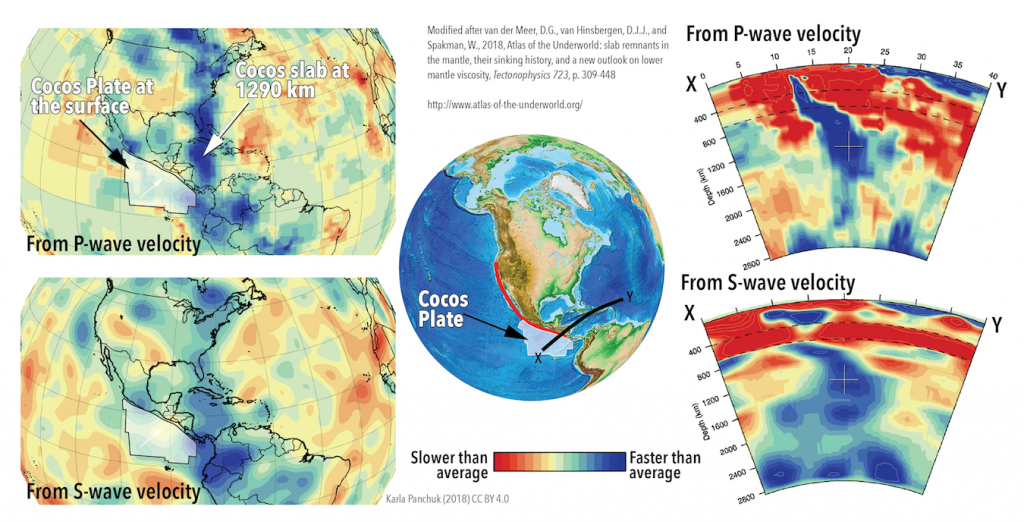
Thanks to the tomograms, we can see that the Cocos plate—which is colliding with Central America—is part of a much larger slab of lithosphere that has already settled onto the mantle. Tomograms representing a surface at 1290 km depth (Figure 3.9, left) show that at that level, the Cocos slab is beneath the Caribbean Sea. The tomograms on the right show a vertical view along the line X-Y marked on the globe. The vertical tomograms show us that the Cocos slab extends all the way down to the core-mantle boundary.
Visit the Underworld
What is the Atlas of the Underworld?
The Atlas of the Underworld is a catalog of more than 90 slabs of lithosphere that have been imaged within the mantle using seismic tomography. The Atlas includes tomographic images, locator maps, and geological histories for each slab. The catalog can be searched online at Atlas of the Underworld or viewed in the original publication by van der Meer et al. (2018). The Atlas of the Underworld is an open-access resource. Visit the Atlas of the Underworld
The HADES Underworld Explorer
Create your own tomographic cross-sections for locations anywhere in the world by using this intuitive drag-and-drop tool. Visit the HADES Underworld Explorer
References
van der Meer, D.G., van Hinsbergen, D.J.J., and Spakman, W., (2018). Atlas of the Underworld: slab remnants in the mantle, their sinking history, and a new outlook on lower mantle viscosity. Tectonophysics, 723, 309-448. https://doi.org/10.1016/j.tecto.2017.10.004
