12.2 Seismic Waves and Measuring Earthquakes
The shaking from an earthquake travels away from the rupture in the form of seismic waves. Seismic waves are measured to determine the location of the earthquake, and to estimate the amount of energy released by the earthquake (its magnitude).
Types of Seismic Waves
Seismic waves are classified according to where they travel, and how they move particles.
Body Waves
Seismic waves that travel through Earth’s interior are called body waves. P-waves are body waves that move by alternately compressing and stretching materials in the direction the wave moves. For this reason, P-waves are also called compression waves. The “P” in P-wave stands for primary, because P-waves are the fastest of the seismic waves. They are the first to be detected when an earthquake happens.
A P-wave can be simulated by fixing one end of a spring to a solid surface, then giving the other end a sharp push toward the surface (Figure 12.8, top). The compression will propagate (travel) along the length of the spring. Some parts of the spring will be stretched, and others compressed. Any one point on the spring will jiggle forward and backward as the compression travels along the spring.
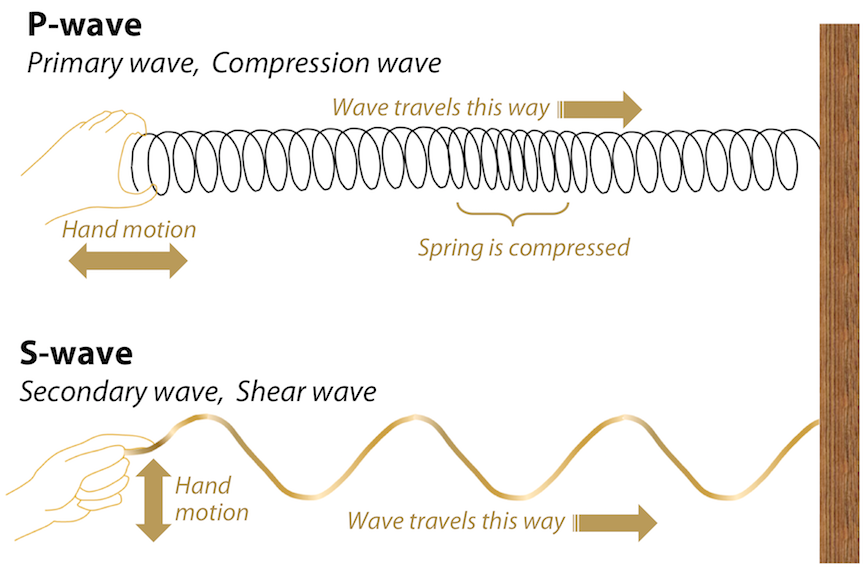
S-waves are body waves that move with a shearing motion, shaking particles from side to side. S-waves can be simulated by fixing one end of a rope to a solid surface, then giving the other end a flick (Figure 12.8, bottom). Any one point on the rope will move from side to side at a right angle to the direction in which the snaking motion is traveling. The “S” in S-wave stands for secondary, because S-waves are slower than P-waves, and are detected after the P-waves are measured. S-waves cannot travel through liquids.
P-waves and S-waves can travel rapidly through geological materials, at speeds many times the speed of sound in air.
Surface Waves
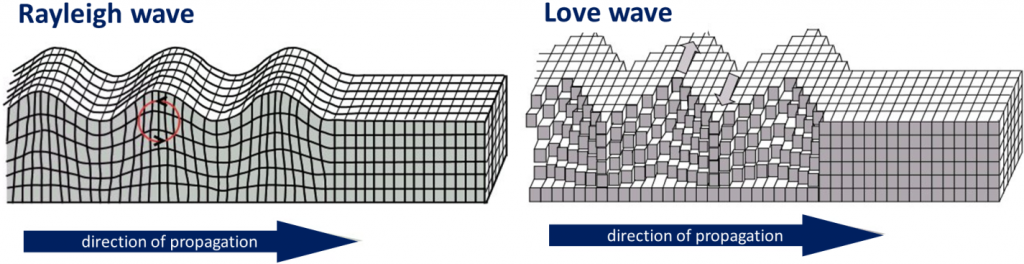
When body waves reach Earth’s surface, some of their energy is transformed into surface waves, which travel along Earth’s surface. Two types of surface waves are Rayleigh waves and Love waves (Figure 12.9). Rayleigh waves (R-waves) are characterized by vertical motion of the ground surface, like waves rolling on water. Love waves (L-waves) are characterized by side-to-side motion. Notice that the effects of both kinds of surface waves diminish with depth in Figure 12.9.
Surface waves are slower than body waves, and are detected after the body waves. Surface waves typically cause more ground motion than body waves, and therefore do more damage than body waves.
Concept Check: Seismic Wave Types
Fill in the blanks to complete this summary of types of seismic waves.
-waves (hint: P, S, R, or L?) are (hint: fast or slow?) body waves that move by compressing and stretching rock.
-waves (hint: P, S, R, or L?) are (hint: fast or slow?) body waves that move by shearing rock.
-waves (hint: P, S, R, or L?) are surface waves that produce a rolling motion.
-waves (hint: P, S, R, or L?) are surface waves that produce a side-to-side motion.
To check your answers, navigate to the below link to view the interactive version of this activity.
Recording Seismic Waves Using a Seismograph
A seismometer is an instrument that detects seismic waves. An instrument that combines a seismometer with a device for recording the waves is called a seismograph. The graphical output from a seismograph is called a seismogram. Figure 12.10 (right) shows how a seismograph works. The instrument consists of a frame or housing that is firmly anchored to the ground. A mass is suspended from the housing, and can move freely on a spring. When the ground shakes, the housing shakes with it, but the mass remains fixed. A pen attached to the mass moves up and down on a rotating drum of paper, drawing a wavy line, the seismogram. The seismograph in Figure 12.10 (right) is oriented to measure vertical ground motion. The photo on the left shows a seismograph oriented to record horizontal ground motion.

The pen and drum of a mechanical seismograph record the motion of the ground relative to the mass. However, unless an earthquake causes a large amount of ground motion directly beneath the seismograph, the height of the wave recorded on paper might be very small, making the seismogram difficult to analyze. The seismograph on the right has a device to amplify the ground motion, drawing larger waves that are easier to study.
Modern seismographs record shaking as electrical signals, and are able to transmit those signals. This means seismologists need not return to the instrument to collect recordings before the records can be examined.
Finding The Location of an Earthquake
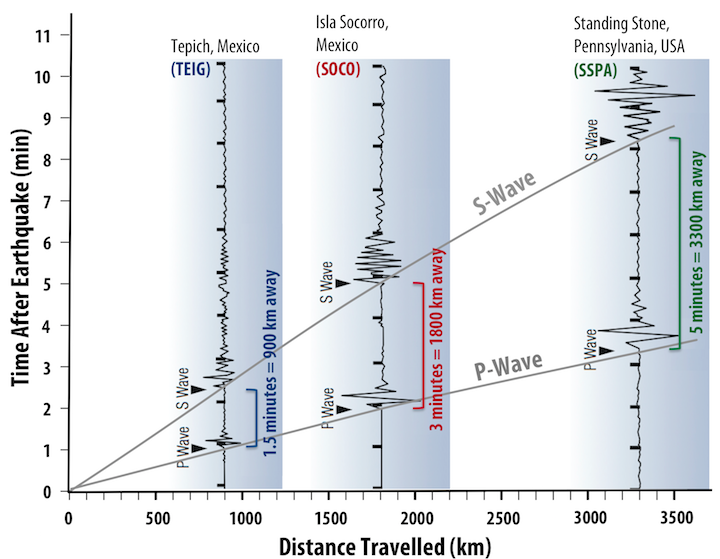
P-waves travel faster than S-waves. As the waves travel away from the location of an earthquake, the P-wave gets farther and farther ahead of the S-wave. Therefore, the farther a seismograph is from the location of an earthquake, the longer the delay between when the P-wave arrival is recorded, and the S-wave arrival is recorded. The delay between the P-wave and S-wave arrival appears as a widening gap in a diagram of P-wave and S-wave travel times (Figure 12.11, grey lines).
P-wave and S-wave arrival times can be identified on seismograms. In the three seismograms in Figure 12.11, the arrivals of the P-waves and S-waves are marked with arrows, and the interval in minutes between the P-wave and S-wave arrivals are noted. The seismograms were recorded at three different seismic stations (earthquake monitoring locations equipped with seismographs). The distance of each station from the earthquake is determined by finding the distance along the graph where the gap between the P-wave and S-wave travel-time curves matches the delay between P-wave and S-wave arrivals on the seismogram.
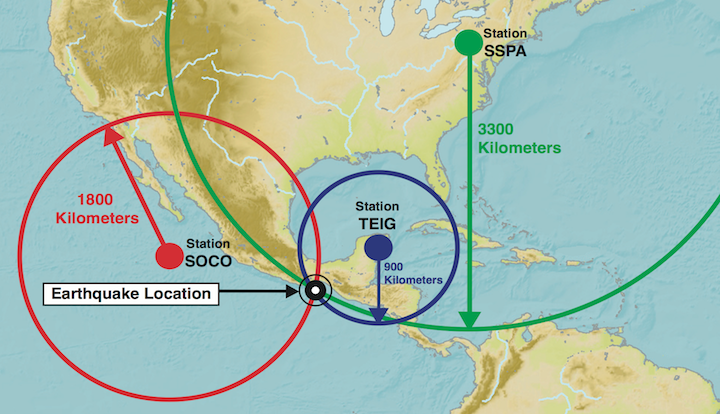
The delay between the P-wave and S-wave arrival at a seismic station can indicate how far the station is from the source of the earthquake, but not the direction the seismic waves came from. The possible locations of the earthquake can be represented on a map by drawing a circle around the seismic station, with the radius of the circle being the distance determined from the P-wave and S-wave travel times (Figure 12.12). If this is done for at least three seismic stations, the circles will intersect at the origin of the earthquake. This method is called triangulation.
Concept Check: Finding the Location of an Earthquake
Fill in the blanks to complete this description of how earthquakes are located by triangulation.
The -waves (hint: P or S) generated by an earthquake are faster than -waves (hint: P or S). The farther seismic waves have to travel before reaching a seismic (hint: a monitoring location with a seisometer), the more the fast waves will gain on the slow ones, and the longer we have to wait after the fast waves arrive to see the slow ones. We can use that lag to figure out how far away the earthquake was.
This information gives us the (hint: direction or distance?) to the earthquake, but not the (hint: direction or distance?). To find the actual location, we need the lag information measured from at least (hint: how many?) locations. Then we can draw a circle from each location with a radius that matches the (hint: direction or distance?) we figured out. The location of the earthquake is where all of the circles (hint: geometry term for crossing).
To check your answers, navigate to the below link to view the interactive version of this activity.
How Big Was It?
Earthquakes can be described in terms of their magnitude, which reflects the amount of energy released by the shaking. They can also be described in terms of intensity, which characterizes the impact of the shaking on people and their surroundings.
Earthquake Magnitude
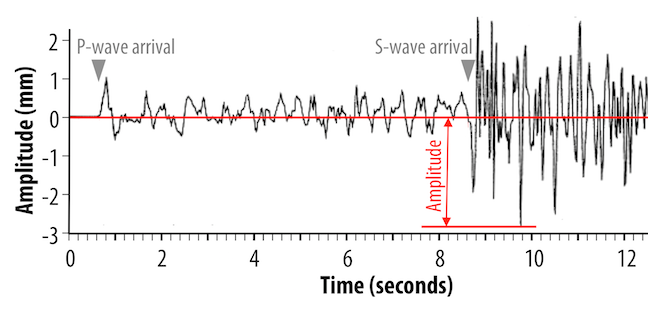
Earthquake magnitudes are determined by measuring the amplitudes of seismic waves. The amplitude is the height of the wave relative to the baseline (Figure 12.13). Wave amplitude depends on the amount of energy carried by the wave. The amplitudes of seismic waves reflect the amount of energy released by earthquakes.
The Richter magnitude scale uses the amplitudes of S-waves, and corrects for the decrease in amplitude that happens as the waves travel away from their source. The correction depends on how seismic waves interact with the specific rock types through which they travel, and therefore on local conditions, so the Richter magnitude is also referred to as the local magnitude.
While news reports about earthquakes might still refer to the “Richter scale” when describing magnitudes, the number they report is most likely the moment magnitude. The moment magnitude is calculated from the seismic moment of an earthquake. The seismic moment takes into account the surface area of the region that ruptured, how much displacement occurred, and the stiffness of the rocks. Moment magnitude can capture the difference between short earthquakes and longer ones resulting from larger ruptures, even of both types of earthquakes generate the same amplitude of waves. The moment magnitude scale is also better for earthquakes that are far from the seismic station. Seismic wave measurements are still used to determine the moment magnitude, however different waves are used than for the local magnitude scale.
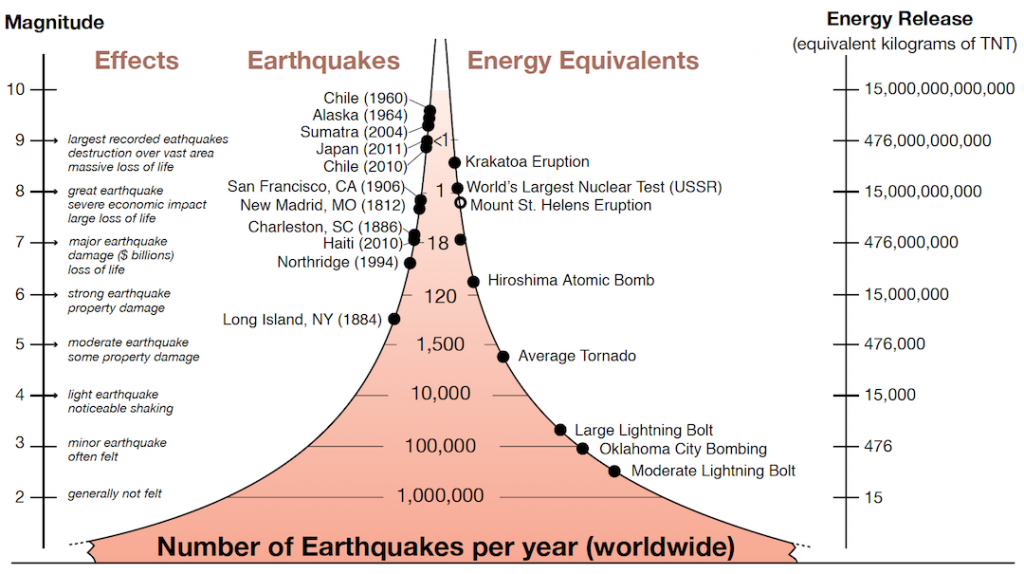
The magnitude scale is a logarithmic one rather than a linear one- an increase of one unit of magnitude corresponds to a 32 times increase in energy release (Figure 12.14). There are far more low-magnitude earthquakes than high-magnitude earthquakes. In 2017 there were 7 earthquakes of M7 (magnitude 7) or greater, but millions of tiny earthquakes.
Earthquake Intensity
Intensity scales were first used in the late 19th century, and then adapted in the early 20th century by Giuseppe Mercalli and modified later by others to form what we now call the Modified Mercalli Intensity Scale (Table 12.1). To determine the intensity of an earthquake, reports are collected about what people felt and how much damage was done. The reports are then used to assign intensity ratings to regions where the earthquake was felt.
| Severity | Details |
|---|---|
| I Not felt | Not felt except by a very few under especially favourable conditions |
| II Weak | Felt only by a few persons at rest, especially on upper floors of buildings |
| III Weak | Felt quite noticeably by persons indoors, especially on upper floors of buildings; many people do not recognize it as an earthquake; standing motor cars may rock slightly; vibrations similar to the passing of a truck; duration estimated |
| IV Light | Felt indoors by many, outdoors by few during the day; at night, some awakened; dishes, windows, doors disturbed; walls make cracking sound; sensation like heavy truck striking building; standing motor cars rocked noticeably |
| V Moderate | Felt by nearly everyone; many awakened; some dishes, windows broken; unstable objects overturned; pendulum clocks may stop |
| VI Strong | Felt by all, many frightened; some heavy furniture moved; a few instances of fallen plaster; damage slight |
| VII Very Strong | Damage negligible in buildings of good design and construction; slight to moderate in well-built ordinary structures; considerable damage in poorly built or badly designed structures; some chimneys broken |
| VIII Severe | Damage slight in specially designed structures; considerable damage in ordinary substantial buildings with partial collapse; damage great in poorly built structures; fall of chimneys, factory stacks, columns, monuments, walls; heavy furniture overturned |
| IX Violent | Damage considerable in specially designed structures; well-designed frame structures thrown out of plumb; damage great in substantial buildings, with partial collapse; buildings shifted off foundations |
| X Extreme | Some well-built wooden structures destroyed; most masonry and frame structures destroyed with foundations; rails bent |
| XI Extreme | Few, if any (masonry), structures remain standing; bridges destroyed; broad fissures in ground; underground pipelines completely out of service; earth slumps and land slips in soft ground; rails bent greatly |
| XII Extreme | Damage total; waves seen on ground surfaces; lines of sight and level distorted; objects thrown upward into the air |
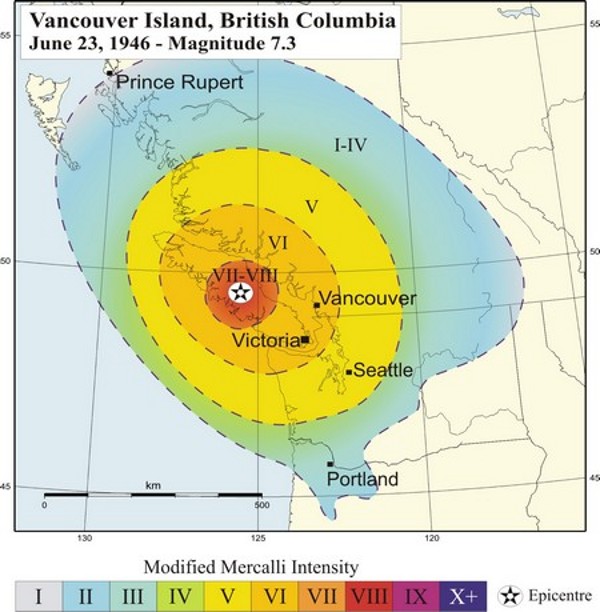
Intensity values are assigned to locations, rather than to the earthquake itself. This means that intensity can vary for a given earthquake, depending on the proximity to the epicentre and local conditions. For the 1946 M7.3 Vancouver Island earthquake, intensity was greatest in the central island region (Figure 12.15). In some communities within this region, chimneys were damaged on more than 75% of buildings. Some roads were made impassable, and a major rock slide occurred. The earthquake was felt as far north as Prince Rupert, as far south as Portland Oregon, and as far east as the Rockies, but with less intensity.
Intensity estimates are important as a way to identify regions that are especially prone to strong shaking. A key factor is the nature of the underlying geological materials. The weaker the underlying materials, the more likely it is that there will be strong shaking. Areas underlain by strong solid bedrock tend to experience far less shaking than those underlain by unconsolidated river or lake sediments.
An example of this effect is the 1985 M8 earthquake that struck the Michoacán region of western Mexico, southwest of Mexico City. There was relatively little damage near the epicentre, but 350 km away in heavily populated Mexico City there was tremendous damage and approximately 5,000 deaths. The reason is that Mexico City was built largely on the unconsolidated and water-saturated sediment of former Lake Texcoco. These sediments resonate at a frequency of about two seconds, which was similar to the frequency of the body waves that reached the city. Consequently, the shaking was amplified. Survivors of the disaster recounted that the ground in some areas moved up and down by approximately 20 cm every two seconds for over two minutes. Damage was greatest to buildings between 5 and 15 storeys tall, because they also resonated at around two seconds, which amplified the shaking.
Try It: Modified Mercalli Intensity Scale
References
Ammon, C. J. (2001). Earthquake size. http://eqseis.geosc.psu.edu/~cammon/HTML/Classes/IntroQuakes/Notes/earthquake_size.html
- Source: U. S. Geological Survey (1989). The severity of an earthquake. USGS General Interest Publication, 1989-288-913 ↵
