3.3 Earth’s Interior Heat
Earth Is Hot Inside
How hot? At the base of the crust, it’s approximately 1000°C. At the base of the mantle, temperatures are around 3500°C. Earth’s centre is more than 6000°C.
Earth’s heat comes from two main sources: physical processes early in its formation, and radioactive decay.
Physical Processes that Heated Earth
Formation processes contributed heat in the following ways:
- Heat came from the thermal energy already contained within the objects that accreted to form Earth.
- Heat came from collisions. When objects hit Earth, some of the energy from their motion went into deforming Earth, and some of it was transformed into heat. Clap your hands vigorously to experience this on a much smaller (and safer!) scale.
- As Earth became larger, its gravitational force became stronger. This increased Earth’s ability to draw objects to it, but it also caused the material making Earth to be compressed, rather like Earth giving itself a giant gravitational hug. Compression causes materials to heat up.
Heating had an important consequence for Earth’s structure, because it eventually permitted differentiation to take place. Earth got so hot that iron and nickel mixed in with silicate minerals melted, and tricked toward Earth’s centre to form its core. Differentiation itself heated Earth even more due to friction from metal melts moving through Earth.
Atoms Break Apart and Release Energy
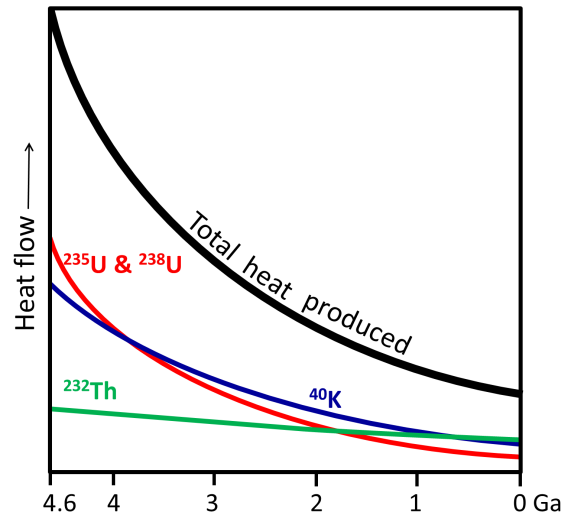
A major source of Earth’s heat is radioactivity, the energy released when the unstable atoms decay (their nucleus breaks apart, or they lose particles from their nucleus). The main source of the radiation heating Earth is the decay of the radioactive isotopes uranium-235 (235U), uranium-238 (238U), potassium-40 (40K), and thorium-232 (232Th) in Earth’s mantle.
Radioactive decay produced more heat early in Earth’s history than it does today, because the more decay that happened, the fewer radioactive atoms were left to decay in the future. Heat contributed by radioactivity today is roughly a quarter what it was when Earth formed (Figure 3.10).

Earth Gets Hotter the Deeper You Go
Earth’s temperature increases with depth, but not uniformly (Figure 3.11). Earth’s geothermal gradient is 15° to 30°C/km within the crust. It then drops off dramatically through the mantle, increases more quickly at the base of the mantle, and then increases slowly through the core.
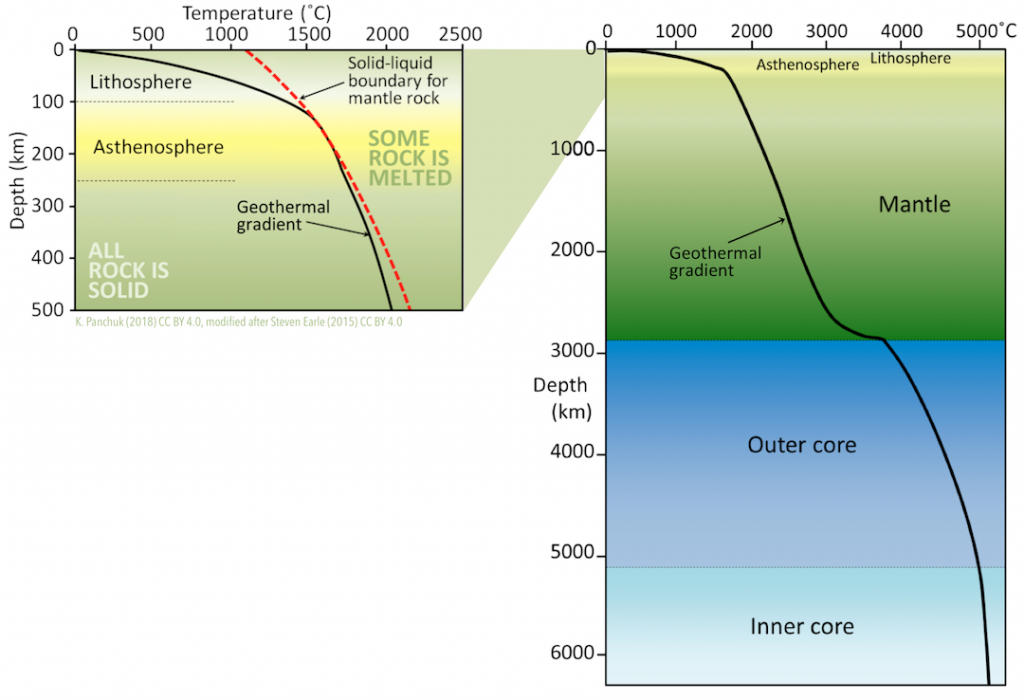
The temperature gradient within the lithosphere varies depending on the plate tectonic setting. Gradients are lowest in the central parts of continents. They are higher where plates collide, and higher still at boundaries where plates are moving away from each other.
In spite of high temperatures within Earth, mantle rocks are almost entirely solid. This is because high pressures keep them from melting. The red dashed line in Figure 3.11 (right) shows the minimum temperature at which dry mantle rocks will melt. Rocks at temperatures to the left of the line will remain solid. In rocks at temperatures to the right of the line, some minerals will begin to melt. Notice that the red dashed line goes further to the right for greater depths, and therefore greater pressures. Now compare the geothermal gradient with the red dashed line. The geothermal gradient is to the left of the red line, except in the asthenosphere, where small amounts of melt are present.
Convection Helps to Move Heat Within Earth
The fact that the temperature gradient is much lower in the main part of the mantle than in the lithosphere has been interpreted as evidence of convection in the mantle. When the mantle convects, heat is transferred through the mantle by physically moving hot rocks. Mantle convection is the result of heat transfer from the core to the base of the lower mantle.
As with a pot of soup on a hot stove (Figure 3.12), the material near the heat source (the soup at the bottom of the pot) becomes hot and expands, making it less dense than the material above. Buoyancy causes it to rise, and cooler material flows in from the sides. Of course, convection in the soup pot is much faster than convection in the mantle. Mantle convection occurs at rates of centimetres per year.
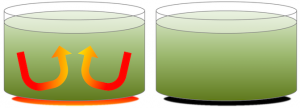
Convection carries heat to the surface of the mantle much faster than heating by conduction. Conduction is heat transfer by collisions between molecules, and is how heat is transferred from the stove to the soup pot. A convecting mantle is an essential feature of plate tectonics, because the higher rate of heat transfer is necessary to keep the asthenosphere weak.
Earth’s mantle will stop convecting once the core has cooled to the point where there is not enough heat transfer to overcome the strength of the rock. This has already happened on smaller planets like Mercury and Mars, as well as on Earth’s moon. When mantle convection stops, the end of plate tectonics will follow.
Models of Mantle Convection
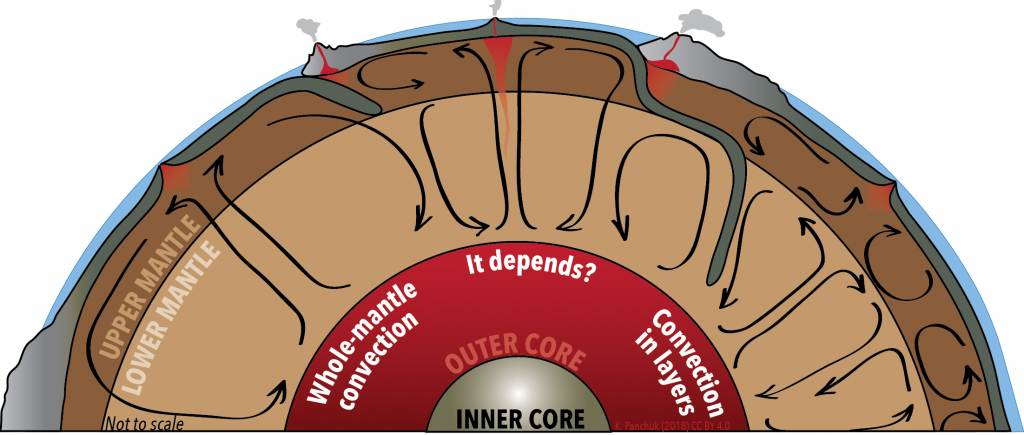
In the soup pot example, convection moves hot soup from the bottom of the pot to the top. Some geologists think that Earth’s convection works the same way—hot rock from the base of the mantle moves all the way to the top of the mantle before cooling and sinking back down again. This view is referred to as whole-mantle convection (Figure 3.13, left).
Other geologists think that the upper and lower mantle are too different to convect as one. They point to slabs of lithosphere that are sinking back into the mantle, some of which seem to perch on the boundary between the upper and lower mantle, rather than sinking straight through. They also note chemical differences in magma originating in different parts of the mantle—differences that are not consistent with the entire mantle being well stirred. They argue that double-layered convection is a better fit with the observations (Figure 3.13, right).
Still others argue that there may be some locations where convection goes from the bottom of the mantle to the top, and some locations where it doesn’t (Figure 3.13, middle).
Putting It Together: Lord Kelvin and the Age of the Earth
Lord Kelvin (of temperature fame) is known for getting Earth’s age wrong.
Being a physicist, he decided that thermodynamics would be a nice, simple starting point, and came up with a method that involved assuming something was spherical (mostly justified in this case).
He thought along the lines of imagining Earth starting out as a red-hot iron cannonball, and then being plunged into an icebox as cold as space (−270° C).
The cannonball would lose heat very quickly at first, but then more slowly once the outsides cooled off. At that point, heat would be slowly leaking out from the centre of the cannonball and through to the outside.
If you know how to do thermodynamics, “very quickly at first” and “more slowly once the outsides cooled off” are things you can quantify, and—most important for our story—tie to how long the cannonball has been cooling.
Lord Kelvin’s plan was to estimate Earth’s heat flow, and tie that to how long Earth had been cooling. The answer he got was between 20 and 40 million years, after accounting for uncertainties.
As you may know, Lord Kelvin’s estimate was off by at least 99%, so saying he wasn’t even close is still being very generous.
It is perhaps a good illustration of the great age of the Earth that if we round up, his answer was completely wrong.
Lord Kelvin didn’t make an error in his calculation. Where he fudged up was more basic than that.
Given what you know about where Earth’s heat comes from, what were two reasons for fudging up?
Hint: He assumed Earth cooled like a solid iron sphere.
To check your answers, navigate to the below link to view the interactive version of this activity.
References
Arevalo, R., McDonough, W., & Luong, M. (2009). The K/U ratio of earth: Insights into mantle composition, structure and thermal evolution. Earth and Planetary Science Letters, 278(3-4), 361-369. https://doi.org/10.1016/j.epsl.2008.12.023
