7.1 Magma and How It Forms
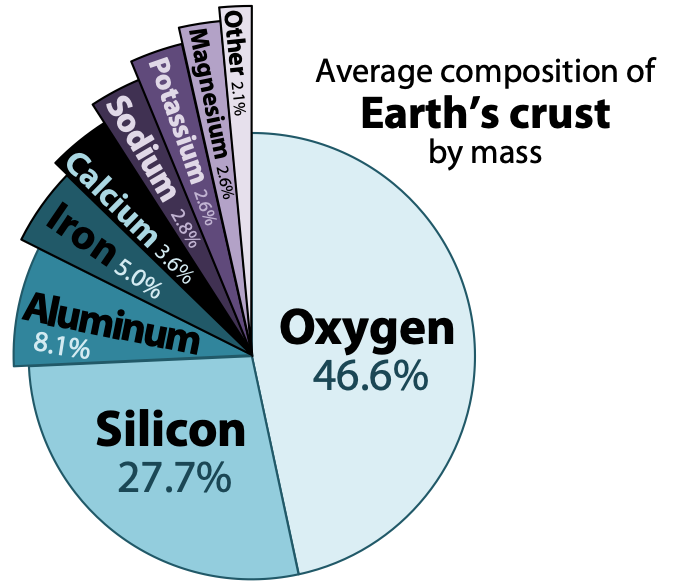
Igneous rocks form when melted rock cools, and melted rock originates within Earth as magma. Magma compositions vary, but will have eight main elements in different proportions. The most abundant elements are oxygen and silicon, followed by aluminum, iron, calcium, sodium, magnesium, and potassium. These eight elements are also the most abundant in Earth’s crust (Figure 7.2).
All magmas have varying proportions of lighter elements such as hydrogen, carbon, and sulphur. Lighter elements are converted into gases like water vapour, carbon dioxide, hydrogen sulphide, and sulphur dioxide as the magma cools.
What Controls Magma Composition?
Magma composition depends on two things:
- The composition of the rocks that melted to form the magma.
- The conditions under which the melting happened
Most igneous rock in Earth’s crust comes from magmas that formed through partial melting of existing rock, either in the upper mantle or the crust. During partial melting, only some of the minerals within a rock melt. This happens because different minerals have different melting points (temperatures at which they melt). The melt is less dense than the surrounding rock, and will percolate upward without the source rock having melted completely. The result is magma with a different composition than the original rock. Partial melting produces melt that has more silica than the original rock, because minerals higher in silica have lower melting points.
To see how partial melting works, consider the mix of materials in Figure 7.3A. It contains white blocks of candle wax, black plastic pipe, green beach glass, and pieces of aluminum wire. When the mixture is heated to 50 °C in a warm oven, the wax melts into a clear liquid (B), but the other materials remain solid. This is partial melting.
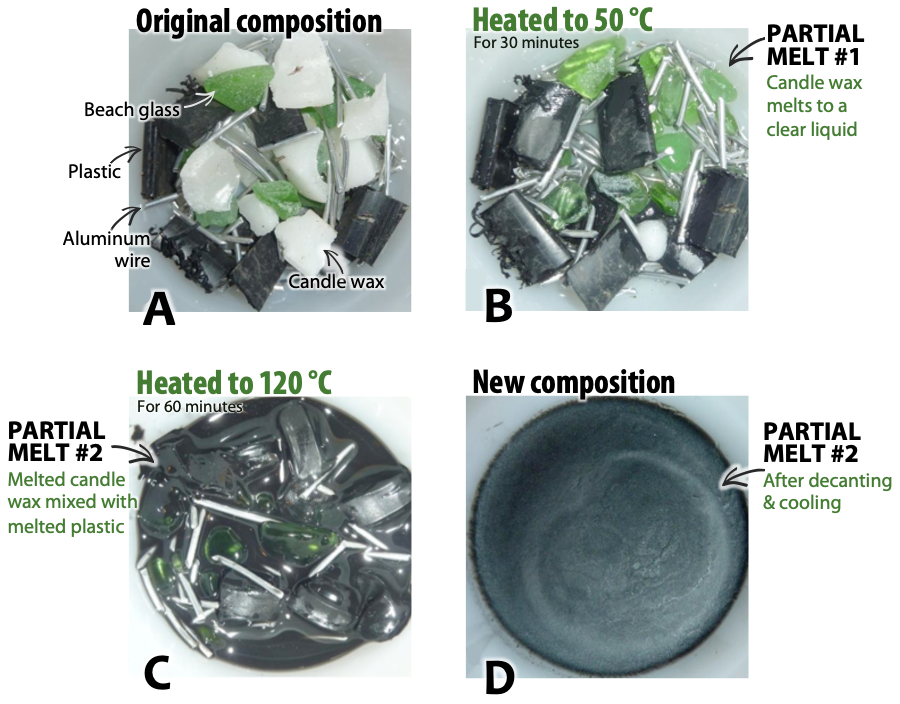
When the mixture is heated to 120 °C, the plastic melts and mixes with the wax, but the aluminum and glass still remain solid (C). This is still considered partial melting because solid materials remain. When the plastic and wax mixture is poured into a separate container and allowed to cool (D), the resulting solid has a very different composition from the original mixture. The plastic and wax are analogous to more silica-rich minerals with relatively lower melting points than other minerals in the same rock.
Of course, partial melting in the real world isn’t as simple as the example in Figure 7.3. Many rocks are much more complex than the four-component system used here. Some mineral components of rocks may have similar melting temperatures, and begin to melt at the same time. The melting temperature of a mineral may change in the presence of other minerals. Also, when rocks melt, the process can take millions of years, unlike the 90 minutes required to melt the pipe and wax in the experiment.
Concept Check: Melting Point of a Rock
A rock contains three minerals, A, B, and C, with melting points of 700 °C, 900 °C, and 1300 °C, respectively. What is the melting point of the rock?
- 700 °C, the lowest melting point of the three minerals
- 1300 °C, the highest melting point of the three minerals
- 700 °C to 1300 °C, the range covering the melting points of all the minerals
- 967 °C, the average melting point of all three minerals
To check your answers, navigate to the below link to view the interactive version of this activity.
Why Rocks Melt
The obvious answer to the question “Why do rocks melt?” is that rocks have been heated above the melting point of one or more of the minerals that make them up. Magma from partial melting of mantle rocks rises upward through the mantle, and may pool at the base of the crust, or rise through the crust. Moving magma carries heat with it, and some of that heat is transferred to surrounding rocks when the magma touches them. If the melting temperature of a rock is less than the temperature of the magma, the rock will begin to melt. This is melting by conduction.
Heat transfer is not the only way of melting rocks, however, and it doesn’t explain another conundrum: where melted mantle rocks come from. The rock that makes up the mantle begins to melt at approximately 1330 °C, and the mantle is almost entirely at temperatures above 1330 °C. Nevertheless, the mantle is in fact solid with the exception of small amounts of melt in its uppermost parts.
The answer to this paradox is that higher pressures within the mantle increase the melting point of rock compared to what it would be at Earth’s surface. For example, at the depth where the mantle temperature is 2300 °C, the melting point of mantle rock is actually 3800 °C. Clearly, a lot of additional heat would have to be added to melt those rocks, but there are other ways that melting happens. One way is to remove some of the pressure. This is called decompression melting (Figure 7.4, left).
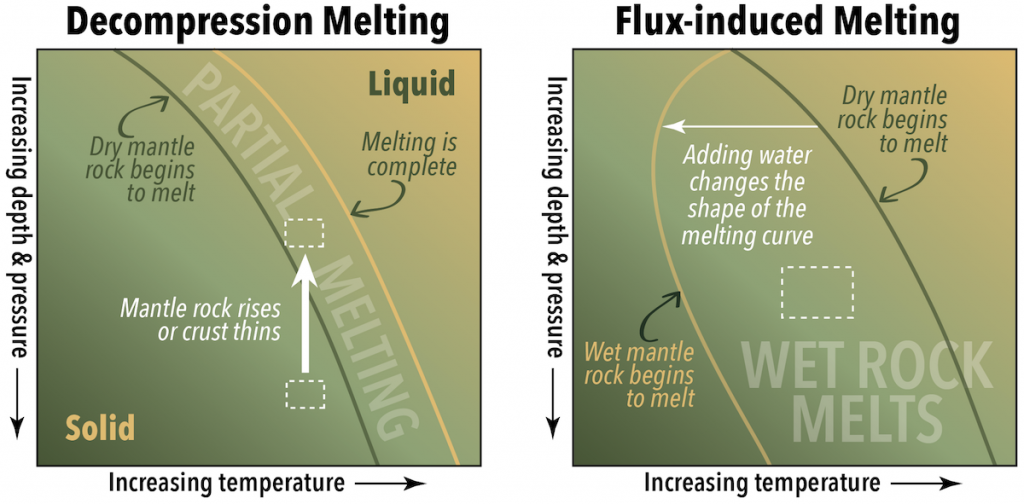
Another way to trigger melting is to disrupt the chemical environment by adding water. This is called flux-induced melting, or fluid-induced melting. When a substance such as water is added to hot rocks, the melting points of the minerals within those rocks decreases. If a rock is already close to its melting point, the effect of adding water can be enough to trigger partial melting. The added water is a flux, hence the name flux-induced melting. In Figure 7.4 (right), the parcel of rock represented by the dashed box is not hot enough to be right of the line where dry mantle rocks melt, but it is to the right of the line where wet mantle rocks melt.
Practice with Melting Types & Phase Diagrams
The image shown here is a phase diagram representing the pressure and temperature conditions under which granite and basalt will melt, with and without water. The questions that follow will help you get oriented with the phase diagram, and then test your understanding of decompression melting and fluid-induced (or flux) melting.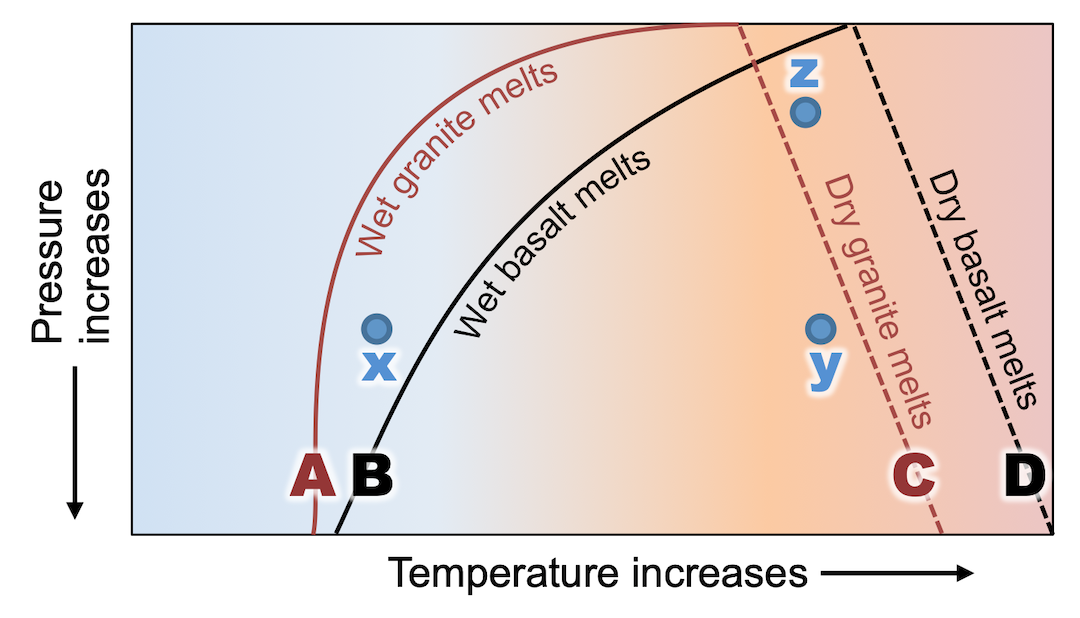
Image description: The image shows a phase diagram with a vertical axis labelled “pressure increases” and a downward pointing arrow. The horizontal axis is labelled “temperature increases” with an arrow pointing to the right. The diagram has four lines labelled A through D in order from left to right. Lines A and B are curved upward to the right, and lines C and D tilt downard to the right. Lines are labelled as follows: A- wet granite melts; B- wet basalt melts; C- dry granite melts; D- dry basalt melts. There are three points labelled x, y, and z. Point x is between lines A (“wet granite melts”) and B (“wet basalt melts”). Point y is directly across from x, and just to the left of line C, “dry granite melts.” Point z is straight above point y, and between lines C and D (“dry basalt melts”).
- Which part of the diagram represents conditions at Earth’s surface?
- The top of the diagram
- The bottom of the diagram
- Which rock has the higher melting point?
- Basalt
- Granite
- Which lines can tell you the temperature at which flux melting (or fluid-induced melting) will happen at different depths within Earth?
- A and B
- C and D
- Which point on the diagram does not represent a temperature where flux melting could happen to basalt?
- x
- y
- z
- Which path on the diagram represents decompression melting for granite?
- From x to y
- From y to x
- From y to z
- From z to y
- For the range of pressures and temperatures in this diagram, can melting happen by decompression alone for wet granite?
- Yes
- No
To check your answers, navigate to the below link to view the interactive version of this activity.
Melting and Plate Tectonics
Triggers for melting are directly related to plate tectonic processes.
Decompression happens when the lithosphere is thinning and putting less pressure on the rocks below, such as along rift zones. Decompression also occurs when mantle rocks move upward due to convection, or rise as a plume within the mantle.
Flux-induced melting happens in subduction zones. Minerals are transformed by chemical reactions under high pressures and temperatures, and a by-product of those transformations is water. Relatively little water is required to trigger partial melting. In laboratory studies of the conditions of partial melting in the Japanese volcanic arc, rocks with only 0.2% of their weight consisting of water melted by up to 25%.
Conduction can occur where lower silica melts come into contact with higher silica rocks, such as those in continental crust. Very hot mantle plumes can also melt overlying rocks.
Practice: How is Melting Triggered in Different Plate Tectonic Settings?
The image shown here is a phase diagram representing the pressure and temperature conditions under which granite and basalt will melt, with and without water. The questions that follow will help you get oriented with the phase diagram, and then test your understanding of decompression melting and fluid-induced (or flux) melting.
- Which part of the diagram represents conditions at Earth’s surface?
- The top of the diagram
- The bottom of the diagram
- Which rock has the higher melting point?
- Granite
- Basalt
- Which lines can tell you the temperature at which flux melting (or fluid-induced melting) will happen at different depths within Earth?
- A and B
- C and D
- Which point on the diagram does not represent a temperature where flux melting could happen to basalt?
- x
- y
- z
- Which path on the diagram represents decompression melting for granite?
- From x to y
- From y to x
- From y to z
- From z to y
- For the range of pressures and temperatures in this diagram, can melting happen by decompression alone for wet granite?
- Yes
- No
To check your answers, navigate to the below link to view the interactive version of this activity.
References
Kushiro, I. (2007). Origins of magmas in subduction zones: a review of experimental studies. Proceedings of the Japan Academy, Series B, Physical and Biological Sciences, 83(1), 1-15. https://www.ncbi.nlm.nih.gov/pmc/articles/PMC3756732/
