Rubino, M., Etheridge, D. M., Trudinger, C. M., Allison, C. E., Battle, M. O., Langenfelds, R. L., Steele, L. P., Curran, M., Bender, M., White, J. W. C., Jenk, T. M., Blunier, T., & Francey, R. J. (2013). A revised 1000 year atmospheric δ13C‐CO2 record from Law Dome and South Pole, Antarctica. Journal of Geophysical Research: Atmospheres 118, 8482–8499. doi:10.1002/jgrd.50668
16.5 Humans in the Earth System
The Start of Human Influence on the Earth System
Anthropogenic change in the Earth system is change caused by humans. Many discussions of anthropogenic climate-change place the start of human impacts on the Earth system at the beginning of the industrial era, in the mid 18th century. The industrial era was when humans began to use fossil fuels—at the time, mostly coal—on a much larger scale than before to do things like run manufacturing machinery and trains.
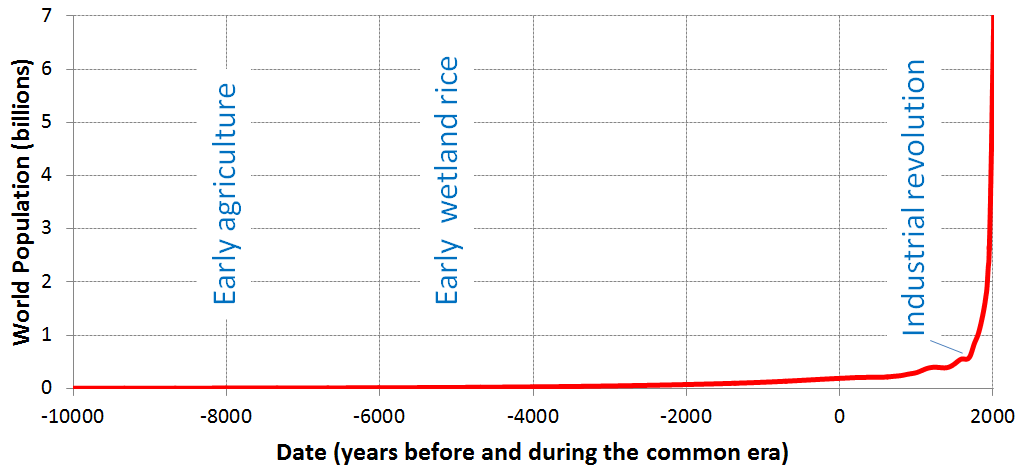
Some climate scientists place the first anthropogenic impacts much earlier, however. Some suggest that anthropogenic climate change began around 8,000 BCE when humans cleared land for agriculture in Europe and the Middle East. Clearing forests for crops is a type of climate forcing because the CO2 storage capacity of the crops is generally lower than that of the trees they replace. Some climate scientists also point to the creation of wetlands to grow rice in Asia around 5,000 BCE. Creating wetlands is a type of climate forcing because the anaerobic bacterial decay of organic matter within wetlands produces CH4.
Whether anthropogenic climate change began with the Agricultural Revolution or the Industrial Revolution may be a matter for debate for some, but it is clear that Earth-system change accelerated once the Industrial Revolution began. Part of this is due to the fact that agricultural activities had to be scaled up to feed an ever-growing population. When humans first started growing crops, the world population was approximately 5 million (Figure 16.31), fewer people than live in Toronto today. The world population rose to approximately 18 million when wetland rice cultivation began (fewer people than live within the city limits of Beijing today), to over 800 million at the start of the Industrial Revolution. The world population was estimated at 7,600 million in 2018.
The other reason humans accelerated Earth-system change after the start of the industrial era is that human activities required a source of energy, and fossil fuels such as coal and oil were that source. Fossil fuels are those derived largely from plant material that grew, died, and was partially preserved at various times throughout Earth history. The plants removed CO2 from the atmosphere when they were alive, and stored it in organic compounds in their tissues. The materials accumulated over hundreds of millions of years in settings like swampy forests, shallow seas, and deltas. When fossil fuels are burned, the stored carbon is released back into the atmosphere as CO2.
The Carbon-Isotope Fingerprints of Fossil Fuel
Carbon isotopes provide insights into the extent to which fossil fuels have impacted the Earth system, because fossil fuels have a unique carbon-isotope fingerprint that is detectable in the atmosphere and in geological materials.
Stable Carbon Isotopes (12-Carbon and 13-Carbon)
When plants transform CO2 into tissues, the process imparts a unique carbon-isotope signature to the resulting organic matter. Plants preferentially take in CO2 with the isotope 12C over CO2 with isotope 13C. They do so in a consistent way, giving plant tissues a distinctive ratio of 13C to 12C. Fossil fuels are derived from plant materials, and they preserve this isotopic ratio.
The ratio of 13C to 12C is commonly expressed relative to a standard to give numbers that are easy to work with and compare. The notation δ13C refers to the ratio of 13C to 12C in a sample compared to the ratio in a standard, and is expressed in parts per thousand (or per mil, ‰). The standard has a δ13C of 0‰. Carbon in plant tissues has a δ13C of -25‰ to -30‰, meaning it has a 13C to 12C ratio that is 25 to 30 parts per thousand lower than the standard. Burning fossil fuel releases CO2 with that ratio into the atmosphere.
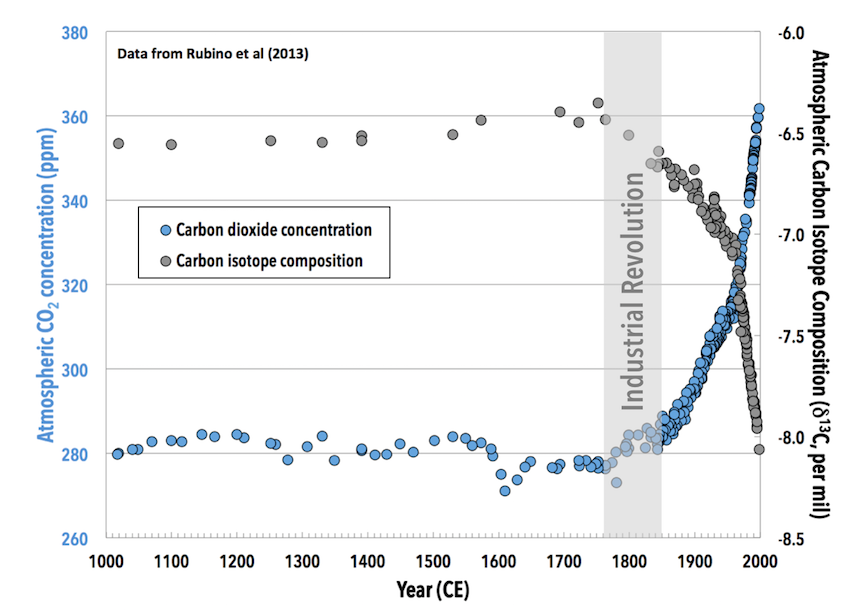
For most of the past 1000 years, the atmosphere has had a δ13C of approximately -6.5‰. The carbon-isotope composition of organic matter is much lower than that of the atmosphere, so the mixing in of carbon from fossil fuels causes the over-all carbon-isotope composition of the atmosphere to decrease. An analogy for mixing low δ13C CO2 into the atmosphere is rapidly adding cold water to a hot bathtub. The faster the cold water is added, the faster the bathwater will cool. The colder the water being added, the faster the bathwater will cool. In this analogy, the atmosphere is the bathtub, and fossil fuels are the water being added. The low δ13C value of fossil fuels (-25‰ to -30‰) is like very cold water being added.
As we would expect, the carbon isotope composition of the atmosphere takes a sudden downward turn at the same time that humans undertake the Industrial Revolution, and begin burning large quantities of fossil fuels, adding CO2 to the atmosphere at an accelerating rate (Figure 16.32).
Scientists who study past climates on Earth are familiar with carbon-isotope records like this one, because such records are used to reconstruct major changes in the Earth system through their impact on the carbon cycle. In carbon-isotope records from the distant past, a shift of more than 1.5‰ would be enough to catch the attention of a researcher and make them wonder what could have happened.
What is unusual about the 1.5‰ drop today in comparison to those observed in the geological record is how rapidly it is happening. It is more common to see such changes happen over millions of years, not hundreds of years. The rate at which atmospheric CO2 δ13C is dropping is approximately 10 times faster than the carbon-isotope shift at the PETM, which is the fastest event ever documented in the rock record.
Carbon dioxide in the atmosphere mixes into the oceans, where organisms take up carbonate ions to make calcium carbonate shells. The 1.5‰ drop has been imprinted in the calcium carbonate of marine organisms like sponges (Böhm et al, 2002), and will remain in the rock record globally, as evidence of human activity. Because of this, and because of many other such markers that are being left in the rock record by human activities (the presence of plastic, for example), some have suggested that it is time to define a new division of geological time, the Anthropocene Epoch. The start of the Anthropocene Epoch would mark the point at which human activities became evident in the geological record.
Radioactive Carbon (14-Carbon)
Carbon-14 dating relies on the fact that 14C decays to 14N at a known rate. By knowing the rate, and how much 14C and 14N are present, we can work out how long the decay has been happening. Knowledge of the decay rate of 14C also makes it useful to track fossil fuel additions to the atmosphere.
The rate of decay of a radioactive isotope is expressed as a half-life, which in this case is the amount of time it would take half of the 14C atoms in a sample to decay to 14N. The half-life of 14C is 5,730 years. After 10 half-lives, or 57,300 years, there isn’t enough 14C left to do an age measurement. Fossil fuels are millions to hundreds of millions of years old, long enough for there to be none of the 14C originally contained by the plant material.
There is a notation system for 14C similar to the δ13C notation system for the ratio of 13C to 12C, in which the amount of 14C is compared to a standard. Carbon-14 amounts are reported as Δ14C values in units of ‰. In that system, the atmosphere as a whole had a Δ14C of 45‰ in 2010, and fossil fuels have a Δ14C of -1000‰. Effectively, the atmosphere appears to be aging rapidly. In the bathtub analogy for carbon isotopes, adding CO2 from fossil fuels is like dumping ice into the tub.
The effects of fossil fuel CO2 on atmospheric Δ14C levels must account for 14C being made through natural processes in the atmosphere, and decaying away; for the decay of a large pulse of 14C created by nuclear bomb tests; and for other sources of carbon with very low Δ14C values. Fortunately for scientists tracking fossil fuels by their impact on atmospheric Δ14C, the contribution of low Δ14C CO2 from other sources is tiny compared to known rates of fossil fuel emissions, and the other quantities are also well known. Thus, they have been able to determine a decrease in Δ14C of 3‰ for every 1 ppm of CO2 added from fossil fuels.
The Carbon Cycle and Change in Today’s Earth System
Change in the Earth system is strongly driven by Earth’s carbon cycle, the interrelated materials and processes that change carbon from one form to another, and move it from one reservoir to another (Figure 16.33). The CO2 in the atmosphere is just one part of the carbon cycle. Carbon in the atmosphere is taken in by marine and terrestrial plants, and released when they are decomposed. Microbial activities in the soil and respiration by plants release carbon. Carbon also moves into and out of the ocean through exchange processes at the ocean’s surface.
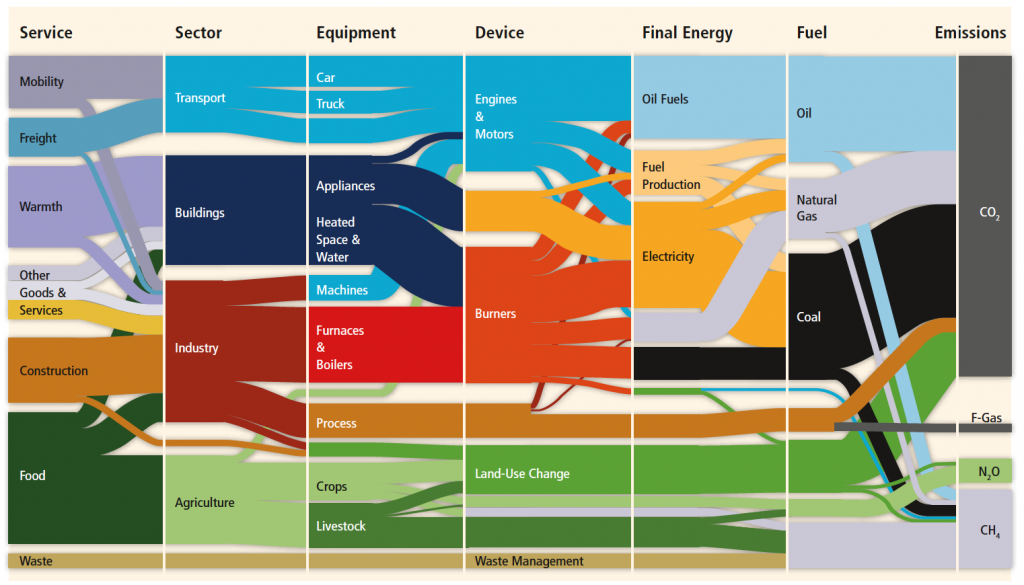
In the carbon cycle today, natural processes as a whole comprise far more of the flow in the carbon cycle than human activities do. For comparison, the relative sizes of flows in Figure 16.33 are illustrated by the size of the arrows. As of 2012, human activities were responsible for approximately 9 billion tons (9 Gt) of carbon added to the atmosphere per year. A large part of the 9 Gt comes from burning oil, coal, and gas, and some from changes in how land is used (e.g., clearing forests to plant crops, Figure 16.34). Some comes from changes that humans have made that affect the ability of the Earth system to take up carbon.
The Earth system has accommodated the 9 billion tons by taking up an additional 3 billion tons per year in photosynthesis, and dissolving an additional 2 billion tons per year in the ocean. The remaining 4 billion tons accumulates in the atmosphere each year because the Earth system does not presently have the capacity to remove it.
The fossil fuels added by humans are particularly problematic because burning them means releasing hundreds of millions of years worth of plant-stored carbon that would otherwise not have been an active part of the carbon cycle today. Contrast this with cutting down a tree and burning the wood. Burning the wood also releases CO2 from carbon that was stored in plant tissues, but the difference is in timescale and quantity. If a tree grows for 50 years before it is used as fuel, then over a century there is effectively no change in atmospheric CO2. What carbon the tree took out of the atmosphere decades before, burning and decomposition have returned.
For fossil fuels, on the other hand, the carbon was removed from the atmosphere tens or even hundreds of millions of years ago. Trees draw down CO2 before we burn them, balancing out the equation, but with fossil fuels there is no initial draw-down from our present atmosphere. Releasing the carbon stored in those fuels results in a net addition to the atmosphere. What makes this even worse is that because fossil fuels have been accumulating for so long, there is an enormous quantity that can be burned. Trees can only be burned as fast as they replace themselves, but with fossil fuels it is like accumulating trees for millions of years, then burning them all at once.
Signals of Present-Day Earth-System Change
Rising Temperatures
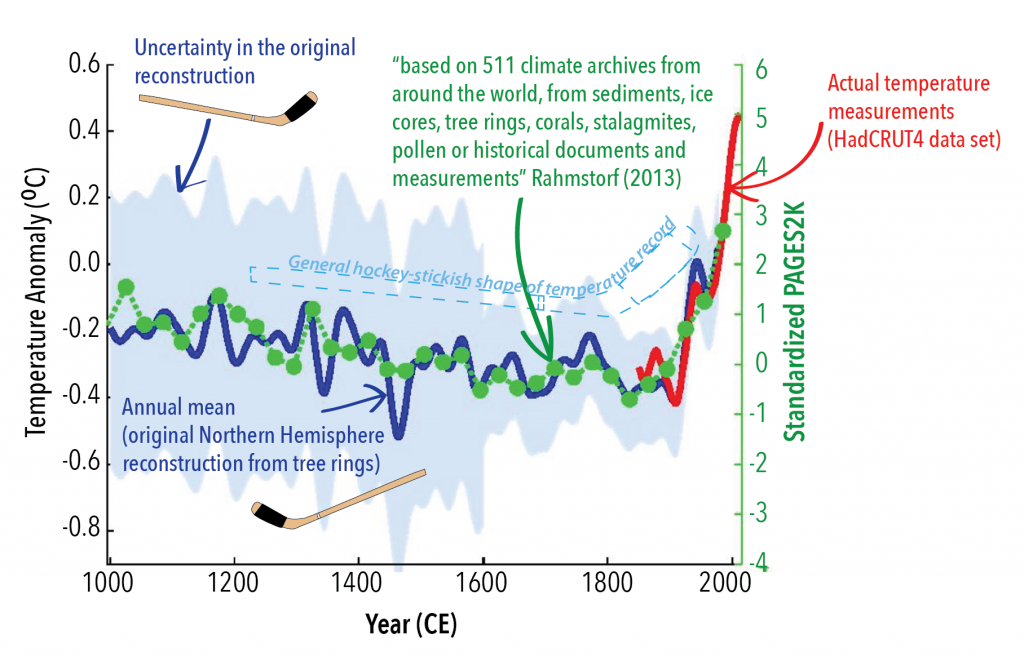
From studies of Earth’s past climate history, it is clear what to expect as atmospheric CO2 levels rise. Climate warming is one outcome. We know from ice core records that global average temperatures are warmer now than they have been for most of the last 800,000 years (Figure 16.22). Over the shorter term, direct measurements show that the climate has been on a warming trend after the start of the Industrial Revolution (Figure 16.9). Proxy data making up a revised version of the “hockey stick” diagram—so named because the shape reminded some people of a hockey stick laying on its side—take the record back to 1000 years ago, and show global average temperatures falling until the onset of the industrial era (Figure 16.35).
Sea Level Change
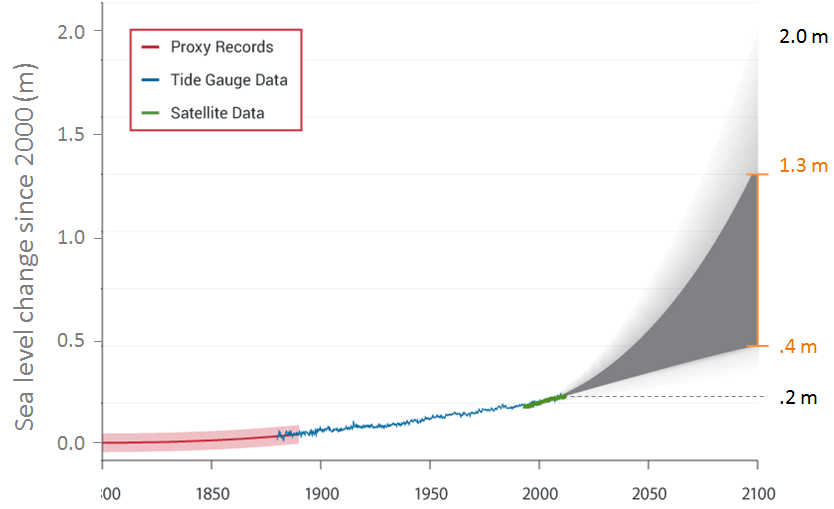
As of April 2018, global sea level has risen approximately 28 cm since 1800. According to satellite data, the average rate of change since 1993 has been a rise of approximately 3 mm per year. Part of the rise is due to the expansion of seawater as it warms. Another part of the rise is from water added by melting glaciers and other year-round land-based snow and ice. Note that melting of sea ice—ice already floating in the ocean—does not contribute directly to sea-level rise because the ice is already floating in the ocean.
Based on how much melting has occurred thus far, sea levels are projected to rise to between 47 cm and 130 cm above 1880 levels (Figure 16.36). However, there is some uncertainty about how melting rates will respond to changes in the Earth system that result from climate change, such as changes in currents, or seawater beneath the leading edge of melting ice sheets warming the ice from beneath. With that uncertainty factored in, sea level rise could be as low as 33 cm above 1880 levels, or more than 2 m higher.
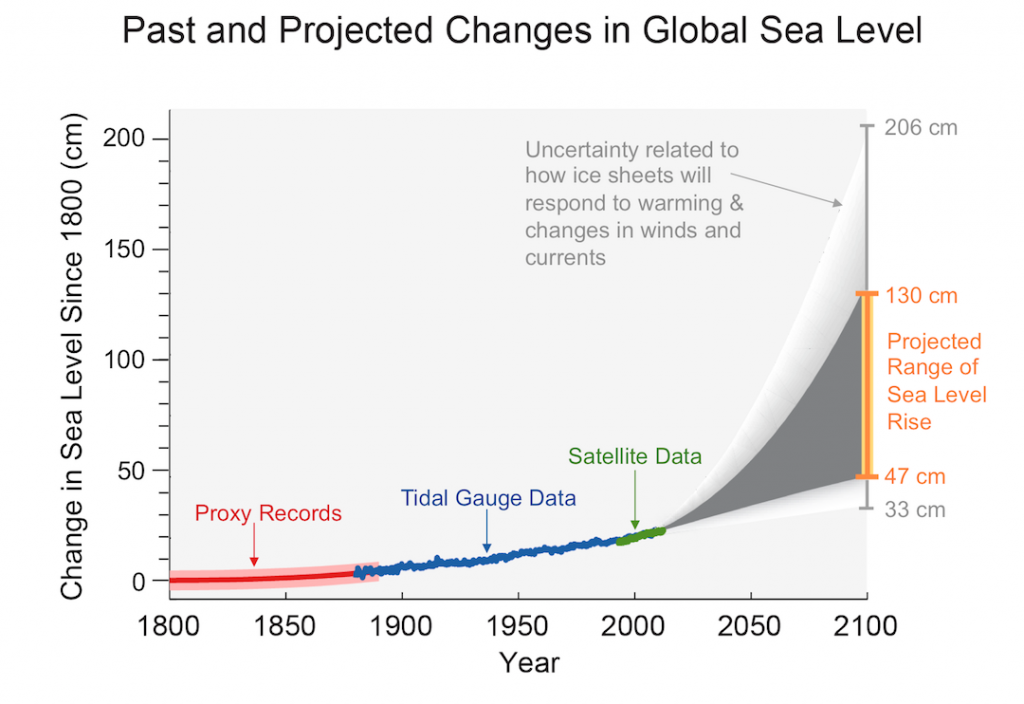
Keep in mind that the global average is indeed an average. Where ocean waters experience more warming, and thus more thermal expansion, sea level rise may be greater than elsewhere. Regions that are rebounding as ice melts could experience less sea level rise, or even a fall in sea level, because the elevation of the terrain is actually increasing over time. On the other hand, regions on the peripheral bulge around the margins of ice sheets could experience greater than average sea level rise because the terrain will subside at the same time that the oceans are gaining volume.
Areas that become flooded could experience greater than average sea level rise, because the weight of water causes the land to subside further. In the aftermath of Hurricane Harvey in September of 2017, measurements were reported that showed subsidence of up to 1.5 cm in the region of Houston, Texas. In this case, some of the subsidence could have been from sediments being compressed under the weight of flood waters, however the weight of water, like the weight of ice, does cause the crust to float lower in the mantle.
Melting Ice Sheets
Keeping track of how rapidly ice sheets are melting is important both for being able to predict future sea level change, and for knowing in general how rapidly the Earth system is changing. In a recent study, Bamber et al. (2018) analyzed satellite measurements to determine how much mass had been lost from the Antarctic ice sheets, the Greenland Ice Sheet, and from other glaciers and ice caps around the world since 1992 (Figure 16.37).
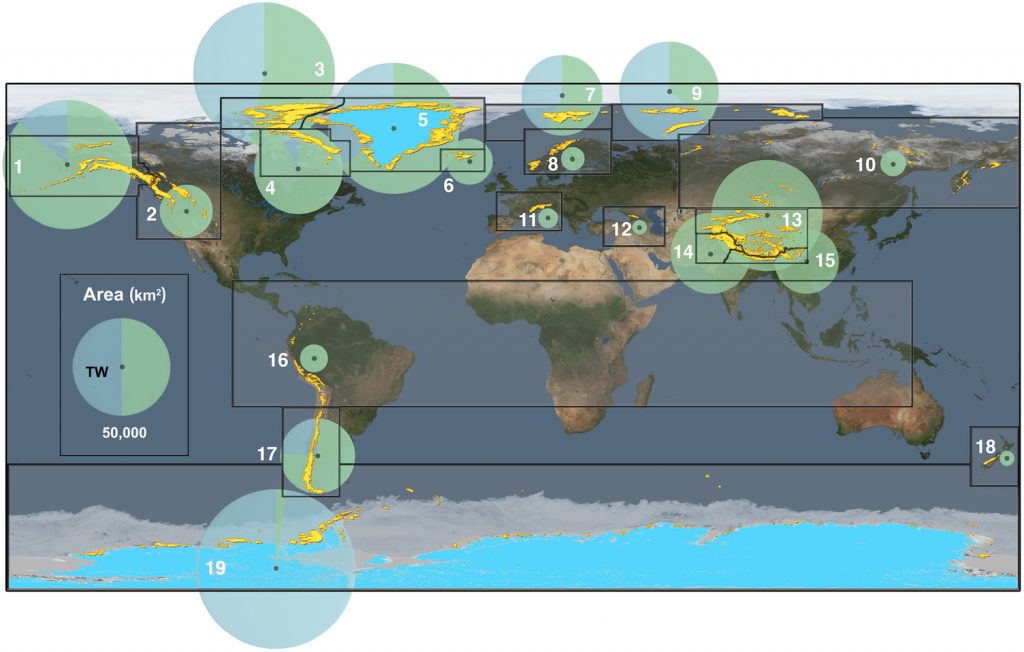
The study found that over all, the mass of ice in ice sheets, ice caps, and glaciers has been falling at an increasing rate since 1992, and therefore adding to sea level at an increasing rate (Figure 16.38). The exception is the East Antarctic Ice Sheet, which actually showed an increase in mass during the studied interval. This is because snowfall has increased in the East Antarctic, to the point where more snow is falling now than at any time in the past 2000 years (Medley et al., 2017). The East Antarctic is warming just as the West is, but the difference is that the winds that preferentially bring precipitation to the East rather than the West can carry more moisture because the air is warmer.

Concept Check: Evidence of Human Influence on the Carbon Cycle
Fill in the missing words to complete the summary.
Human activities may have affected the carbon cycle as early as 8,000 BCE, but it wasn’t until humans began to undertake activities that atmospheric levels began to rise rapidly.
At the same time, the atmosphere began to take on the characteristics of derived from . This is the chemical fingerprint of .
Although some flows of carbon in the carbon cycle are much larger than flows, the natural carbon cycle can’t carbon fast enough to what humans are adding.
Fill-in-the-blank options:
- ancient carbon
- agricultural
- balance
- natural
- carbon isotope
- carbon dioxide
- anthropogenic
- fossil fuel
- remove
- industrial
- plant matter
To check your answers, navigate to the below link to view the interactive version of this activity.
References
Bajželj, B., Allwood, J. M., and Cullen, J. M. (2013). Designing Climate Change Mitigation Plans That Add Up. Environmental Science & Technology 47, 8062-8069. doi: 10.1021/es400399h. http://pubs.acs.org/doi/pdf/10.1021/es400399h
Bamber, J. L., Westaway, R. M., Marzeion, B., & Wouters, B. (2018). The land ice contribution to sea level during the satellite era. Environmental Research Letters 13(2018). https://doi.org/10.1088/1748-9326/aac2f0
Böhm, F., Haase-Schramm, A., Eisenhauer, A., Dullo, W.-C., Joachimski, M. M., Lehnert, H., & Reitner, J. (2002). Evidence for preindustrial variations in the marine surface water carbonate system from coralline sponges. Geochem. Geophys. Geosyst., 3(3), 10.1029/2001GC000264. http://onlinelibrary.wiley.com/doi/10.1029/2001GC000264/epdf
Earth System Research Laboratory, Global Monitoring Division, NOAA (n.d.). The data: What 14C tells us. https://www.esrl.noaa.gov/gmd/outreach/isotopes/c14tellsus.html
Fischedick M., Roy, J., Abdel-Aziz, A., Acquaye, A., Allwood, J. M., Ceron, J.-P., Y. Geng, Y., Kheshgi, H., Lanza, A., Perczyk, D., Price, L., Santalla, E., Sheinbaum, C., and Tanaka, K. (2014). Industry. In: Climate change 2014: Mitigation of climate change. Contribution of working group III to the fifth assessment report of the intergovernmental panel on climate change. Edenhofer, O., Pichs-Madruga, R., Sokona, Y., Farahani, E., Kadner, S., Seyboth, K., Adler, A., Baum, I., Brunner, S., Eickemeier, P., Kriemann, B., Savolainen, J., Schlömer, S., von Stechow, C., Zwickel, T., and Minx, J. C. (eds.). Cambridge University Press, Cambridge, United Kingdom and New York, NY, USA. https://www.ipcc.ch/pdf/assessment-report/ar5/wg3/ipcc_wg3_ar5_chapter10.pdf
Madrigal, A. C. (2017, September 5) The Houston flooding pushed the Earth’s crust down 2 centimeters. https://www.theatlantic.com/technology/archive/2017/09/hurricane-harvey-deformed-the-earths-crust-around-houston/538866/
Medley, B., McConnell, J. R., Neumann, T. A., Reijmer, C. H., Chellman, N., Sigl, M., & Kipfstuhl, S. (2018). Temperature and Snowfall in Western Queen Maud Land Increasing Faster Than Climate Model Projections. Geophysical Research Letters, 45(3), 1472-1480. https://doi.org/10.1002/2017GL075992
Rahmstorf, S. (2013). Most comprehensive paleoclimate reconstruction confirms hockey stick. https://thinkprogress.org/most-comprehensive-paleoclimate-reconstruction-confirms-hockey-stick-e7ce8c3a2384/
Roser, M., & Ortiz-Ospina E. (2018). World population growth. https://ourworldindata.org/world-population-growth
